

Thioredoxin reductase 1 and NADPH directly protect protein tyrosine phosphatase 1B from inactivation during H2O2 exposure
- PMID: 28684416
- PMCID: PMC5582832
- DOI: 10.1074/jbc.M117.793745
Thioredoxin reductase 1 and NADPH directly protect protein tyrosine phosphatase 1B from inactivation during H2O2 exposure
Abstract
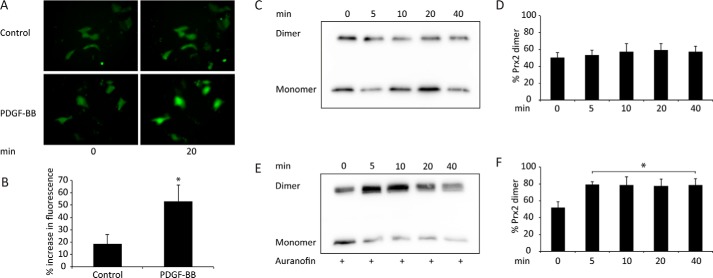
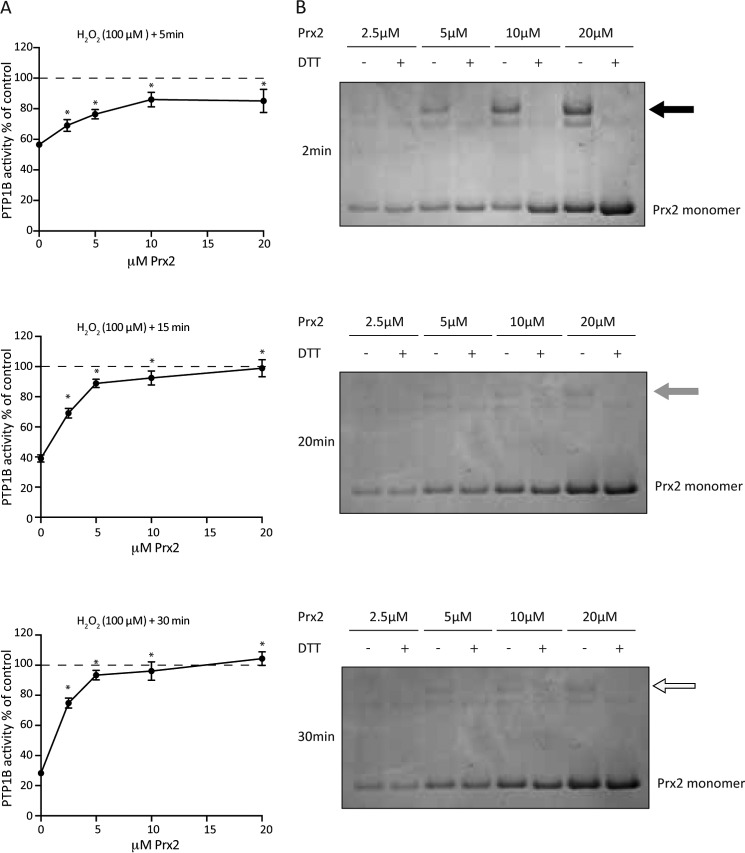
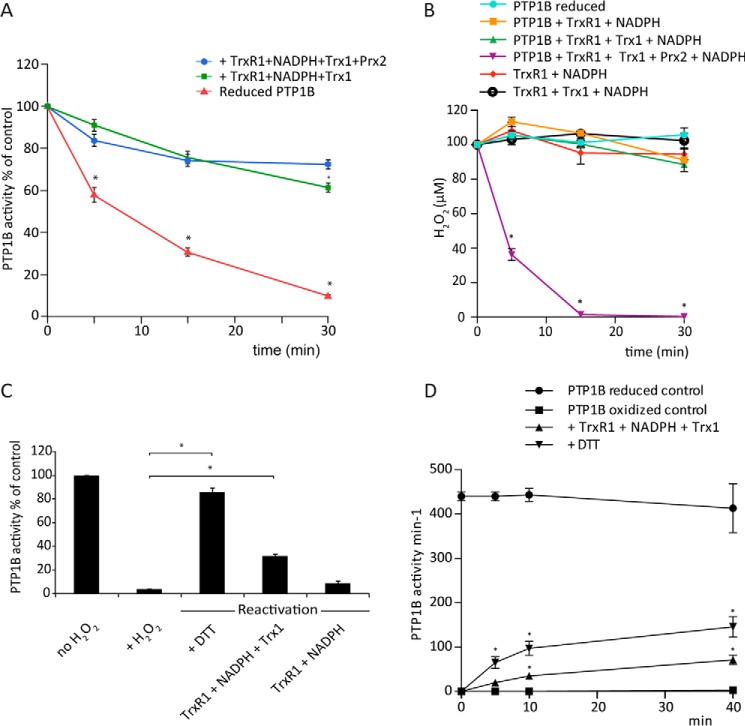
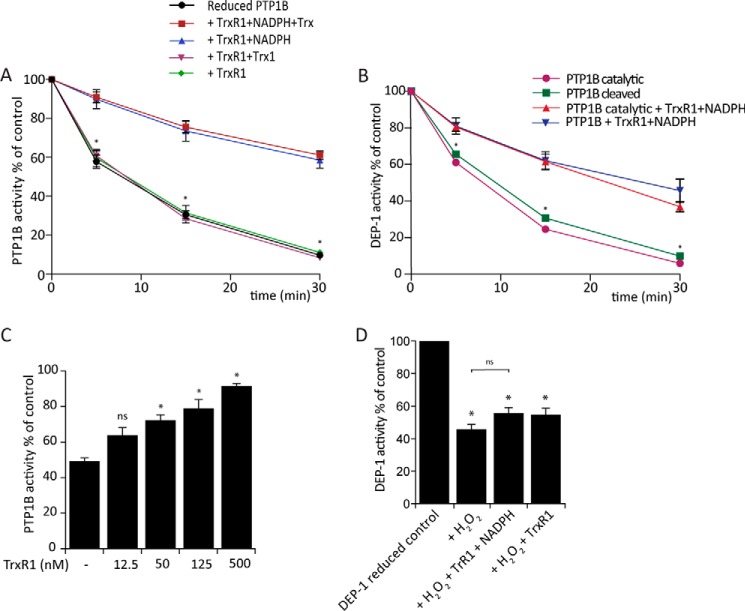
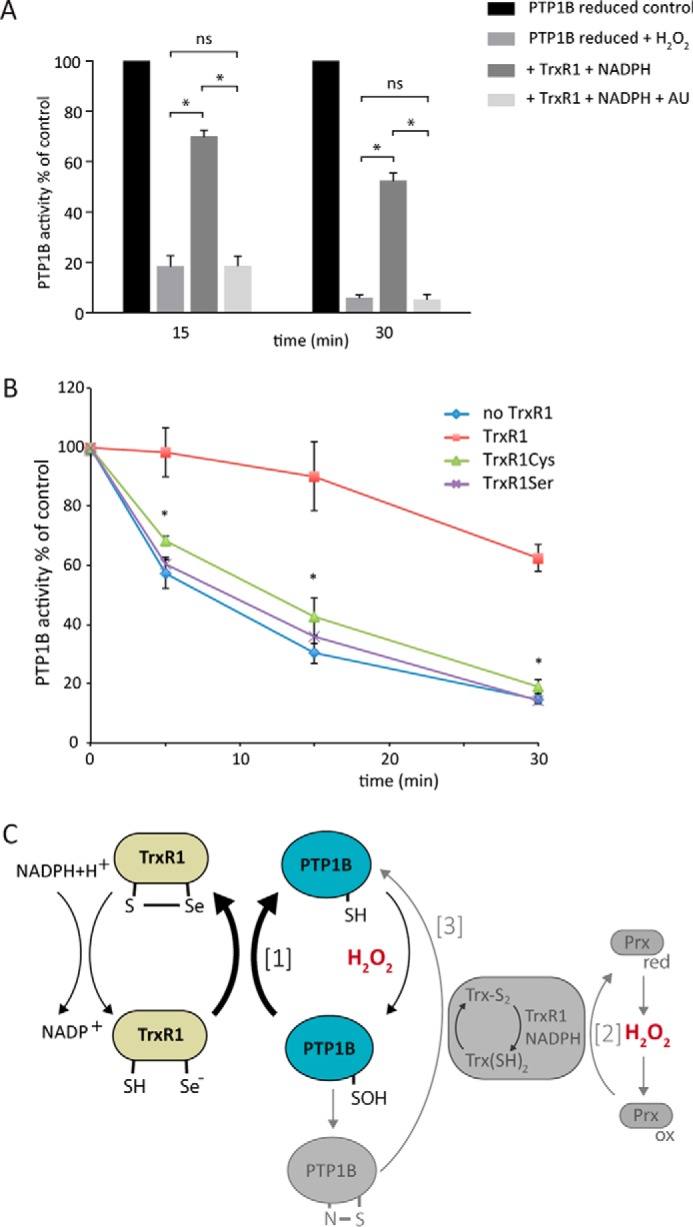
Regulation of growth factor signaling involves reversible inactivation of protein tyrosine phosphatases (PTPs) through the oxidation and reduction of their active site cysteine. However, there is limited mechanistic understanding of these redox events and their co-ordination in the presence of cellular antioxidant networks. Here we investigated interactions between PTP1B and the peroxiredoxin 2 (Prx2)/thioredoxin 1 (Trx1)/thioredoxin reductase 1 (TrxR1) network. We found that Prx2 becomes oxidized in PDGF-treated fibroblasts, but only when TrxR1 has first been inhibited. Using purified proteins, we also found that PTP1B is relatively insensitive to inactivation by H2O2 but found no evidence for a relay mechanism in which Prx2 or Trx1 facilitates PTP1B oxidation. Instead, these proteins prevented PTP1B inactivation by H2O2 Intriguingly, we discovered that TrxR1/NADPH directly protects PTP1B from inactivation when present during the H2O2 exposure. This protection was dependent on the concentration of TrxR1 and independent of Trx1 and Prx2. The protection was blocked by auranofin and required an intact selenocysteine residue in TrxR1. This activity likely involves reduction of the sulfenic acid intermediate form of PTP1B by TrxR1 and is therefore distinct from the previously described reactivation of end-point oxidized PTP1B, which requires both Trx1 and TrxR1. The ability of TrxR1 to directly reduce an oxidized phosphatase is a novel activity that can help explain previously observed increases in PTP1B oxidation and PDGF receptor phosphorylation in TrxR1 knockout cells. The activity of TrxR1 is therefore of potential relevance for understanding the mechanisms of redox regulation of growth factor signaling pathways.
Keywords: growth factor signaling; hydrogen peroxide; peroxiredoxin; protein tyrosine phosphatase (tyrosine phosphatase); redox regulation; thiol oxidation; thioredoxin reductase.
© 2017 by The American Society for Biochemistry and Molecular Biology, Inc.
Conflict of interest statement
The authors declare that they have no conflicts of interest with the contents of this article
Figures

Similar articles
-
Bicarbonate is essential for protein-tyrosine phosphatase 1B (PTP1B) oxidation and cellular signaling through EGF-triggered phosphorylation cascades.J Biol Chem. 2019 Aug 16;294(33):12330-12338. doi: 10.1074/jbc.RA119.009001. Epub 2019 Jun 13. J Biol Chem. 2019. PMID: 31197039 Free PMC article.
-
Selective activation of oxidized PTP1B by the thioredoxin system modulates PDGF-β receptor tyrosine kinase signaling.Proc Natl Acad Sci U S A. 2013 Aug 13;110(33):13398-403. doi: 10.1073/pnas.1302891110. Epub 2013 Jul 30. Proc Natl Acad Sci U S A. 2013. PMID: 23901112 Free PMC article.
-
Inhibitory nitrosylation of mammalian thioredoxin reductase 1: Molecular characterization and evidence for its functional role in cellular nitroso-redox imbalance.Free Radic Biol Med. 2016 Aug;97:375-385. doi: 10.1016/j.freeradbiomed.2016.06.032. Epub 2016 Jul 1. Free Radic Biol Med. 2016. PMID: 27377780
-
Thioredoxin Reductase Inhibition for Cancer Therapy.Annu Rev Pharmacol Toxicol. 2022 Jan 6;62:177-196. doi: 10.1146/annurev-pharmtox-052220-102509. Epub 2021 Aug 24. Annu Rev Pharmacol Toxicol. 2022. PMID: 34449246 Review.
-
TrxR1 as a potent regulator of the Nrf2-Keap1 response system.Antioxid Redox Signal. 2015 Oct 1;23(10):823-53. doi: 10.1089/ars.2015.6378. Epub 2015 Jun 24. Antioxid Redox Signal. 2015. PMID: 26058897 Free PMC article. Review.
Cited by
-
Effects of Mammalian Thioredoxin Reductase Inhibitors.Handb Exp Pharmacol. 2021;264:289-309. doi: 10.1007/164_2020_393. Handb Exp Pharmacol. 2021. PMID: 32767140
-
Redox regulation of PTPN22 affects the severity of T-cell-dependent autoimmune inflammation.Elife. 2022 May 19;11:e74549. doi: 10.7554/eLife.74549. Elife. 2022. PMID: 35587260 Free PMC article.
-
Thioredoxin-related protein of 14 kDa as a modulator of redox signalling pathways.Br J Pharmacol. 2019 Feb;176(4):544-553. doi: 10.1111/bph.14479. Epub 2018 Oct 6. Br J Pharmacol. 2019. PMID: 30129655 Free PMC article. Review.
-
Sulfenylation of Human Liver and Kidney Microsomal Cytochromes P450 and Other Drug-Metabolizing Enzymes as a Response to Redox Alteration.Mol Cell Proteomics. 2018 May;17(5):889-900. doi: 10.1074/mcp.RA117.000382. Epub 2018 Jan 26. Mol Cell Proteomics. 2018. PMID: 29374135 Free PMC article.
-
Qualitative Differences in Protection of PTP1B Activity by the Reductive Trx1 or TRP14 Enzyme Systems upon Oxidative Challenges with Polysulfides or H2O2 Together with Bicarbonate.Antioxidants (Basel). 2021 Jan 14;10(1):111. doi: 10.3390/antiox10010111. Antioxidants (Basel). 2021. PMID: 33466723 Free PMC article.
References
-
- Tonks N. K. (2006) Protein tyrosine phosphatases: from genes, to function, to disease. Nat. Rev. Mol. Cell Biol. 7, 833–846 - PubMed
-
- Alonso A., Sasin J., Bottini N., Friedberg I., Friedberg I., Osterman A., Godzik A., Hunter T., Dixon J., and Mustelin T. (2004) Protein tyrosine phosphatases in the human genome. Cell 117, 699–711 - PubMed
-
- Jayavelu A. K., Müller J. P., Bauer R., Böhmer S. A., Lässig J., Cerny-Reiterer S., Sperr W. R., Valent P., Maurer B., Moriggl R., Schröder K., Shah A. M., Fischer M., Scholl S., Barth J., et al. (2016) NOX4-driven ROS formation mediates PTP inactivation and cell transformation in FLT3ITD-positive AML cells. Leukemia 30, 473–483 - PubMed
-
- Frijhoff J., Dagnell M., Godfrey R., and Ostman A. (2014) Regulation of protein tyrosine phosphatase oxidation in cell adhesion and migration. Antioxid. Redox Signal. 20, 1994–2010 - PubMed
Publication types
MeSH terms
Substances
LinkOut - more resources
Full Text Sources
Other Literature Sources
Research Materials
Miscellaneous
