Comparative Study
. 2017 Sep 15;292(37):15161-15179.
doi: 10.1074/jbc.M117.795245. Epub 2017 Jul 6.

Non-canonical proteolytic activation of human prothrombin by subtilisin from Bacillus subtilis may shift the procoagulant-anticoagulant equilibrium toward thrombosis

Affiliations
Comparative Study

Non-canonical proteolytic activation of human prothrombin by subtilisin from Bacillus subtilis may shift the procoagulant-anticoagulant equilibrium toward thrombosis

Giulia Pontarollo et al. J Biol Chem. .

Abstract

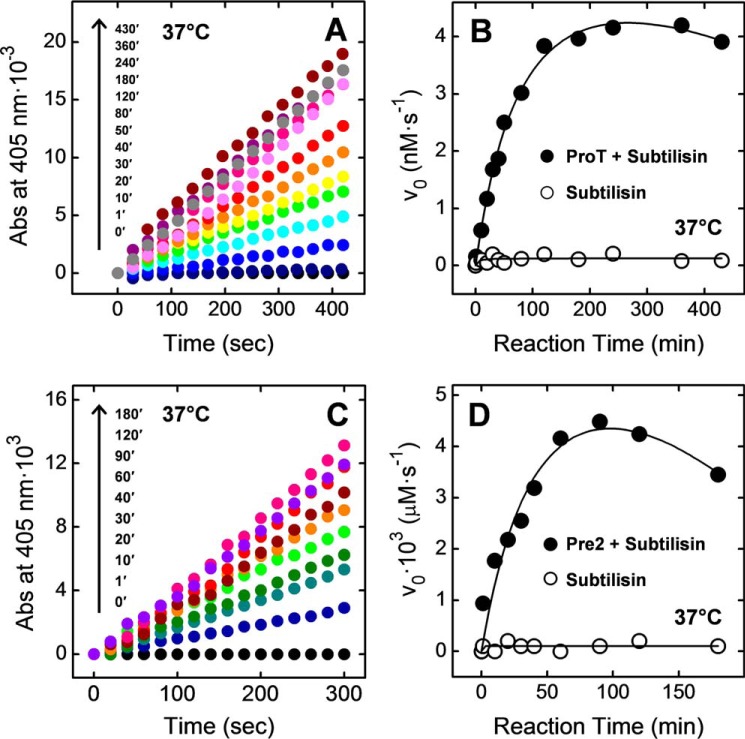
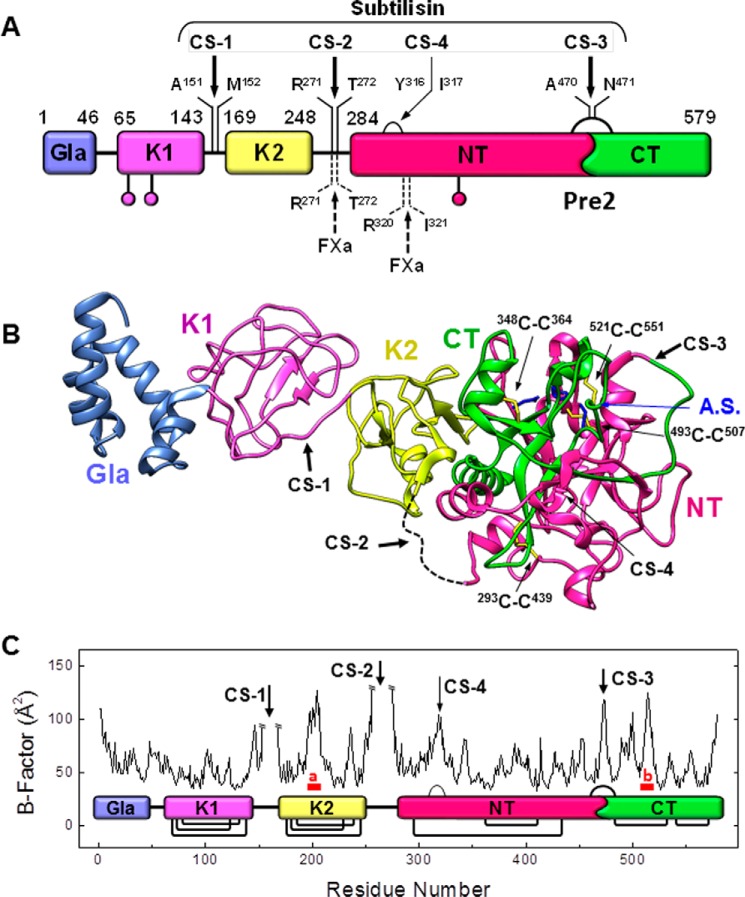
Blood coagulation is a finely regulated physiological process culminating with the factor Xa (FXa)-mediated conversion of the prothrombin (ProT) zymogen to active α-thrombin (αT). In the prothrombinase complex on the platelet surface, FXa cleaves ProT at Arg-271, generating the inactive precursor prethrombin-2 (Pre2), which is further attacked at Arg-320-Ile-321 to yield mature αT. Whereas the mechanism of physiological ProT activation has been elucidated in great detail, little is known about the role of bacterial proteases, possibly released in the bloodstream during infection, in inducing blood coagulation by direct proteolytic ProT activation. This knowledge gap is particularly concerning, as bacterial infections are frequently complicated by severe coagulopathies. Here, we show that addition of subtilisin (50 nm to 2 μm), a serine protease secreted by the non-pathogenic bacterium Bacillus subtilis, induces plasma clotting by proteolytically converting ProT into active σPre2, a nicked Pre2 derivative with a single cleaved Ala-470-Asn-471 bond. Notably, we found that this non-canonical cleavage at Ala-470-Asn-471 is instrumental for the onset of catalysis in σPre2, which was, however, reduced about 100-200-fold compared with αT. Of note, σPre2 could generate fibrin clots from fibrinogen, either in solution or in blood plasma, and could aggregate human platelets, either isolated or in whole blood. Our findings demonstrate that alternative cleavage of ProT by proteases, even by those secreted by non-virulent bacteria such as B. subtilis, can shift the delicate procoagulant-anticoagulant equilibrium toward thrombosis.

Keywords: coagulation factor; infection; proteolysis; prothrombin; serine protease.


Conflict of interest statement

The authors declare that they have no conflicts of interest with the contents of this article

Figures

Figure 1.
Figure 1.
Time-course expression of thrombin-like hydrolytic activity during proteolysis of ProT (A and B) and Pre2 (C and D) by subtilisin. A, ProT (0.1 mg/ml, 350 μl) was treated in TBS added with 5 mm CaCl2 at 37 °C with subtilisin (0.05 μg/ml) at an enzyme/ProT ratio of 1:2000 (w/w). At increasing time points, an aliquot (28 μl) of the proteolysis mixture was added to a solution of the chromogenic substrate S2238 (20 μm) in HBS. The time-course release of pNA was monitored at 37 °C by recording the absorbance increase at 405 nm. The slope of the straight lines was taken as the initial velocity, v0, of S2238 hydrolysis by the active thrombin-like species. B, ●, plot of v0 as a function of the reaction time of ProT with subtilisin at 37 °C. ○, control measurements were as follows: S2238 (20 μm) was incubated at 37 °C with subtilisin (0.05 μg/ml) in the absence of ProT. C, Pre2 was treated under identical experimental conditions as in A. At time points, aliquots (15 μl) of the proteolysis mixture were taken and tested for activity on S2238 substrate. D, ●, plot of v0 as a function of the reaction time of Pre2 with subtilisin at 37 °C. ○, control measurements were carried out as in A. The fitting curves are only intended to help the reader to follow the data points.
Figure 2.
Figure 2.
Time-course analysis of the proteolysis reaction of ProT by subtilisin. A, non-reducing electrophoretic analysis of the time-course reaction of ProT (0.1 mg/ml) with subtilisin (0.05 μg/ml) at 37 °C. At time points, aliquots (100 μl, 10 μg) of the proteolysis mixtures were precipitated with cold TCA, analyzed by SDS-PAGE (4–12% acrylamide), and Coomassie stained. std, molecular weight protein standards. B, RP-HPLC analysis of the proteolysis reaction of ProT with subtilisin at 37 °C after a 1-min (black line) and a 10-min (blue line) reaction. Aliquots (20 μg) of the reaction mixtures were loaded onto a C4 analytical column, eluted with an aqueous acetonitrile, 0.1% TFA gradient (dashed line). The chemical identity of material eluted in correspondence of the major peaks was established by high-resolution MS, and mass values are reported in Table 1.
Figure 3.
Figure 3.
Schematic representation of the subtilisin CS on ProT. A, domain architecture of ProT. The numbers identify the N- and C-terminal ends of the zymogen domains, according to the ProT sequence numbering: Gla, γ-carboxyglutamic acid-rich domain; K1, kringle-1 domain; K2, kringle-2 domain; Pre2, prethrombin-2 domain; NT and CT are the N- and C-terminal fragments of Pre2 derived from cleavage of Pre2 by subtilisin. Non-physiological cleavage sites by subtilisin are on the top side of the ProT sequence, whereas physiological cleavage sites by factor Xa are on the bottom side. B, ribbon drawing of the structure of ProT deletion mutant des(154–167), ProTΔ(154–167) (Protein Data Bank code 5edm) lacking 14 amino acids in the linker-2 region connecting K1 and K2 domains (4). Dashed lines represent unresolved linker regions in the X-ray structure. The cleavage sites are indicated by arrows, whereas SS bonds in Pre2 domain are in yellow. The amino acids forming the active site (A.S.) are in blue. C, B-factor flexibility plot of ProTΔ(154–167). The minor cleavage at CS-4 is indicated by a thinner arrow. Sequences marked in red and identified with small letters (a and b) correspond to those regions in ProTΔ(154–167) which, albeit displaying substantial conformational flexibility, are not cleaved by subtilisin. Segment a encompasses the sequence Ala-197–His-205, which is embedded in a short α-helical secondary structure in the zymogen and therefore is expected to be protected from proteolysis (30). Segment b spans the sequence 512PDEGKRGD519, contributing to the Na+-binding site in mature αT. It is highly charged, and for this reason it does not meet the substrate specificity requirements for subtilisin cleavage (26, 27). Protein structures were visualized with the ViewerPro 4.2 software (Accelerys Inc.), and the B-factor plot was generated using the What-If software (76).
Figure 4.
Figure 4.
Time-course analysis of the proteolysis reaction of Pre2 by subtilisin. A–D, electrophoretic analysis of the time course reaction of Pre2 (2.8 μm) with subtilisin (1.8 nm). In all experiments, Pre2 (0.1 mg/ml) was reacted at the indicated temperatures in TBS, containing 5 mm CaCl2, with subtilisin at an enzyme/Pre2 ratio of 1:2000 (w/w). At time points, aliquots (50 μl, 5 μg) of the proteolysis mixtures were precipitated with cold TCA, analyzed by SDS-PAGE (4–14% acrylamide) under non-reducing conditions, and Coomassie-stained. std, molecular weight protein standards. E, kinetics of the of subtilisin-catalyzed proteolysis of Pre2, as determined by densitometric analysis of residual intact Pre2 in the gels reported in A–D. The data points were fitted with Equation 1, yielding kcat/Km values as indicated. F, representative RP-HPLC plots of the proteolysis reaction of Pre2 with subtilisin after a 10-min reaction at 37 °C (black line) and after 90 min at 10 °C (blue line). Aliquots (20 μg) of the reaction mixtures were loaded onto a C4 analytical column, eluted with a linear aqueous, 0.1% TFA gradient (dashed line). The chemical identity of the protein material eluted from the chromatographic peaks was established by N-terminal sequencing and LC-MS/MS analysis as follows: Pre2, prethrombin-2; NT, fragment Thr-272–Ala-470; CT, fragment Asn-471–Glu-579; NT*, fragment NT nicked at the peptide bond Tyr-316–Ile-317. G, kinetics of subtilisin-catalyzed proteolysis of Pre2 at 37 °C monitored by RP-HPLC. The concentration of residual intact Pre2 at different reaction times was estimated by integrating the area of the chromatographic peak of Pre2, as in F. After data fitting with Equation 1, the kcat/Km value was estimated, as reported.
Figure 5.
Figure 5.
Purification and storage stability of σPre2. A, purification of σPre2 by heparin-Sepharose affinity chromatography. For micro-preparative purposes, a ProT solution (300 μg, 0.1 mg/ml) was treated for 24 h at 10 °C with subtilisin (0.05 μg/ml) in TBS, added with 5 mm CaCl2. The reaction mixture was loaded onto a HiTrap (0.7 × 2.5 cm) heparin-Sepharose column, which was equilibrated with TBS and then eluted with a gradient of NaCl (- - -). The material eluted in correspondence to fractions F1 to F3 (200 μl) was precipitated with cold TCA for subsequent electrophoretic and functional analyses. Inset, SDS-PAGE (4–14% acrylamide) of the fractions eluted from the affinity column, under non-reducing conditions and Coomassie staining. B, hydrolytic activity of the fractions eluted from heparin-Sepharose column. Aliquots (60 μl) of F1 (green circle), F2 (blue circle), and F3 (black circle) fractions, as in A, were immediately added to an S2238 solution (20 μm) in HBS, and the time course release of pNA was monitored at 37 °C by recording the absorbance increase at 405 nm. The storage stability of σPre2 was evaluated after incubation of F3 fraction for 24 h at 4 °C (red circle).
Figure 6.
Figure 6.
Spectroscopic characterization of σPre2, Pre2, and αT. A and B, far-UV CD (A) and fluorescence (B) spectra of purified σPre2 (red line), Pre2 (blue line), and αT. CD spectra were recorded at a protein concentration of 4 μm in PBS. Fluorescence spectra were taken at a protein concentration of 30 nm in TBS, pH 8.0, containing 0.2 m ChCl, after exciting the protein samples at 280 nm. The λmax value of αT and Pre2 (334 nm) is shifted to 340 nm in σPre2. All measurements were carried out at 25 °C, and the resulting spectra were corrected for the corresponding base lines. C, ribbon drawing superposition of Pre2 (3sqe, purple) and αT (1ppb, orange, red). Relevant amino acids side chains are colored cyan for Pre2 and yellow for αT structure. The approximate position of relevant thrombin regions are indicated. The aromatic cluster formed by Trp-148, Trp-215, Trp-60d, and Tyr-60a is evident in the structure of Pre2 (cyan).
Figure 7.
Figure 7.
Probing the structure of the Na+ site (A) and active site (B–F) of σPre2 (red circle) and αT (black circle). A, fluorescence measurements of sodium binding to σPre2 and αT. Samples (15 nm, 1.5 ml) of σPre2 and αT in TBS, pH 8.0, containing increasing concentrations of NaCl were excited at 280 nm and constant temperature (25 ± 0.1 °C). The fluorescence intensity was recorded at the emission λmax of the proteins, i.e. 334 nm for αT and 340 nm for σPre2. The data are expressed as FF0, where F0 is the fluorescence intensity in the absence of NaCl. The data points were interpolated with Equation 2 yielding the Kd values for Na+ binding, as indicated. The ionic strength was kept constant at 1 m with ChCl. B, fluorescence binding of PABA to σPre2 and αT. Increasing concentrations of PABA were added to protein samples (200 nm, 1.5 ml). Excitation wavelength was at 336 nm, whereas the fluorescence intensity was recorded at 375 nm. Kd values were obtained by fitting the data points to Equation 2, describing the one-site binding model. Fluorescence binding of FPR (C) and Hir(1–47) (F) to σPre2 and αT is shown. To a solution of σPre2 or αT (100 nm, 1.5 ml) increasing concentrations of ligands were added, and protein samples were excited at 280 nm with FPR or at 295 nm with Hir(1–47). The fluorescence intensity was recorded at the emission λmax of αT (334 nm) or σPre2 (340 nm). The data points relative to the binding of FPR to σPre2 and αT and those of Hir(1–47) binding to σPre2 were interpolated with Equation 2, whereas the binding of Hir(1–47) to αT were fitted to Equation 3, describing the tight binding model. D and E, inhibition of αT and σPre2 by PPACK. D, progress curves of pNA generation by αT (black lines) and σPre2 (red lines) in the absence (dashed lines) and presence (continuous lines) of PPACK. Aliquots (400 μl) of αT or σPre2 stock solutions were added at 37 °C in HBS, pH 7.4, to a solution of substrate (20 μm) and PPACK, as indicated. At each time point, the rate of pNA release (v) was estimated from the slope of the tangent lines (gray) to the progress curve. E, plot of vt/v0 versus time. The data points were interpolated with Equation 9 to yield the values of kobs and kon for PPACK inhibition of αT and σPre2.
Figure 8.
Figure 8.
Probing the structure of exosite-1 (A) and -2 (B–D) of σPre2 (red circle) and αT (black circle). A, binding of hirugen to σPre2 and αT. Solutions (1.5 ml) of σPre2 (150 nm) or αT (50 nm) were added with increasing hirugen concentrations. The protein samples were excited at 280 nm, and the fluorescence intensity was recorded at the λmax of the two enzymes, i.e. 334 nm for αT and 340 nm for σPre2. The data points were interpolated with Equation 2. All fluorescence measurements were carried out in HBS at 37 °C. B–D, binding of GpIbα(268–282) to σPre2 and αT. B, scheme of biotinyl-PEG-GpIbα(268–282) peptide anchoring onto a neutravidin-coated C1 sensor chip. C, SPR sensograms relative to the binding of σPre2 to immobilized biotinyl-PEG-GpIbα(268–282). D, plot of RUmax versus the concentration of σPre2 or αT injected in the mobile phase. SPR measurements were carried out at 25 °C in HBS-EP+, and Kd values were obtained by fitting the data points to Equation 4.
Figure 9.
Figure 9.
Substrate specificity and catalytic efficiency of σPre2 and αT on S2238, protein C, fibrinogen, and PAR1(38–60). A, substrate specificity of σPre2. Purified σPre2 (red circle) (30 nm, final concentration) was added to solutions of chromogenic substrates (20 μm) in HBS at 37 °C, each specific for αT (S2238), aPC (S2366), or factor Xa (S2765), and the release of pNA was monitored at 405 nm. For comparison, the activity of 100 pm human αT (black circle) on the same substrates is also reported. B, determination of the kinetic constants of S2238 hydrolysis by σPre2. The initial rate of pNA release from S2238 (20 μm) by σPre2 (30 nm, red circle) and αT (50 pm, black circle) was measured at 37 °C in HBS, 0.1% PEG (200 μl, final volume). From the interpolation of the data points with the Michaelis-Menten equation (Equation 5), kcat and Km values were obtained as best-fit parameters (Table 2). C, aPC generation by αT (black circle) or σPre2 (red circle). To a solution of PC (50 nm) in HBS, pH 7.5, 5 mm CaCl2 at 37 °C in the presence of TM (10 nm) and S2366 (40 μm) were added aliquots of αT or σPre2, as indicated. The concentration of pNA released from S2366 by aPC was monitored at 405 nm in a continuous assay. The resulting progress curves were analyzed as in Ref. (continuous lines) to extract the values of kcat/Km relative to PC activation by αT or σPre2 (Table 2). D, release of fibrinopeptides A and B from human fibrinogen. The release of FpA (black and red circles) and FpB (black and red squares) from human fibrinogen (0.35 μm) by σPre2 (30 nm) (red circle, red square) or αT (0.3 nm) (black circle, black square) was carried out at 37 °C in HBS, and quantified by RP-HPLC (see “Experimental procedures”). Interpolation of the data points with Equations 6 and 7 yielded the apparent specificity constants (kcat/Km) of FpA and FpB release for σPre2 and αT (Table 2). E, cleavage of PAR1(38–60). The cleavage of PAR1(38–60) peptide (1 μm) by σPre2 (10 nm) (red circle) or αT (0.1 nm) (black circle) was carried out at 25 °C in HBS. The time course of PAR1(42–60) fragment release was quantified by RP-HPLC, and the data points were fitted with Equation 8, describing the kinetics of product formation under pseudo-first order conditions. For clarity, the lower and upper time scale refers to the experiment run with σPre2 (red circle) and αT (black circle), respectively. The estimated kcat/Km values are reported in Table 2.
Figure 10.
Figure 10.
Fibrin generation and platelet aggregation induced by σPre2 and αT. A, turbidimetric analysis of fibrin generation induced by 50 nm σPre2 (dashed lines) or 50 nm αT (continuous lines) on purified fibrinogen (black lines) or diluted (1:2) human plasma (red lines). To a human fibrinogen solution (440 nm, 800 μl) in HBS at 37 °C, containing 0.1% PEG-8000, was added αT (50 nm) or σPre2 (50 nm), and the time-course generation of fibrin was monitored by recording the absorbance increase of the solution at 350 nm. With human plasma samples, the absorbance change was recorded at 671 nm (right-hand scale). For clarity, the lower time scale (0–3 min) refers to the experiment run with αT, and the upper time scale (0–150 min) refers to the experiment run with σPre2. The absorbance scale for both experiments is the same (0–0.25 AU). B, turbidimetric analysis of fibrin generation induced by different concentrations of subtilisin (0.25 IU = 2 μm, red line) (50 nm, blue line) on diluted (1:2) plasma. From each clotting curve, the values of Sm, tm, tc, and ΔAmax were extracted, as indicated (Table 3 and “Experimental procedures”). C, impedance aggregometry analysis of platelet aggregation induced by σPre2 or αT at 37 °C in WB (blue line) or GFPs (black line). WB from healthy donors (300 μl; 160,000 platelets/μl) was diluted with HBS (320 μl), containing αT or σPre2 to a final concentration of 0.5 and 50 nm, respectively. A similar procedure was used with GFP (200.000 platelets/μl). D, histogram of the normalized platelets aggregation potency of σPre2 and αT expressed as AUC/[E] ratio, where [E] is the molar enzyme concentration. Each value is the average of single determinations on blood samples from three healthy donors. The error bars correspond to the standard deviation.
Figure 11.
Figure 11.
Mechanism of zymogen activation in σPre2 and αT. A, effect of time-course carbamylation of σPre2 on the rate of S2238 substrate hydrolysis. Time-course hydrolysis of σPre2 (open red circle and solid red circle) and αT (open black circle and solid black circle) in the absence and presence of potassium cyanate. Solutions of σPre2 (1 μm) in HBS, pH 7.0, were incubated at 37 °C in the absence (open red circle) and presence (solid red circle) of 0.2 m KCNO. At the indicated time points, aliquots (40 μl; 50 nm final concentration) were taken, and the initial rate (vi) of S2238 (20 μm) hydrolysis was determined in HBS at 37 °C. For comparison, the activity of αT (100 pm, final concentration) determined in the absence (open black circle) and presence (solid black circle) of KCNO is also reported. The data are expressed as the percent residual activity, (vi/v0) × 100, where vi and v0 are the rates of hydrolysis determined at time ti and 0, respectively. After interpolating the kinetic data with Equation 9, describing the irreversible enzyme inhibition under pseudo-first order conditions, the corresponding rate constants (kon) were determined for σPre2 (4.8 × 10⁻² m−1·min−1) and αT (1.6 × 10⁻² m−1·min−1). B, schematic representation of the physiological and non-physiological Pre2 zymogen activation by factor Xa or bacterial subtilisin, respectively. After physiological cleavage of the peptide bond Arg-15–Ile-16 by FXa in Pre2, the newly generated dipeptide Ile-16–Val-17, swings into the 194-cleft and triggers substrate-binding sites and oxyanion hole formation, required for catalysis. Likewise, after non-physiological cleavage by subtilisin at the peptide bond Ala-149a–Asn-149b in the exposed γ-loop of Pre2, the new N-terminal dipeptide Asn-149b–Val-149c can enter the 194-cleft and evoke zymogen activation. C, transparent surface representation of Pre2 showing Asp-194 positioned at the bottom of a deep cleft in ProT structure (Protein Data Bank code 5edm) shaped by the two β-barrels of Pre2. The cleavage sites for FXa (Arg-15–Ile-16) and subtilisin (Ala-149a–Asn-149b) are also indicated.
Scheme 1
Scheme 1
Scheme 2
Scheme 2

Similar articles

Cited by

References

    1. Roberts H. R., Hoffman M., and Monroe D. M. (2006) A cell-based model of thrombin generation. Semin. Thromb. Hemost. 32, 32–38 - PubMed
    1. Versteeg H. H., Heemskerk J. W., Levi M., and Reitsma P. H. (2013) New fundamentals in hemostasis. Physiol. Rev. 93, 327–358 - PubMed
    1. Butenas S., van't Veer C., and Mann K. G. (1999) “Normal” thrombin generation. Blood 94, 2169–2178 - PubMed
    1. Pozzi N., Chen Z., and Di Cera E. (2016) How the linker connecting the two kringles influences activation and conformational plasticity of prothrombin. J. Biol. Chem. 291, 6071–6082 - PMC - PubMed
    1. Mann K. G., Krishnaswamy S., and Lawson J. H. (1992) Surface-dependent hemostasis. Semin. Hematol. 29, 213–226 - PubMed

Publication types

MeSH terms

Associated data

LinkOut - more resources