. 2017 Jul;29(7):1773-1793.
doi: 10.1105/tpc.16.00877. Epub 2017 Jul 6.

Arabidopsis ATRX Modulates H3.3 Occupancy and Fine-Tunes Gene Expression

Affiliations

Arabidopsis ATRX Modulates H3.3 Occupancy and Fine-Tunes Gene Expression

Céline Duc et al. Plant Cell. 2017 Jul.

Abstract

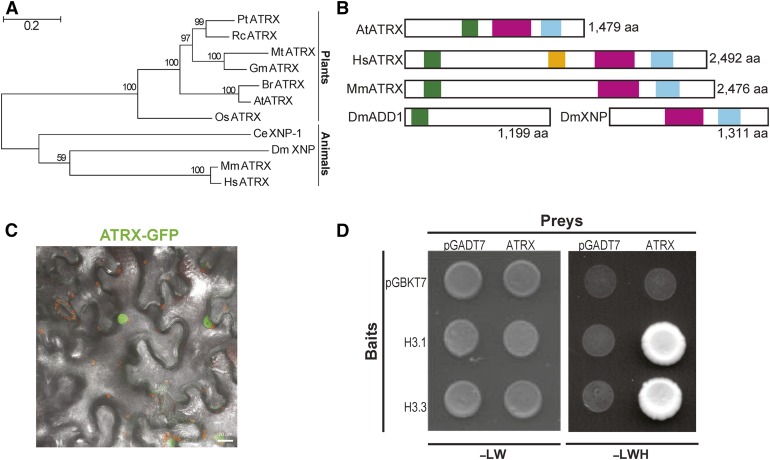
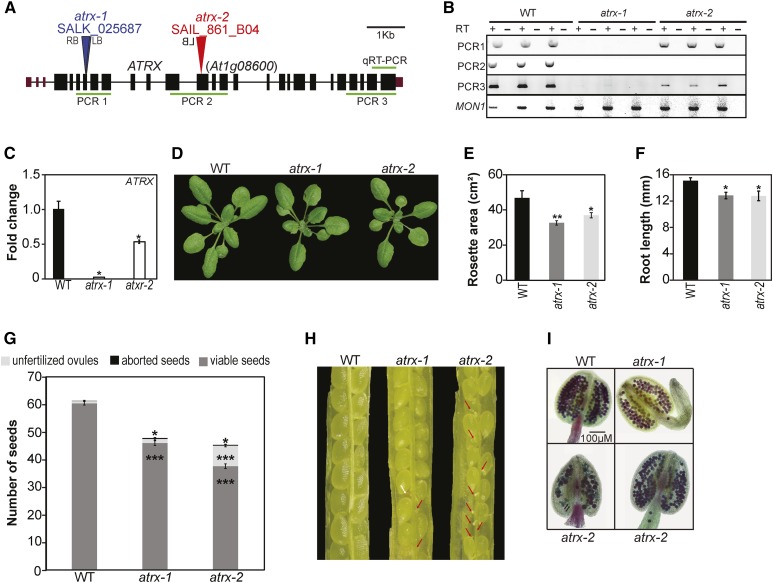
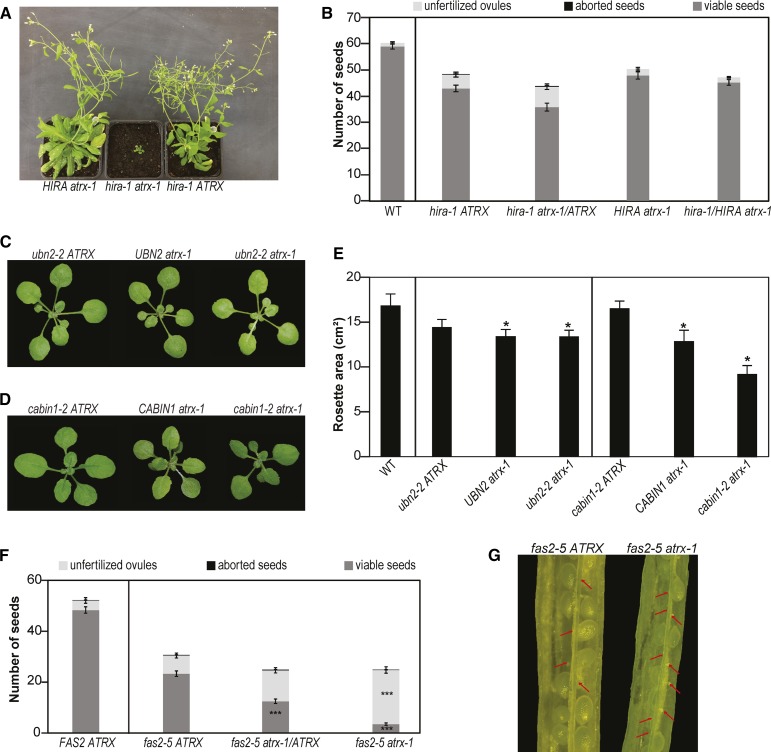
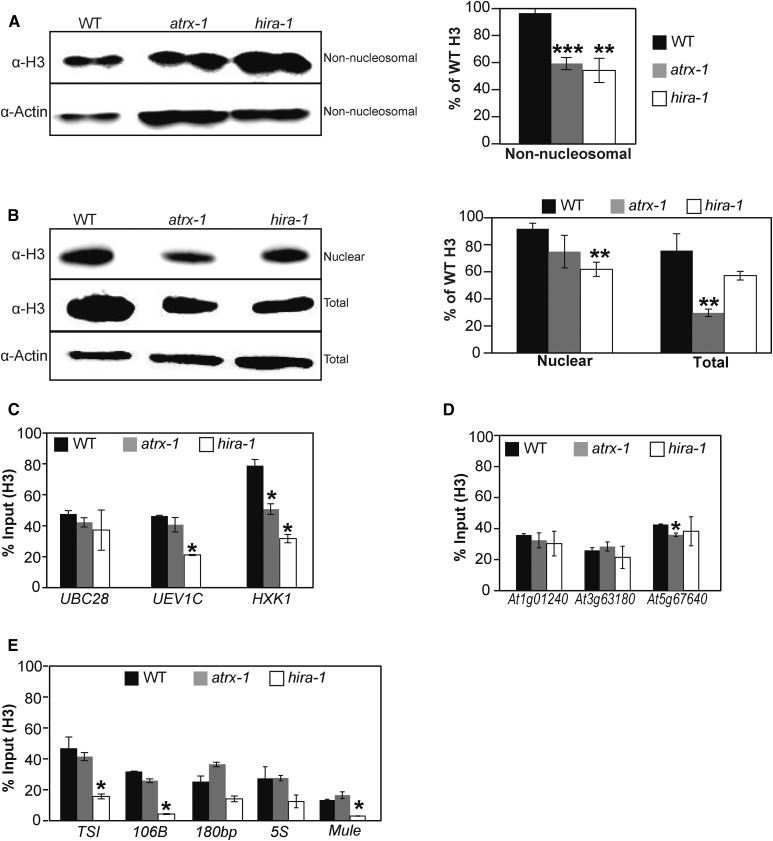
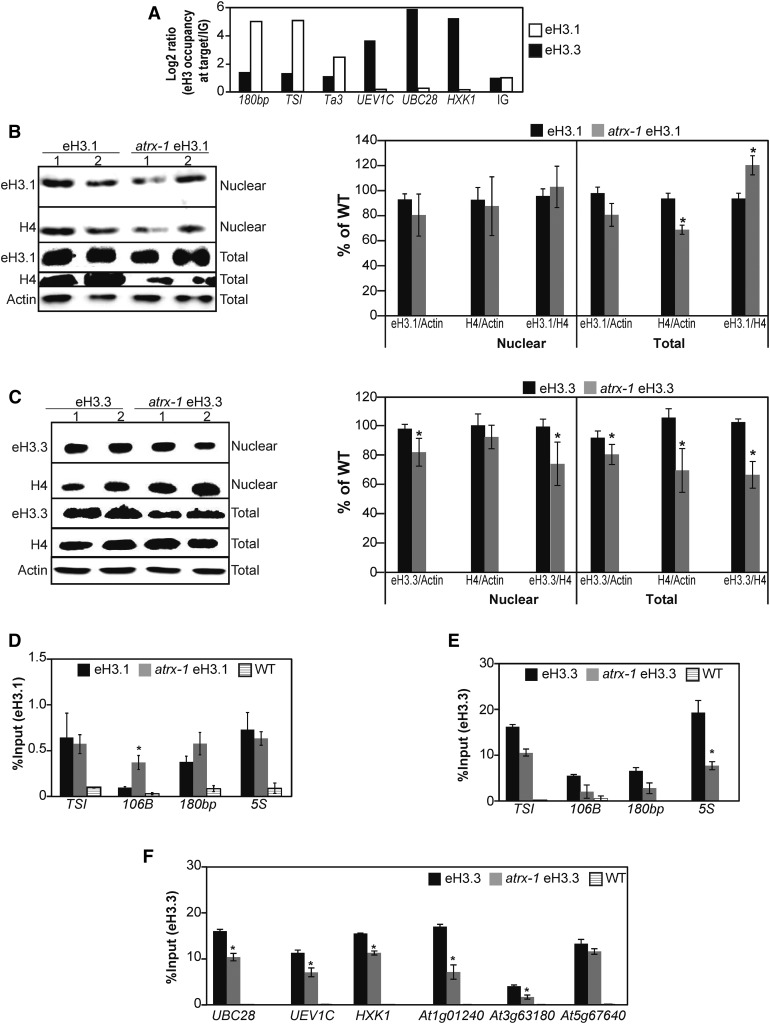
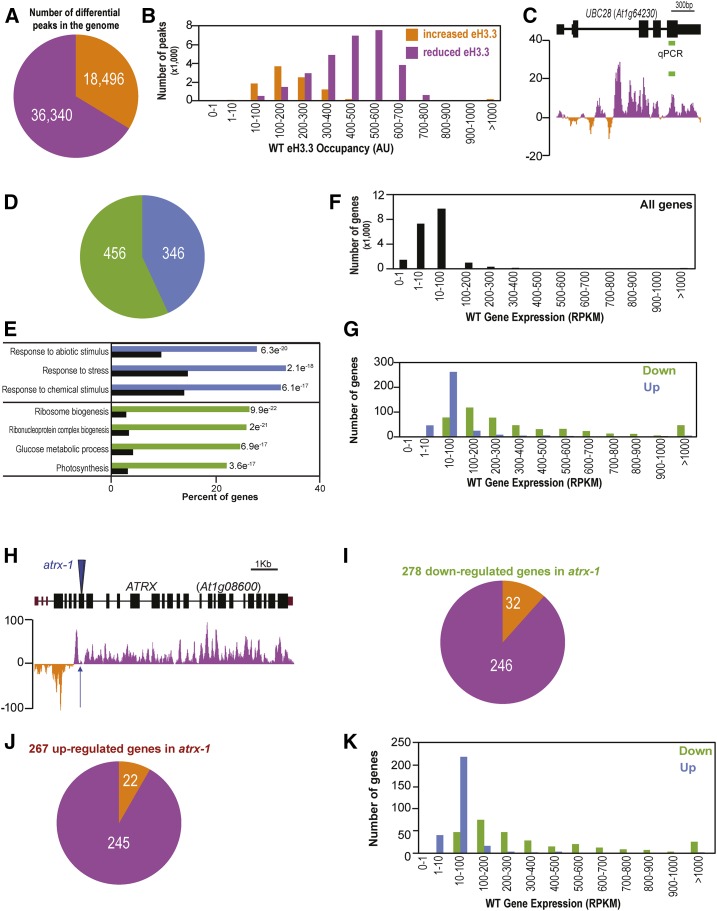
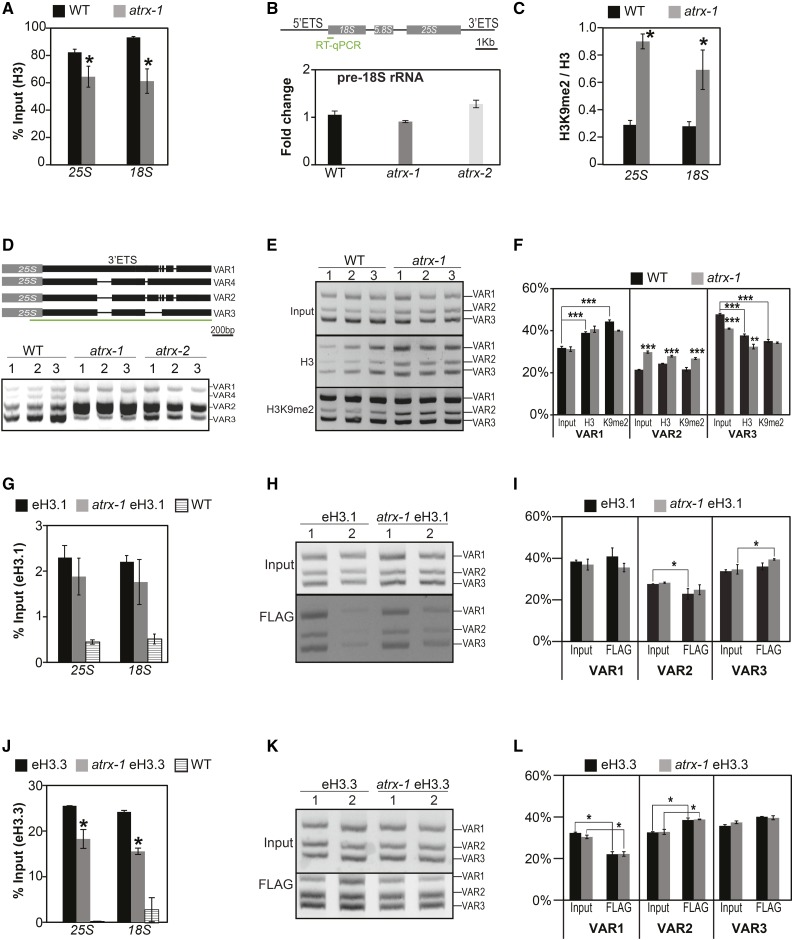
Histones are essential components of the nucleosome, the major chromatin subunit that structures linear DNA molecules and regulates access of other proteins to DNA. Specific histone chaperone complexes control the correct deposition of canonical histones and their variants to modulate nucleosome structure and stability. In this study, we characterize the Arabidopsis thaliana Alpha Thalassemia-mental Retardation X-linked (ATRX) ortholog and show that ATRX is involved in histone H3 deposition. Arabidopsis ATRX mutant alleles are viable, but show developmental defects and reduced fertility. Their combination with mutants of the histone H3.3 chaperone HIRA (Histone Regulator A) results in impaired plant survival, suggesting that HIRA and ATRX function in complementary histone deposition pathways. Indeed, ATRX loss of function alters cellular histone H3.3 pools and in consequence modulates the H3.1/H3.3 balance in the cell. H3.3 levels are affected especially at genes characterized by elevated H3.3 occupancy, including the 45S ribosomal DNA (45S rDNA) loci, where loss of ATRX results in altered expression of specific 45S rDNA sequence variants. At the genome-wide scale, our data indicate that ATRX modifies gene expression concomitantly to H3.3 deposition at a set of genes characterized both by elevated H3.3 occupancy and high expression. Together, our results show that ATRX is involved in H3.3 deposition and emphasize the role of histone chaperones in adjusting genome expression.


Figures

Figure 1.
Figure 1.
Characterization of the ATRX Ortholog in Arabidopsis. (A) Phylogenetic tree of ATRX proteins. Pt, Populus trichocarpa; Rc, Ricinus communis; Mt, Medicago truncatula; Gm, Glycine max; At, Arabidopsis thaliana; Br, Brassica rapa; Os, Oryza sativa; Mm, Mus musculus; Hs, Homo sapiens; Dm, Drosophila melanogaster; Ce, Caenorhabditis elegans. Bar = 0.2 substitutions/per site. The percentage of trees in which the associated taxa clustered together is shown next to the branches. (B) Functional domains of ATRX proteins. The ADD (ATRX-DNMT3-DNMT3L) domain is displayed as a green box, the DAXX-I (DAXX-interacting) domain as an orange box, the DEXDc (DEAD-like helicase superfamily) domain as a pink box, and the HELICc (HELICase superfamily C-terminal) domain as a blue box. (C) Merged maximum intensity projection of confocal fluorescence and bright-field images of N. benthamiana leaves transiently expressing ATRX-GFP fusion (green) proteins. Chlorophyll fluorescence appears in red. Bar = 20 μm. (D) Interaction of ATRX with histones H3.1 and H3.3 in a yeast two-hybrid assay. Photographs were taken after 3 d of yeast cell growth on leucine-tryptophan-/yeast nitrogen base medium (-LW) or on the selective leucine-tryptophan-histidine-yeast nitrogen base (-LWH) medium. The pGADT7 (prey) and pGBKT7 (bait) empty vectors were used as negative controls.
Figure 2.
Figure 2.
Characterization of the Arabidopsis atrx Mutant Alleles. (A) Gene structure of Arabidopsis ATRX. Exons, black rectangles; untranslated regions, purple rectangles; introns, lines; T-DNA insertion, triangle; LB, left border; RB, right border. (B) Analysis of ATRX transcripts produced in mutants with the atrx-1 or atrx-2 alleles by RT-PCR on three biological replicates consisting of independent pools of about twenty 2.5-week-old in vitro-grown whole plantlets sampled at the same time. The amplified regions are displayed by green lines in (A). MON1 (At2g28390) was used as a control. (C) Mean expression of ATRX in atrx mutants analyzed by qRT-PCR in the same samples than in (B). Transcript levels in the wild type were set to 1. The analyzed region is displayed in (A). (D) Representative 3-week-old wild-type and atrx mutant plantlets grown on soil. (E) Quantification of rosette surface area (in cm2) of atrx mutant plants. Mean rosette area is shown for at least six 2-week-old plants for each genotype. Student’s t test; **P < 0.01. (F) Root length quantification (in mm) of atrx mutant plants. Mean root length is calculated from at least four 5-d-old in vitro-grown plants for each genotype. A representative experiment out of three independent ones is displayed. Student’s t test; *P < 0.05. (G) Quantification of seed content in atrx mutant siliques compared with the wild type. Mean seed number was calculated from at least 30 siliques pooled from four plants per genotype grown at the same time. Student’s t test compared with the wild type; *P < 0.05 and ***P < 0.001. (H) Representative dissected siliques from atrx mutants. Red arrows indicate unfertilized ovules and the white arrow an aborted seed. (I) Representative anthers out of four independent 4-week-old plants grown at the same time, for which pollen viability was assessed by Alexander staining. Both atrx-1 and atrx-2 anthers show reduced pollen content, and atrx-2 anthers contain nonviable pollen (green color) indicated by black arrows. Error bars of all panels represent se of the mean.
Figure 3.
Figure 3.
Epistatic Relationship between ATRX and CAF-1 or HIR Histone Chaperone Complexes. (A) Representative 7-week-old F3 sister plants grown on soil. (B) Quantification of seed content in hira-1, hira-1 atrx-1/ATRX, atrx-1, and atrx-1 hira-1/HIRA mutant siliques. Mean seed number was calculated from at least 30 siliques pooled from four plants grown at the same time. A Student’s t test revealed no statistically significant difference between the genotypes. (C) and (D) Representative 3-week-old F3 plants derived from crosses of atrx-1 alleles with ubn2-2 (C) or cabin1-2 (D) grown on soil. (E) Quantification of total rosette surface area of the F3 sister plants described in (C) and (D). Mean rosette area was calculated from at least six 2-week-old plants for each genotype. Student’s t test in comparison to ubn2-2 ATRX for UBN2 atrx-1 and ubn2-2 atrx-1 mutants and in comparison to cabin1-2 ATRX for CABIN1 atrx-1 and cabin1-2 atrx-1 mutants; *P < 0.05. (F) Quantification of seed content in siliques of FAS2 ATRX, fas2-5 ATRX, fas2-5 atrx-1/ATRX, and fas2-5 atrx-1 F2 sister plants. Mean for seed number was calculated from at least 30 siliques pooled from four plants grown at the same time. Student’s t test in comparison to fas2-5 ATRX; ***P < 0.001. (G) Representative dissected siliques from fas2-5 ATRX and fas2-5 atrx-1 F2 sister plants. Red arrows indicate unfertilized ovules. Error bars of all panels represent se of the mean.
Figure 4.
Figure 4.
Effects of ATRX Loss on Histone Pools and Nucleosome Occupancy. (A) and (B) Left: Histone H3 protein levels quantified by immunoblot in non-nucleosomal fractions (A) and nuclear and total extracts (B). Twenty (A) or six (B) micrograms of proteins were loaded per lane. Right: Quantification of H3 band intensities normalized to Actin from two independent experiments, each comprising two biological replicates for each genotype, consisting of independent pools of 1 g of 2.5-week-old in vitro-grown plantlets collected at the same time, and several blots. Student’s t test compared with the wild type; **P < 0.01 and ***P < 0.001. (C) to (E) Histone H3 occupancy at three active genes (UBC28, UEV1C, and HXK1) (C), at three genes situated in subtelomeric regions (At1g01240, At3g63180, and At5g67640) (D), and at centromeric and pericentromeric repeats (TSI, 106B, 180bp, and ribosomal 5S rDNA loci) and at a transposon on a chromosome arm (At2g15810, Mule) (E) was assessed by H3-ChIP qPCR in three biological replicates consisting of pools of 1 g of 2.5-week-old in vitro-grown wild-type, atrx-1, and hira-1 mutant plants. Student’s t test compared with the wild type; *P < 0.05. Error bars of all panels represent se of the mean.
Figure 5.
Figure 5.
Effect of ATRX Loss on Incorporation and Balance of the Canonical Histone H3.1 and the H3.3 Variant. (A) Canonical eH3.1 and variant eH3.3 occupancy at heterochromatic repeats (180bp, TSI, and Ta3) and at three active genes (UBC28, UEV1C, and HXK1) assessed by ChIP-qPCR in one biological replicate sampled at the same time for each genotype and consisting of a pool of 0.5 g of 2.5-week-old in vitro-grown plants. The eH3.1 and eH3.3 occupancy is normalized to the occupancy at an intergenic region (IG; set to 1). (B) and (C) Left: Histone eH3.1 (B) and eH3.3 (C) protein levels quantified by immunoblot in nuclear fractions and total extracts prepared with Honda buffer (Honda et al., 1966). Six micrograms of proteins were loaded per lane. Right: Quantification of H4 and eH3.1 (B) or eH3.3 (C) band intensities relative to Actin in total extracts from two independent experiments comprising in total four biological replicates of pools of 1 g of 2.5-week-old in vitro-grown plants and several blots. Student’s t test compared with the wild type; *P < 0.05. (D) and (E) Histone eH3.1 (D) and eH3.3 (E) occupancy at heterochromatic repeats (TSI, 106B, and 180bp) and at the 5S ribosomal DNA loci assessed by ChIP-qPCR in three biological replicates sampled at the same time and consisting of pools of 1 g of 2.5-week-old in vitro-grown eH3.1, atrx-1 eH3.1, and wild-type plants. Student’s t test compared with the wild type; *P < 0.05. (F) Histone eH3.3 occupancy at three active genes (UBC28, UEV1C, and HXK1) and at three genes situated in subtelomeric regions (At1g01240, At3g63180, and At5g67640) assessed by ChIP-qPCR in the same plant material as in (E). Student’s t test compared with the wild type; *P < 0.05. Error bars of all panels represent se of the mean.
Figure 6.
Figure 6.
Effects of ATRX Loss on Gene Expression and Histone Variant H3.3 Occupancy. (A) Pie chart showing the number of peaks situated in the Arabidopsis genome with increased (orange) or reduced (violet) eH3.3 occupancy in atrx-1 relative to the wild type. Numbers of peaks are indicated in the pie chart. ChIP-seq was performed in two biological replicates for each genotype sampled at the same time consisting of pools of 2 g of 2.5-week-old in vitro-grown eH3.3 and atrx-1 eH3.3 plants. Peak occupancy was determined with DANPOS2. (B) Distribution of gene-localized peaks according to their increased (orange) or reduced (violet) eH3.3 occupancy in the wild-type ChIP-seq data set. Peak occupancy was determined with DANPOS2 (AU, arbitrary units). (C) Differential eH3.3 summit occupancy calculated at single nucleotide resolution in the ChIP-seq data sets in comparison to ChIP-qPCR data from Figure 5F. The active gene UBC28 is presented. Peaks with higher eH3.3 occupancy in atrx-1 compared with the wild type are shown in orange (negative values), while those with lower eH3.3 occupancy are in violet (positive values). The region amplified in ChIP-qPCR is displayed by a green line. Reduced eH3.3 occupancy was monitored by ChIP-qPCR at this locus (Figure 5F). (D) Pie chart showing the number of differentially expressed genes. Upregulated and downregulated genes in atrx-1 compared with the wild type are displayed in blue and green, respectively, and numbers of differentially expressed genes are indicated in the pie chart. RNA-seq was conducted on total RNAs extracted from three biological replicates sampled at the same time consisting of pools of around twenty 2.5-week-old in vitro-grown wild-type and atrx-1 plants. (E) Top GO terms for upregulated and downregulated genes in atrx-1 compared with the wild type. The P values are indicated. Terms for upregulated genes are in blue, while those for downregulated genes are in green. Background levels are shown in black. e, exponent (scientific format, in which “e” multiplies the preceding number by 10 to the -nth power). (F) and (G) Distribution of all genes (F) and of differentially expressed genes in atrx-1 ([G], in blue for upregulated genes and in green for downregulated genes) according to their expression levels in the wild type RNA-seq data set (RPKM). (H) Differential eH3.3 summit occupancy calculated at single nucleotide resolution at the ATRX locus from the ChIP-seq data set. Peaks with higher eH3.3 occupancy in atrx-1 compared with the wild type are shown in orange, while those with lower eH3.3 occupancy are in violet. Peak occupancy was determined with DANPOS2. The blue arrow indicates the T-DNA insertion location for the atrx-1 mutant. (I) Pie chart showing distribution of genes with differential summit eH3.3 occupancy determined with DANPOS2 in atrx-1 eH3.3 in the ChIP-seq data, for the 278 downregulated genes identified by DeSeq2 in atrx-1 in the RNA-seq data. The 246 genes with reduced eH3.3 occupancy in atrx-1 relative to the wild type are in violet. The 32 genes with increased eH3.3 occupancy in atrx-1 relative to the wild type are in orange. (J) Pie chart showing distribution of genes with differential summit eH3.3 occupancy determined with DANPOS2 in atrx-1 eH3.3 in the ChIP-seq data, for the 267 upregulated genes identified by DeSeq2 in atrx-1 in the RNA-seq data. The 245 genes with reduced eH3.3 occupancy in atrx-1 relative to the wild type are in violet. The 22 genes with increased eH3.3 occupancy in atrx-1 relative to the wild type are in orange. (K) Distribution of genes downregulated (green) and upregulated (blue) in atrx-1 according to their expression levels in the wild-type RNA-seq data set. Differential expression was determined with DeSeq2.
Figure 7.
Figure 7.
Effects of ATRX Loss on Nucleosome Occupancy and Balance between Histone Variants at 45S rDNA Loci. (A) Mean histone H3 occupancy at 25S and 18S rDNA loci assessed by H3-ChIP qPCR from three biological replicates consisting of independent pools of 1 g of 2.5-week-old in vitro-grown wild-type and atrx-1 mutant plants collected at the same time. Student’s t test; *P < 0.05. (B) Quantification of pre-rRNA transcripts by qRT-PCR. Top: 45 rDNA unit with the 18S, 5.8S, and 25S rRNA genes (gray boxes) with positions of the external transcribed spacers (5′ETS and 3′ETS). The region amplified in qRT-PCR is displayed by a green line. Bottom: Quantification of pre-rRNA transcripts by qRT-PCR on cDNA prepared from three biological replicates consisting of independent pools of about twenty 2.5-week-old in vitro-grown wild-type, atrx-1, and atrx-2 plantlets collected at the same time. Wild type was set to 1. (C) Mean ratio of histone H3K9me2/H3 occupancy at 25S and 18S rDNA loci assessed by ChIP-qPCR from three biological replicates consisting of independent pools of 1 g of 2.5-week-old in vitro-grown wild-type and atrx-1 mutant plants collected at the same time. Student’s t test; *P < 0.05. (D) Analysis of 45S rRNA variants. Top: Schema of 3′ETS rRNA gene variants. Black lines joining rectangles indicate deletions in sequences of each rRNA gene variant. The green line represents the amplified region presented in the bottom panel. Bottom: RT-PCR on cDNA, prepared from three biological replicates consisting of independent pools of about twenty 2.5-week-old in vitro-grown wild-type, atrx-1, and atrx-2 plants grown and collected at the same time. Detection of pre-rRNA transcripts was performed with primers enclosing the external transcribed 45S spacer and detecting all variants. The amplified region is displayed by a green line in the top panel. (E) Analysis of 45S variant abundance in the input, H3-ChIP, and H3K9me2-ChIP (K9me2) fractions presented in (A) and (C). (F) Quantification of relative band intensities presented in (E). Student’s t test; **P < 0.01 and ***P < 0.001. (G) and (J) Mean histone eH3.1 (G) and eH3.3 (J) occupancy at 25S and 18S rDNA loci from three biological replicates consisting of independent pools of about 1 g of 2.5-week-old in vitro-grown eH3, atrx-1 eH3, and wild-type plants assessed by ChIP-qPCR. (H) and (K) Analysis of the relative 45S variant abundance in the input and Flag-ChIP samples in (G) and (J). (I) and (L) Quantification of relative band intensities presented in (H) and (K). Student’s t test; *P < 0.05. Error bars of all panels represent se of the mean.

Similar articles

Cited by

References

    1. Abou-Ellail M., Cooke R., Sáez-Vásquez J. (2011). Variations in a team: major and minor variants of Arabidopsis thaliana rDNA genes. Nucleus 2: 294–299. - PubMed
    1. Alekseyenko A.A., Gorchakov A.A., Zee B.M., Fuchs S.M., Kharchenko P.V., Kuroda M.I. (2014). Heterochromatin-associated interactions of Drosophila HP1a with dADD1, HIPP1, and repetitive RNAs. Genes Dev. 28: 1445–1460. - PMC - PubMed
    1. Alexander M.P. (1969). Differential staining of aborted and nonaborted pollen. Stain Technol. 44: 117–122. - PubMed
    1. Alexeev A., Mazin A., Kowalczykowski S.C. (2003). Rad54 protein possesses chromatin-remodeling activity stimulated by the Rad51-ssDNA nucleoprotein filament. Nat. Struct. Biol. 10: 182–186. - PubMed
    1. Banks D.D., Gloss L.M. (2004). Folding mechanism of the (H3-H4)2 histone tetramer of the core nucleosome. Protein Sci. 13: 1304–1316. - PMC - PubMed

MeSH terms