Review
. 2017 Jul 7;121(2):181-195.
doi: 10.1161/CIRCRESAHA.117.310230.

Calcium and Excitation-Contraction Coupling in the Heart

Affiliations
Review

Calcium and Excitation-Contraction Coupling in the Heart

David A Eisner et al. Circ Res. .

Abstract

Cardiac contractility is regulated by changes in intracellular Ca concentration ([Ca2+]i). Normal function requires that [Ca2+]i be sufficiently high in systole and low in diastole. Much of the Ca needed for contraction comes from the sarcoplasmic reticulum and is released by the process of calcium-induced calcium release. The factors that regulate and fine-tune the initiation and termination of release are reviewed. The precise control of intracellular Ca cycling depends on the relationships between the various channels and pumps that are involved. We consider 2 aspects: (1) structural coupling: the transporters are organized within the dyad, linking the transverse tubule and sarcoplasmic reticulum and ensuring close proximity of Ca entry to sites of release. (2) Functional coupling: where the fluxes across all membranes must be balanced such that, in the steady state, Ca influx equals Ca efflux on every beat. The remainder of the review considers specific aspects of Ca signaling, including the role of Ca buffers, mitochondria, Ca leak, and regulation of diastolic [Ca2+]i.

Keywords: calcium; cytoplasm; mitochondria; ryanodine receptor calcium release channel; sarcoplasmic reticulum.


Figures

Figure 1.
Figure 1.
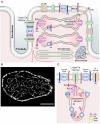
Structures involved in Ca cycling. A, Schematic diagram. This shows surface membrane, transverse tubule, sarcoplasmic reticulum (SR), and mitochondria, as well as the various channels and transporters mentioned in the text. B, High-resolution transverse section of a ventricular myocyte showing t-tubule network. Reprinted from Jayasinghe et al with permission of the publisher. Copyright ©2009, Biophysical Society. C, Cartoon of dyad emphasizing the major proteins involved in Ca cycling. B-AR indicates beta adrenoceptor; MCU, mitochondrial Ca uniporter; NCX, sodium–calcium exchange; NCLX, mitochondrial Na–Ca exchange; PMCA, plasma membrane Ca-ATPase; RyR, ryanodine receptor; and SERCA, sarco/endoplasmic reticulum Ca-ATPase.
Figure 2.
Figure 2.
Mechanisms producing calcium flux balance and controlling sarcoplasmic reticulum (SR) Ca content. A, Flow diagram. This illustrates recovery from a situation where influx is greater than efflux. Boxes show (from top to bottom): increase of cell Ca content leading to an increase of SR Ca; increase of the amplitude of the Ca transient (red). The bottom box shows membrane current records in response to a depolarization. The red traces show that increase in size of the Ca transient leads to faster inactivation of the L-type Ca current during the pulse and a larger sodium–calcium exchange current on repolarization (arrowed). B, Illustrative traces. These show (from top to bottom) [Ca2+]i; sarcolemmal fluxes; calculated cell (and SR) Ca gain. At the start of the record, 10 mmol/L caffeine was applied to empty the SR. After removing caffeine, stimulation was commenced. Note that the recovery of the amplitude of the Ca transient is accompanied by a decrease of Ca influx and increase of efflux. Reprinted from Trafford et al with permission of the publisher. Copyright ©2001, American Heart Association, Inc.
Figure 3.
Figure 3.
Effects of potentiating ryanodine receptor (RyR) opening. A, Records show measurements of (top) cytoplasmic and (bottom) sarcoplasmic reticulum (SR) [Ca2+]. Caffeine (0.5 mmol/L) was added for the period shown. Reprinted from Greensmith et al with permission. Copyright ©2014, The Authors. Published by Oxford University Press on behalf of the European Society of Cardiology. B, Flow diagram of events underlying changes in A. (i) The increase of RyR opening increases the amplitude of the Ca transient (ii) leading to increased Ca efflux (iii) and a decrease of SR Ca content (iv) which returns the amplitude of the Ca transient to control levels (v). Reprinted from Eisner with permission. Copyright ©2014, The Author. Published by the Physiological Society.
Figure 4.
Figure 4.
Effects of stimulation rate on diastolic and systolic [Ca2+]i. A, Original traces showing the effects of stimulation at the rates indicated. B, Diagrammatic representation of systolic efflux. At 1 Hz (left) efflux will be activated by the systolic rise of [Ca2+]i (dotted area). At 4 Hz (right), systolic efflux has decreased (dotted) whereas diastolic has increased (diagonal lines). Reprinted from Dibb et al with permission. Copyright ©2007, The Authors. Published by the Physiological Society.

References

    1. Allen DG, Blinks JR. Calcium transients in aequorin-injected frog cardiac muscle. Nature. 1978;273:509–513. - PubMed
    1. Allen DG, Kurihara S. Calcium transients in mammalian ventricular muscle. Eur Heart J. 1980;Suppl A:5–15. - PubMed
    1. Bers DM. Excitation-Contraction Coupling and Cardiac Contractile Force. 2 ed. Dordrecht/Boston/London: Kluwer Academic Publishers; 2001.
    1. Bers DM, Kranias EG. Normal and abnormal calcium homeostasis. In: Walsh RA, editor. In: Molecular Mechanisms of Cardiac Hypertrophy and Failure. Oxon: Taylor & Francis; 2005. pp. 199–220.
    1. Robinson P, Griffiths PJ, Watkins H, Redwood CS. Dilated and hypertrophic cardiomyopathy mutations in troponin and alpha-tropomyosin have opposing effects on the calcium affinity of cardiac thin filaments. Circ Res. 2007;101:1266–1273. doi: 10.1161/CIRCRESAHA.107.156380. - PubMed

MeSH terms