

Spatiotemporal neural characterization of prediction error valence and surprise during reward learning in humans
- PMID: 28684734
- PMCID: PMC5500565
- DOI: 10.1038/s41598-017-04507-w
Spatiotemporal neural characterization of prediction error valence and surprise during reward learning in humans
Abstract
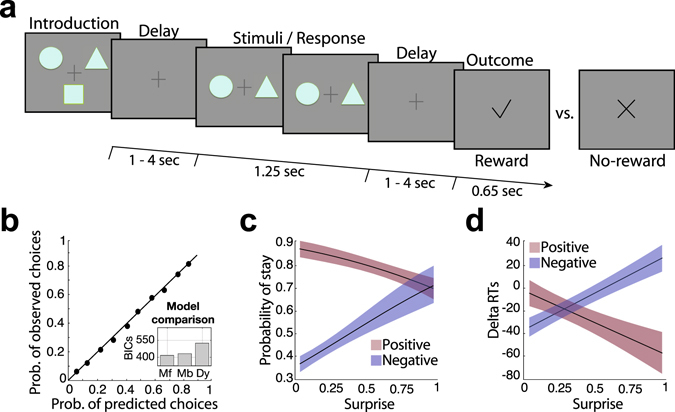
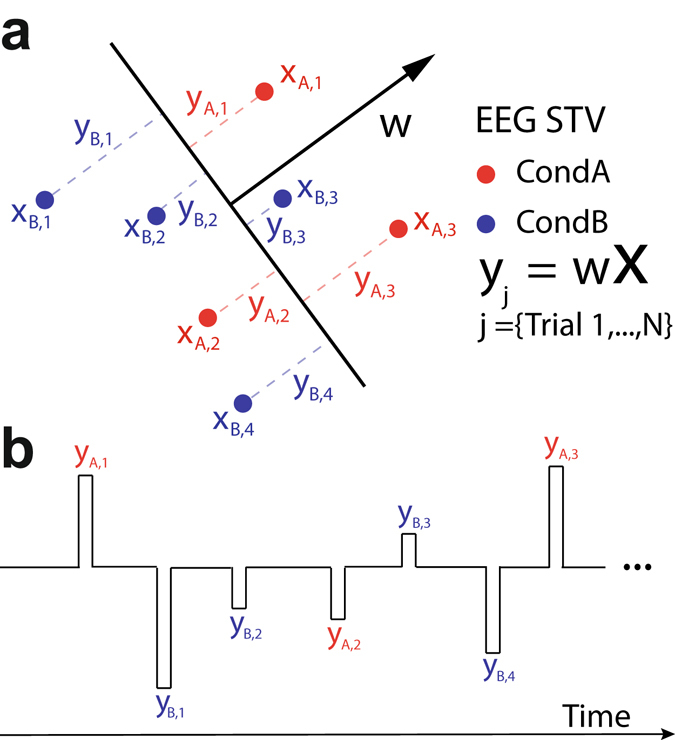
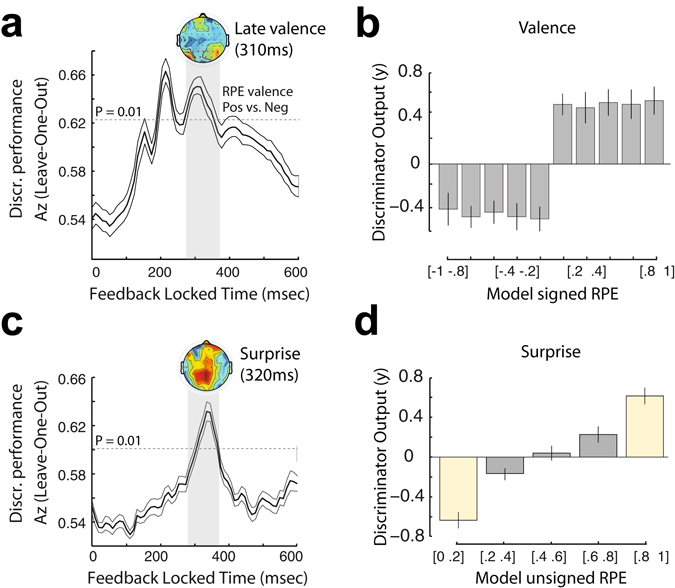
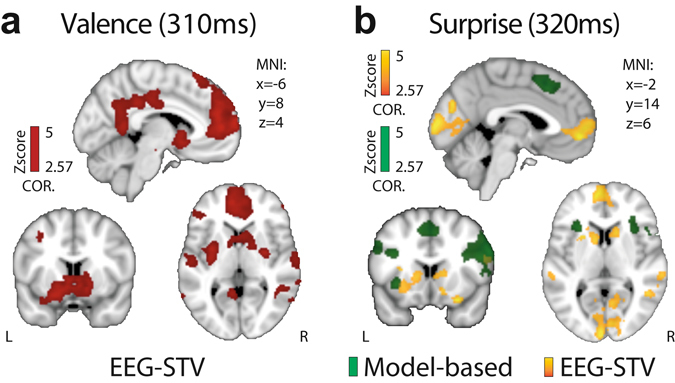
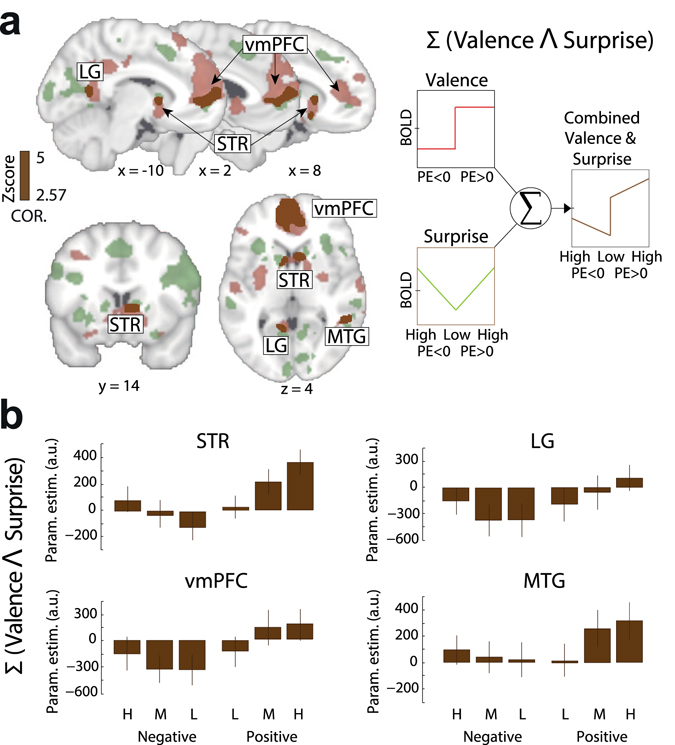
Reward learning depends on accurate reward associations with potential choices. These associations can be attained with reinforcement learning mechanisms using a reward prediction error (RPE) signal (the difference between actual and expected rewards) for updating future reward expectations. Despite an extensive body of literature on the influence of RPE on learning, little has been done to investigate the potentially separate contributions of RPE valence (positive or negative) and surprise (absolute degree of deviation from expectations). Here, we coupled single-trial electroencephalography with simultaneously acquired fMRI, during a probabilistic reversal-learning task, to offer evidence of temporally overlapping but largely distinct spatial representations of RPE valence and surprise. Electrophysiological variability in RPE valence correlated with activity in regions of the human reward network promoting approach or avoidance learning. Electrophysiological variability in RPE surprise correlated primarily with activity in regions of the human attentional network controlling the speed of learning. Crucially, despite the largely separate spatial extend of these representations our EEG-informed fMRI approach uniquely revealed a linear superposition of the two RPE components in a smaller network encompassing visuo-mnemonic and reward areas. Activity in this network was further predictive of stimulus value updating indicating a comparable contribution of both signals to reward learning.
Conflict of interest statement
The authors declare that they have no competing interests.
Figures
Similar articles
-
Separate neural representations of prediction error valence and surprise: Evidence from an fMRI meta-analysis.Hum Brain Mapp. 2018 Jul;39(7):2887-2906. doi: 10.1002/hbm.24047. Epub 2018 Mar 25. Hum Brain Mapp. 2018. PMID: 29575249 Free PMC article.
-
The feedback-related negativity (FRN) revisited: new insights into the localization, meaning and network organization.Neuroimage. 2014 Jan 1;84:159-68. doi: 10.1016/j.neuroimage.2013.08.028. Epub 2013 Aug 23. Neuroimage. 2014. PMID: 23973408
-
Perceptual Salience and Reward Both Influence Feedback-Related Neural Activity Arising from Choice.J Neurosci. 2015 Sep 23;35(38):13064-75. doi: 10.1523/JNEUROSCI.1601-15.2015. J Neurosci. 2015. PMID: 26400937 Free PMC article.
-
The Neural Substrate of Reward Anticipation in Health: A Meta-Analysis of fMRI Findings in the Monetary Incentive Delay Task.Neuropsychol Rev. 2018 Dec;28(4):496-506. doi: 10.1007/s11065-018-9385-5. Epub 2018 Sep 25. Neuropsychol Rev. 2018. PMID: 30255220 Free PMC article.
-
Reward representations and reward-related learning in the human brain: insights from neuroimaging.Curr Opin Neurobiol. 2004 Dec;14(6):769-76. doi: 10.1016/j.conb.2004.10.016. Curr Opin Neurobiol. 2004. PMID: 15582382 Review.
Cited by
-
Dorsal Anterior Cingulate Cortices Differentially Lateralize Prediction Errors and Outcome Valence in a Decision-Making Task.Front Hum Neurosci. 2018 May 22;12:203. doi: 10.3389/fnhum.2018.00203. eCollection 2018. Front Hum Neurosci. 2018. PMID: 29872384 Free PMC article.
-
Influence of vmPFC on dmPFC Predicts Valence-Guided Belief Formation.J Neurosci. 2018 Sep 12;38(37):7996-8010. doi: 10.1523/JNEUROSCI.0266-18.2018. Epub 2018 Aug 13. J Neurosci. 2018. PMID: 30104337 Free PMC article.
-
The Anterior Insula Processes a Time-Resolved Subjective Risk Prediction Error.J Neurosci. 2025 Jun 4;45(23):e2302242025. doi: 10.1523/JNEUROSCI.2302-24.2025. J Neurosci. 2025. PMID: 40268482 Free PMC article.
-
Global reward state affects learning and activity in raphe nucleus and anterior insula in monkeys.Nat Commun. 2020 Jul 28;11(1):3771. doi: 10.1038/s41467-020-17343-w. Nat Commun. 2020. PMID: 32724052 Free PMC article.
-
How the Level of Reward Awareness Changes the Computational and Electrophysiological Signatures of Reinforcement Learning.J Neurosci. 2018 Nov 28;38(48):10338-10348. doi: 10.1523/JNEUROSCI.0457-18.2018. Epub 2018 Oct 16. J Neurosci. 2018. PMID: 30327418 Free PMC article.
References
-
- Sutton, R. Reinforcement Learning: An Introduction. (MIT Press, 1998).
Publication types
MeSH terms
Grants and funding
LinkOut - more resources
Full Text Sources
Other Literature Sources
