. 2017 Jul 6;7(1):4748.
doi: 10.1038/s41598-017-05044-2.

Characterization of transcriptional modules related to fibrosing-NAFLD progression

Affiliations

Characterization of transcriptional modules related to fibrosing-NAFLD progression

Yi Lou et al. Sci Rep. .

Abstract

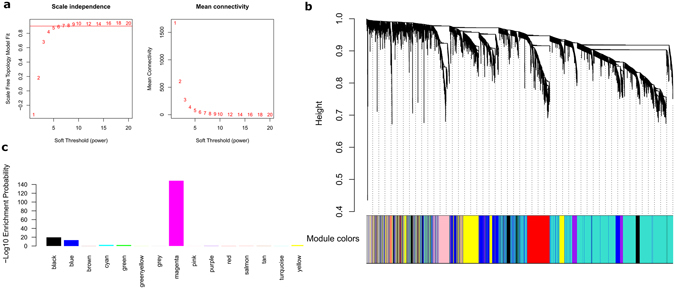
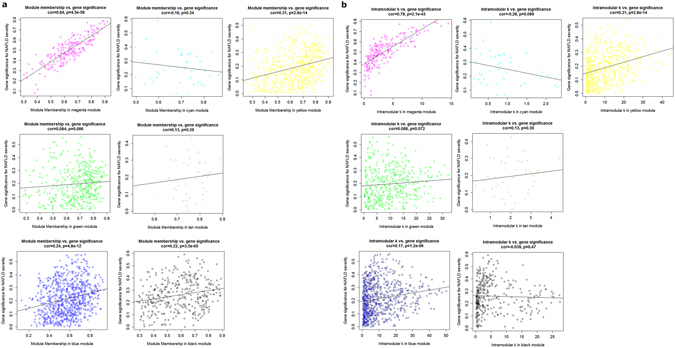
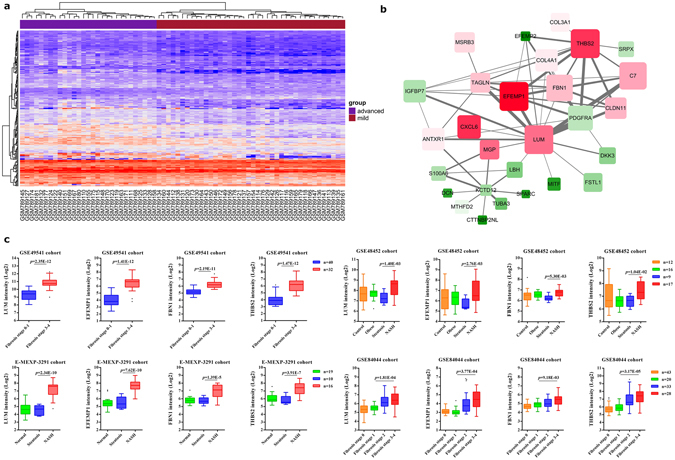
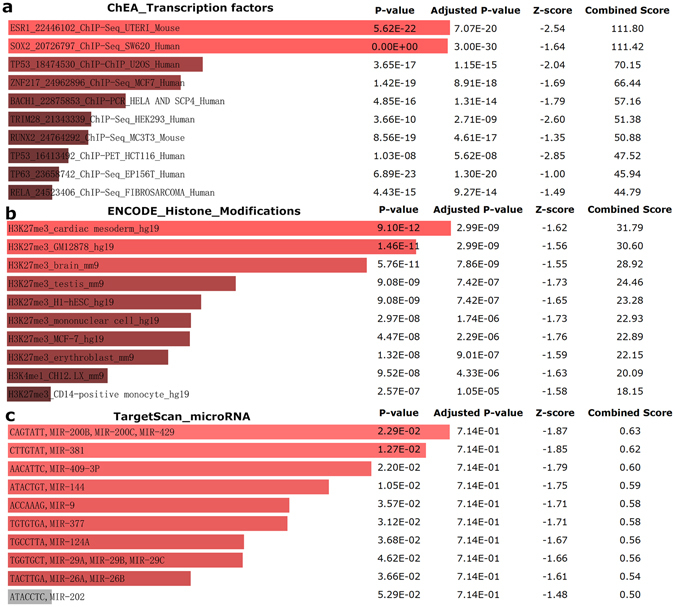
Based on the severity of liver fibrosis, low or high-risk profile of developing end-stage liver disease was present in nonalcoholic fatty liver disease (NAFLD). However, the mechanisms inducing transition from mild to advanced NAFLD are still elusive. We performed a system-level study on fibrosing-NAFLD by weighted gene co-expression network analysis (WGCNA) to identify significant modules in the network, and followed by functional and pathway enrichment analyses. Moreover, hub genes in the module were analyzed by network feature selection. As a result, fourteen distinct gene modules were identified, and seven modules showed significant associations with the status of NAFLD. Module preservation analysis confirmed that these modules can also be found in diverse independent datasets. After network feature analysis, the magenta module demonstrated a remarkably correlation with NAFLD fibrosis. The top hub genes with high connectivity or gene significance in the module were ultimately determined, including LUM, THBS2, FBN1 and EFEMP1. These genes were further verified in clinical samples. Finally, the potential regulators of magenta module were characterized. These findings highlighted a module and affiliated genes as playing important roles in the regulation of fibrosis in NAFLD, which may point to potential targets for therapeutic interventions.


Conflict of interest statement

The authors declare that they have no competing interests.

Figures

Figure 1
Figure 1
WGCNA network and module detection. (a) Selection of the soft-thresholding powers. The left panel shows the scale-free fit index versus soft-thresholding power. The right panel displays the mean connectivity versus soft-thresholding power. Power 5 was choosed, for which the fit index curve flattens out upon reaching a high value (>0.9). (b) Cluster dendrogram and module assignment for modules from WGCNA. Genes were clustered based on a dissimilarity measure (1-TOM). The branches correspond to modules of highly interconnected groups of genes. Colours in the horizontal bar represent the modules. 7012 transcripts were assigned to one of 15 modules including module grey. (c) Enrichment of DEGs in each module.
Figure 2
Figure 2
Module-trait and module-module associations of the network. (a) Each row corresponds to a module eigengene, column to a trait. Each cell contained the corresponding correlation and p value. The table was color-coded by correlation according to the color legend. The grey module included all the genes that can’t be clustered. (b) Module significance of each module, which is determined as the average absolute gene significance measure for all genes in a given module. (c,d) Eigengene network, including the clustering tree and heatmap, represents the relationships among the modules and the NAFLD trait. Meta-modules are defined as tight clusters of modules. The dendrogram indicates that magenta module and fibrosing-NAFLD trait are highly related. Conversely, blue and black modules are highly related, this meta-module is inversely correlated with fibrosis.
Figure 3
Figure 3
Preservation of GSE49541 network modules in different datasets. Each module is represented by its color-code and name. Left figure shows the composite statistic Preservation median rank. This measure tends to be independent from module size with high median ranks indicating low preservation. Right figure shows preservation Zsummary statistic. The dashed blue and green lines indicate the thresholds Z = 2 and Z = 10, respectively. Zsummary < 2 implies no evidence for module preservation, 2 < Zsummary < 10 implies weak to moderate evidence, and Zsummary > 10 implies strong evidence for module preservation. Fibrosing-NAFLD modules (tan, green, yellow, cyan, magenta) show high preservation statistics summary than expected by random chance using bootsrapping validation procedures.
Figure 4
Figure 4
Module features of GS, MM and K.in. (a) Modules significantly correlated with NAFLD status (mild versus advanced fibrosis). Each point represents an individual gene within each module, which are plotted by GS on the y-axis and MM on the x-axis. The regression line, correlation value and p-value are shown for each plot. (b) Correlation of the K.in (x-axis) and the GS (y-axis).
Figure 5
Figure 5
Characterization of the magenta module. (a) Gene expression heat-map of module magenta. (b) Interaction of gene co-expression patterns in the magenta module. The module was visualized using Cytoscape 3.0 software. The node colors coded from green to red (low to high) indicate the fold change when compared mild with advanced NAFLD state. The node size is proportional to the significance of the expression changes compared to mild NAFLD. (c) Four hub genes expression pattern in liver tissues according to GSE49541, E-MEXP-3291, GSE48452 and GSE84044 cohort. Data were shown as box and whisker plot. Limma package was used for statistical analysis.
Figure 6
Figure 6
Expression of hub genes in different fibrosis stages of NAFLD. (a,b) The representative HE staining of NAFLD patients with different fibrosis stages were shown. Quantification of hub genes was presented. (c,d) Liver sections were stained with HE in mice fed with HFHC diet at 20 weeks. Masson’s trichrome staining was used to detect the accumulated collagen. The hepatic production of hub genes was confirmed and presented. **P < 0.01.
Figure 7
Figure 7
Potential factors regulating genes in magenta module. (a) Transcription factors. (b) Histone modification markers. (c) Enriched seed and its associated microRNA.

References

    1. Unalp-Arida A, Ruhl CE. Noninvasive fatty liver markers predict liver disease mortality in the U.S. population. Hepatology. 2016;63:1170–1183. doi: 10.1002/hep.28390. - DOI - PMC - PubMed
    1. Hubscher SG. Histological assessment of non-alcoholic fatty liver disease. Histopathology. 2006;49:450–465. doi: 10.1111/j.1365-2559.2006.02416.x. - DOI - PubMed
    1. Hashimoto E, Tokushige K, Ludwig J. Diagnosis and classification of non-alcoholic fatty liver disease and non-alcoholic steatohepatitis: Current concepts and remaining challenges. Hepatology research: the official journal of the Japan Society of Hepatology. 2015;45:20–28. doi: 10.1111/hepr.12333. - DOI - PubMed
    1. Pagadala MR, McCullough AJ. The relevance of liver histology to predicting clinically meaningful outcomes in nonalcoholic steatohepatitis. Clinics in liver disease. 2012;16:487–504. doi: 10.1016/j.cld.2012.05.006. - DOI - PMC - PubMed
    1. Younossi ZM, et al. Pathologic criteria for nonalcoholic steatohepatitis: interprotocol agreement and ability to predict liver-related mortality. Hepatology. 2011;53:1874–1882. doi: 10.1002/hep.24268. - DOI - PubMed

Publication types

MeSH terms