. 2017 Jul 6;7(1):4791.
doi: 10.1038/s41598-017-04242-2.

The role of city size and urban form in the surface urban heat island

Affiliations

The role of city size and urban form in the surface urban heat island

Bin Zhou et al. Sci Rep. .

Abstract

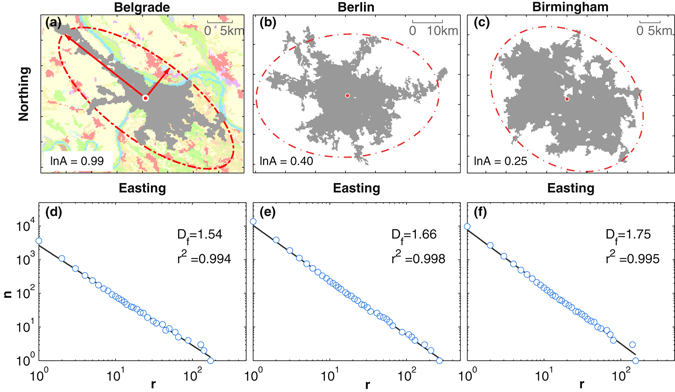
Urban climate is determined by a variety of factors, whose knowledge can help to attenuate heat stress in the context of ongoing urbanization and climate change. We study the influence of city size and urban form on the Urban Heat Island (UHI) phenomenon in Europe and find a complex interplay between UHI intensity and city size, fractality, and anisometry. Due to correlations among these urban factors, interactions in the multi-linear regression need to be taken into account. We find that among the largest 5,000 cities, the UHI intensity increases with the logarithm of the city size and with the fractal dimension, but decreases with the logarithm of the anisometry. Typically, the size has the strongest influence, followed by the compactness, and the smallest is the influence of the degree to which the cities stretch. Accordingly, from the point of view of UHI alleviation, small, disperse, and stretched cities are preferable. However, such recommendations need to be balanced against e.g. positive agglomeration effects of large cities. Therefore, trade-offs must be made regarding local and global aims.


Conflict of interest statement

The authors declare that they have no competing interests.

Figures

Figure 1
Figure 1
Example of city clusters and box-counting results leading to the fractal dimension (D f), as well as the logarithm of anisometry (ln A). The upper row, panels (ac), shows the city clusters as obtained applying CCA to the CORINE land cover data, for the cities of Belgrade (227.56 km2), Berlin (854.69 km2), and Birmingham (606.38 km2). The red ellipse is the equivalent ellipse of the urban cluster, determined by following. The lower row, panels (df), depicts the number of boxes necessary to cover the clusters as a function of the box size in double-logarithmic scale for the corresponding cities. The fractal dimension is obtained from the slope of linear regressions (straight lines). As can be seen from these examples, clusters vary in size, fractal dimension, and anisometry. Esri ArcMap 10.4 (www.esri.com/software/arcgis) and MATLAB R2015b (www.mathworks.com/products/matlab) were used to create the maps.
Figure 2
Figure 2
UHI intensity (ΔT) as a function of (a) logarithm of urban cluster size ln S C, (b) fractal dimension D f, and (c) logarithm of anisometry ln A, and quantile regressions (QR) as well as ordinary least square regression (OLS). The grey pixels indicate the number of cities that are covered by them (the darker, the higher the density). For visual purpose, the symbols represent averages in equal-width bins and their error-bars represent the standard deviations. The straight lines are linear regressions to raw data, whereas the dashed lines represent the results of quantile regressions. For the quantiles 0.1 and 0.9 we obtained the following slopes: (a) [0.24,0.80], (b) [2.05, 5.50], (c) [−0.58, −0.91].
Figure 3
Figure 3
Visualization of Equation (3) as obtained from multi-linear regression for ΔT(lnSC,Df,lnA). The panels display the slope (colors) and the intercept (countour lines) of the linear relation between ΔT and one urban factor given the other two urban factors are kept constant. For fixed values of ln S C and ln A, Equation (3) simplifies to (a) ΔT=slopeDf+intercept. Rastering through the relevant ranges of lnSC and ln A we show for each combination the corresponding slope and intercept. Analogously, panels (b) and (c) represent ΔT=slopelnSC+intercept and ΔT=slopelnA+intercept, respectively. Combinations which do not occur in the data are kept white. Please note that the range of values covered by the color bar differs among the panels; the figure illustrates the regression, Equation (3) – not the actual data.
Figure 4
Figure 4
Robustness of multi-linear regression under spatial and random sampling. In panel (a) we divide the study area into 9 partitions (blue rectangles) of similar size and separately apply linear regression according to Equation (4) to the normalized quantities. The pie-charts depict the resulting coefficients (for negative values the absolute value has been taken). The area of the pie-charts is proportional to the number of cities in the partition. Only statistically significant coefficients (at 95% level) are labeled. City size dominates in most cases, followed by fractal dimension, whereas in the south the anisometry becomes important. In panels (b) and (c) the results of stepwise regression on randomly sampled cities (500 repetitions) without and with replacement, respectively, are displayed. In both cases, as the sample size increases, Model A i.e. Equation (4) becomes the most probable model. Model B and C give better estimates under small sample size, and have the forms ΔTlnSC+Df+lnA+DflnSC [i.e. f, g, h0 in Equation (6)] and ΔTlnSC+Df+lnA+lnSClnA [i.e. e, f, h0 in Equation (6)], respectively. MATLAB R2015b was used to create the map (www.mathworks.com/products/matlab).

References

    1. Lettenmaier D, Mishra V, Ganguly A, Nijssen B. Observed Climate Extremes in Global Urban Areas. Environ. Res. Lett. 2014;16:14787.
    1. Coumou D, Rahmstorf S. A decade of weather extremes. Nat. Clim. Chang. 2012;2:1–6. doi: 10.1038/nclimate1612. - DOI
    1. Meehl Ga, Tebaldi C. More intense, more frequent, and longer lasting heat waves in the 21st century. Science. 2004;305:994–7. doi: 10.1126/science.1098704. - DOI - PubMed
    1. Li D, Bou-Zeid E. Synergistic interactions between urban heat islands and heat waves: The impact in cities is larger than the sum of its parts. J. Appl. Meteorol. Climatol. 2013;52:2051–2064. doi: 10.1175/JAMC-D-13-02.1. - DOI
    1. Oke, T. R. Boundary Layer Climates 2nd edn, (Methuen, London, 1987).

Publication types

LinkOut - more resources