. 2017 Sep;134(3):441-458.
doi: 10.1007/s00401-017-1747-1. Epub 2017 Jul 6.

Microglia contribute to normal myelinogenesis and to oligodendrocyte progenitor maintenance during adulthood

Affiliations

Microglia contribute to normal myelinogenesis and to oligodendrocyte progenitor maintenance during adulthood

Nora Hagemeyer et al. Acta Neuropathol. 2017 Sep.

Abstract

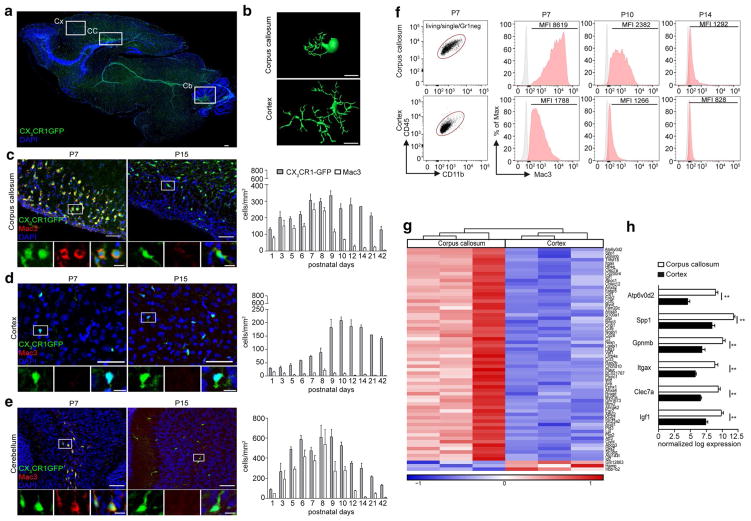
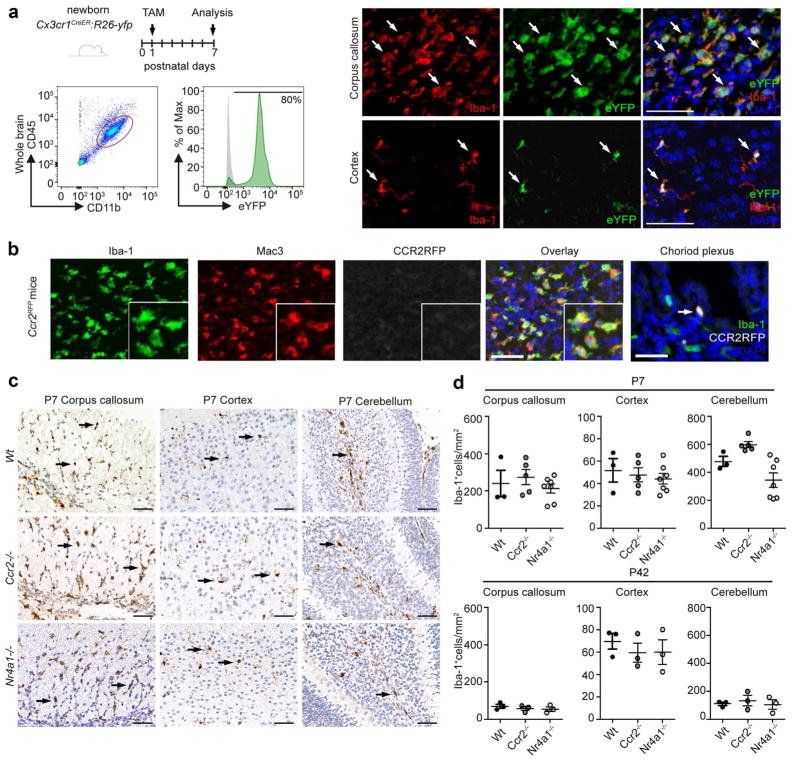
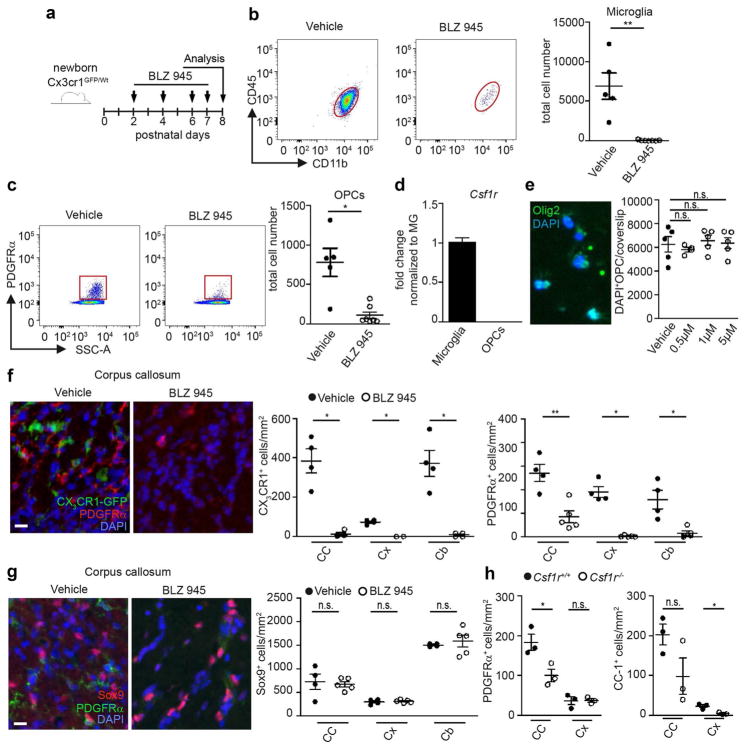
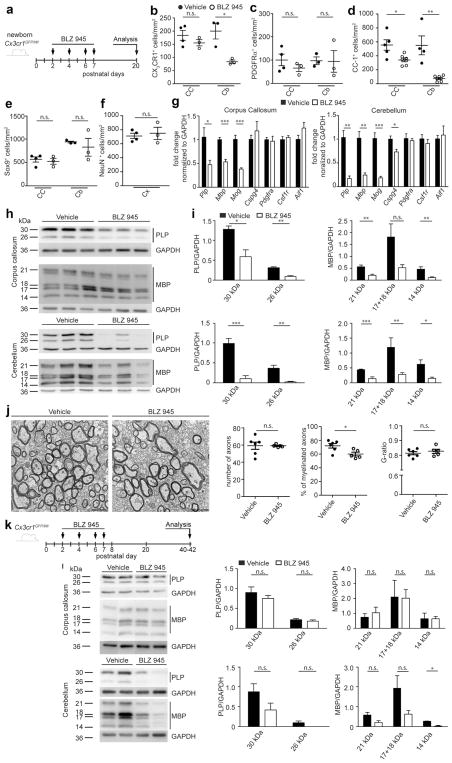
Whereas microglia involvement in virtually all brain diseases is well accepted their role in the control of homeostasis in the central nervous system (CNS) is mainly thought to be the maintenance of neuronal function through the formation, refinement, and monitoring of synapses in both the developing and adult brain. Although the prenatal origin as well as the neuron-centered function of cortical microglia has recently been elucidated, much less is known about a distinct amoeboid microglia population formerly described as the "fountain of microglia" that appears only postnatally in myelinated regions such as corpus callosum and cerebellum. Using large-scale transcriptional profiling, fate mapping, and genetic targeting approaches, we identified a unique molecular signature of this microglia subset that arose from a CNS endogenous microglia pool independent from circulating myeloid cells. Microglia depletion experiments revealed an essential role of postnatal microglia for the proper development and homeostasis of oligodendrocytes and their progenitors. Our data provide new cellular and molecular insights into the myelin-supporting function of microglia in the normal CNS.

Keywords: Amoeboid microglia; Development; Myelinogenesis; Oligodendrocyte progenitors; Oligodendrocytes.


Conflict of interest statement

Compliance with ethical standards

Conflict of interest

The authors declare that they have no conflict of interest.

Figures

Fig. 1
Fig. 1
Amoeboid microglia population with distinct expression profile transiently accumulates in white matter regions shortly after birth. a Representative sagittal section of a postnatal (P) P7 Cx3cr1GFP/Wt mouse brain depicting amoeboid parenchymal CX3CR1+ microglia (green) specifically in white matter regions. 4′,6-diamidino-2-phenylindole (DAPI) in blue. White squares indicate the regions analyzed in be (Cx cortex, CC corpus callosum, Cb cerebellum). Scale bar 50 μm. b Imaris-based three-dimensional reconstruction of a typical (CX3CR1+Iba-1+) amoeboid microglia in the corpus callosum and ramified microglia in the cortex at P7. Scale bar 10 μm. c, d Left representative immunofluorescence images of the corpus callosum (c), cortex (d), and cerebellum (e) at P7 and P15. CX3CR1 (green), Mac3 (red), and DAPI (blue). Scale bar 50 μm. Inset: scale bar 10 μm. Right kinetics of CX3CR1+ microglia (grey bars) and the activation marker Mac3+ (white bars) at the indicated time points. Bars indicate the mean ± SEM. At least three mice per time point were analyzed. f Flow cytometric analysis of microglia from P7, P10, and P14 old Cx3cr1GFP/Wt mice. CD45+CD11b+ microglia were pre-gated on living cells, single cells, Gr1 cells. The mean fluorescent intensity (MFI) of the Mac3 expression is depicted (n = 3). g Hierarchical clustering created on the most significantly differentially expressed (DE) genes (cut off adjusted to P < 0.01) between microglia from the corpus callosum and cortex at postnatal day 7. Data are sorted by most significant changes from top to bottom. Heat map displays row z-score values from red to blue via white. h Display of genes identified in g known to be related to priming and phagocytic function of microglia. Data presented as normalized log expression. Bars indicate the mean ± SEM. Significant differences were determined by an unpaired t test: *P < 0.05, **P < 0.01
Fig. 2
Fig. 2
Amoeboid microglia clusters are derived from local microglia precursors and develop normally in the absence of blood monocytes. a Scheme of experimental setup. Cx3cr1CreER:R26-yfp mice were injected intraperitoneally (i.p.) with tamoxifen at P1. Analysis was performed at P7. Representative blot of flow cytometric analysis of whole brain microglia (CD45lo, CD11b+) and subsequent immunofluorescent analysis of brain slices, Iba-1 (red), CX3CR1 (eYFP), and DAPI (blue). Arrows show triple positive cells. Scale bar 50 μm. b Representative immunofluorescent images of the developing corpus callosum of P7 Ccr2RFP mice. The P7 choroid plexus was used as a CCR2-RFP positive control. Iba-1 (green), Mac3 (red), CCR2-RFP (white), and DAPI (blue). Arrow shows a triple positive cell next to an Iba-1+ macrophage (asterisk). Scale bar 50 μm. c Representative images of Iba-1 immunohistochemistry in brain slices of P7 Wildtype (Wt), Ccr2−/−, and Nr4a1−/− mice. Scale bar 50 μm. d Quantification of Iba-1+ microglia in the corpus callosum, cortex, and cerebellum of P7 (upper lane) and P42 (lower lane) Wildtype (Wt), Ccr2−/−, and Nr4a1−/− mice (n = 3–7). Each symbol represents one mouse. Means with SEM are represented. Samples were collected from two independent experiments
Fig. 3
Fig. 3
Essential role of microglia for adequate induction of oligodendrocyte progenitors. a Scheme of experimental setup. Cx3cr1GFP/Wt mice were injected intraperitoneally (i.p.) with BLZ945 at P2, P4, P6, and P7. Analysis was performed at P8. b, c Representative blots and quantification of flow cytometric analysis of CD45+CD11b+ microglia (b) and PDGFRα+ oligodendrocyte progenitors (OPCs; c) pre-gated on living cells, single cells, Gr1 cells of mice treated as depicted in a (n = 5–6, samples are from four independent experiments). Each symbol represents one mouse. Means with SEM are represented. Significant differences were determined by an unpaired t test: *P < 0.05, **P < 0.01. d Quantitative RT-PCR of Csf1r of sorted CD45+CD11b+ microglia and NG2+PDGFRα+ OPCs from P8 NG2YFP/Wt mice (n = 5). Data are normalized to Gapdh and β-Actin and presented as fold change to microglia levels. e Representative image of a primary postnatal OPC culture showing overlapping Olig2+/DAPI+ cells (left). OPC cultures were treated for 3 days with vehicle or different concentrations of BLZ945 (0.5, 1, and 5 μM). The number of DAPI+OPCs/coverslip did not change after treatment compared to the vehicle controls. f Representative immunofluorescent images (left) of the corpus callosum showing CX3CR1+ (green) microglia and PDGFRα+ (red) OPCs in vehicle or BLZ945-treated mice. Right quantification of these cells in the corpus callosum (CC), cortex (Cx), and cerebellum (Cb). Each symbol represents one mouse. Means with SEM are represented. n = 4; samples from two independent experiments. Scale bar 40 μm. Significant differences were examined by an unpaired t test and marked with asterisks (*P < 0.05, **P < 0.01). g Representative immunofluorescent images (left) of the corpus callosum showing Sox9+ (red) astrocytes and PDGFRα+ (green) OPCs in vehicle or BLZ945-treated mice. Right quantification of Sox9+/PDGFRα astrocytes in the corpus callosum (CC), cortex (Cx), and cerebellum (Cb). n = 4–5; samples from two independent experiments. Scale bar 40 μm. Significant differences were examined by an unpaired t test. n.s. not significant. h Quantification of PDGFRα+ OPCs and CC1+ oligodendrocytes in the corpus callosum (CC) and cortex (Cx) of P20 Csf1r+/+ and Csf1r−/− mice. Significant differences were examined by an unpaired t test and marked with asterisks (*P < 0.05). n.s. not significant
Fig. 4
Fig. 4
Reduced postnatal myelinogenesis in microglia-depleted mice. a Scheme of experimental setup. Cx3cr1GFP/Wt mice were injected intraperitoneally (i.p.) with BLZ945 at P2, P4, P6, and P7. Analysis was done at P20. bf Quantification of CX3CR1+ microglia (b), PDGFRα+ OPCs (c), CC1+ oligodendrocytes (d), Sox9+/PDGFRα astrocytes (e), and NeuN+ neurons (f) in the indicated brain regions using immunohistochemically stained brain slices. Significant differences were examined by an unpaired t test and marked with asterisks (*P < 0.05, **P < 0.01). Each symbol represents one mouse. Bars represent mean ± SEM. g Quantitative RT-PCR of the genes proteolipid protein (Plp), myelin basic protein (Mbp), myelin oligodendrocyte glycoprotein (Mog), chondroitin sulfate proteoglycan 4 (Cspg4 = NG2), platelet derived growth factor receptor alpha (Pdgfrα), colony stimulating 1 receptor (Csf1r), and allograft inflammatory factor 1 (Aif1) in tissue isolated from the corpus callosum and cerebellum at P20 (n = 4; samples from two independent experiments). Data were normalized to Gapdh and β-actin and are presented as fold change normed to vehicle. Significant differences were examined by an unpaired t test and marked with asterisks (*P < 0.05, **P < 0.01, ***P < 0.001). h, i Western blot analysis for the myelin proteins proteolipid protein (PLP) and myelin basic protein (MBP) in the corpus callosum and cerebellum at P20. GAPDH was used as a loading control. Quantification (right) was performed by normalization of the myelin proteins to GAPDH. Significant differences were examined by an unpaired t test and marked with asterisks (*P < 0.05, **P < 0.01, ***P < 0.001). Bars indicate mean ± SEM. j Representative electron microscope images from the corpus callosum treated with vehicle or BLZ945 at P20 (left, scale bar 2 μm) and quantification thereof (right). The total number of axons (myelinated and non-myelinated cut off ≥0.5 μm), the percentage of myelinated axons of all axons, and the G-ratio (axon diameter/filament diameter) were quantified (n = 5–6; samples from two independent experiments). Each symbol represents one mouse. Mean ± SEM are presented. Significant differences were examined by an unpaired t test and marked with asterisks (*P < 0.05). k Scheme of experimental setup. Cx3cr1GFP/Wt mice were injected i.p. with BLZ945 at P2, P4, P6, and P7. Analysis was done at P40–42. l Western blot analysis for the myelin proteins PLP and MBP in the corpus callosum and cerebellum at P40–42. GAPDH was used as a loading control. Quantification (right) was performed by normalization of the myelin proteins to GAPDH. Significant differences were examined by an unpaired t test and marked with asterisks (*P < 0.05). Bars indicate mean ± SEM
Fig. 5
Fig. 5
Microglia are necessary for myelin homeostasis during adulthood. a Scheme of experimental setup. 6–10-week-old Cx3cr1GFP/Wt mice were treated with BLZ945 for 7 consecutive days by oral gavage. Analysis was performed 1 day after the last application. b, c Quantification of CX3CR1+ microglia, PDGFRα+ OPCs, CC-1+ oligodendrocytes, Sox9+ astrocytes (b, d) in the corpus callosum (b) and cerebellum (c) using immunohistochemically stained brain sections at day 8. n = 4–7; samples from two independent experiments. Significant differences were examined by an unpaired t test and marked with asterisks (*P < 0.05, **P < 0.01, ***P < 0.001; n.s not significant.) Each symbol represents one mouse. Mean ± SEM are depicted. d Quantitative RT-PCR of the genes proteolipid protein (Plp), myelin basic protein (Mbp), myelin oligodendrocyte glycoprotein (Mog), chondroitin sulfate proteoglycan 4 (Cspg4), platelet derived growth factor receptor alpha (Pdgfrα), colony stimulating 1 receptor (Csf1r), and allograft inflammatory factor 1 (Aif1) in tissue isolated from the corpus callosum and cerebellum at day 8 (n = 4–7; samples from two independent experiments). Data were normalized to Gapdh and β-actin and are presented as fold change normed to vehicle. Significant differences were examined by an unpaired t test and marked with asterisks (*P < 0.05, **P < 0.01, ***P < 0.001). Bars represent mean ± SEM. e Western blot analysis for proteolipid protein (PLP) and myelin basic protein (MBP) in the corpus callosum at P8, 1 day after the last BLZ945 application. GAPDH was used as a loading control. Quantification (right) was performed by normalization of the myelin proteins to GAPDH. Bars indicate mean ± SEM. Significant differences were examined by an unpaired t test (n.s not significant). f Scheme of experimental setup. 8–10-week-old Sox10-iCreERT2 × CAG-eGFP mice were treated with BLZ945 for 5 consecutive days by oral gavage. Analysis was performed 1 day after the last application. g, i Quantification of Iba-1+ microglia, Sox10-GFP+/NG2+ OPCs (g), Sox10-GFP+/NG2 oligodendrocytes and GFAP+/S100β+ astrocytes (i) in the corpus callosum using immunohistochemically stained brain sections at day 6. n = 5–6, samples from two independent experiments. Significant differences were examined by an unpaired t test and marked with asterisks (**P < 0.01, ***P < 0.001; n.s not significant.) Each symbol represents one mouse. Mean ± SEM are depicted. h Representative confocal images of a NG2-immunofluorescence in the corpus callosum of a mouse treated with vehicle (left) or BLZ945 for 5 consecutive days. Scale bar 50 μm

References

    1. Amit I, Winter DR, Jung S. The role of the local environment and epigenetics in shaping macrophage identity and their effect on tissue homeostasis. Nat Immunol. 2016;17:18–25. - PubMed
    1. Banisadr G, Frederick TJ, Freitag C, Ren D, Jung H, Miller SD, Miller RJ. The role of CXCR4 signaling in the migration of transplanted oligodendrocyte progenitors into the cerebral white matter. Neurobiol Dis. 2011;44:19–27. doi: 10.1016/j.nbd.2011.05.019. - DOI - PMC - PubMed
    1. Bruttger J, Karram K, Wörtge S, Regen T, Marini F, Hoppmann N, Klein M, Blank T, Yona S, Wolf Y, Mack M, Pinteaux E, Müller W, Zipp F, Binder H, Bopp T, Prinz M, Jung S, Waisman A. Genetic cell ablation reveals clusters of local self-renewing microglia in the mammalian central nervous system. Immunity. 2015;43:92–106. doi: 10.1016/j.immuni.2015.06.012. - DOI - PubMed
    1. Butovsky O, Ziv Y, Schwartz A, Landa G, Talpalar AE, Pluchino S, Martino G, Schwartz M. Microglia activated by IL-4 or IFN-γ differentially induce neurogenesis and oligodendrogenesis from adult stem/progenitor cells. Mol Cell Neurosci. 2006;31:149–160. doi: 10.1016/j.mcn.2005.10.006. - DOI - PubMed
    1. Chitu V, Gokhan S, Nandi S, Mehler MF, Stanley ER. Emerging roles for CSF-1 receptor and its ligands in the nervous system. Trends Neurosci. 2016;39:378–393. doi: 10.1016/j.tins.2016.03.005. - DOI - PMC - PubMed

Publication types