. 2017 Jul 7:8:16075.
doi: 10.1038/ncomms16075.

Understanding extreme sea levels for broad-scale coastal impact and adaptation analysis

Affiliations

Understanding extreme sea levels for broad-scale coastal impact and adaptation analysis

T Wahl et al. Nat Commun. .

Abstract

One of the main consequences of mean sea level rise (SLR) on human settlements is an increase in flood risk due to an increase in the intensity and frequency of extreme sea levels (ESL). While substantial research efforts are directed towards quantifying projections and uncertainties of future global and regional SLR, corresponding uncertainties in contemporary ESL have not been assessed and projections are limited. Here we quantify, for the first time at global scale, the uncertainties in present-day ESL estimates, which have by default been ignored in broad-scale sea-level rise impact assessments to date. ESL uncertainties exceed those from global SLR projections and, assuming that we meet the Paris agreement goals, the projected SLR itself by the end of the century in many regions. Both uncertainties in SLR projections and ESL estimates need to be understood and combined to fully assess potential impacts and adaptation needs.


Conflict of interest statement

The authors declare no competing financial interests.

Figures
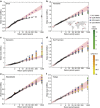
Figure 1
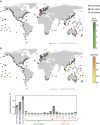
Figure 1. Spread from using different extreme value analysis methods.
(af) Return water levels are shown for selected tide gauge sites (see panel b for locations). Plotting positions (PLPs) were obtained with the Weibull formula from the observed annual maxima time series (AMAX) and are therefore directly comparable to the Gumbel (GUM) and Generalized Extreme Value (GEV) fits to AMAX but not to results obtained with the Generalized Pareto Distribution (GPD) for varying thresholds and the GEV fits to r-largest time series. Shaded bands are 95% confidence bounds of the GUM-AMAX method.
Figure 2
Figure 2. Uncertainties in present-day extreme sea level estimates and in regional sea-level rise projections.
(a) 5 to 95% inter-model uncertainty ranges in 100-year return water levels. (b) 5–95% uncertainty ranges in regional sea- level rise projections under the Representative Concentration Pathway 4.5 scenario (2081–2100 mean minus 1986–2005 mean) at grid points closest to the tide gauge locations. (c) Combined extreme sea level uncertainties (100-year events) from summing up the 5–95% inter-model uncertainties from the extreme value analysis and (absolute) offsets found in the Global Tide and Surge Reanalysis (GTSR) model data set.
Figure 3
Figure 3. Extreme value analysis methods leading to conservative and optimistic results.
(a) Methods leading to the highest and (b) methods leading to the lowest 100-year return water levels at individual sites. (c) Relative frequency of different methods leading to the highest (light grey) and lowest (dark grey) 100-year return water levels.
Figure 4
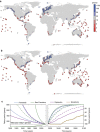
Figure 4. Changes in return periods due to sea-level rise when using different extreme value analysis models.
(a,b) Return period in 2050 (assuming regional relative sea-level rise (SLR) under Representative Concentration Pathway (RCP) 4.5 scenario) of present-day 100-year water level when using (a) Gumbel distribution with annual maxima (GUM-AMAX) and (b) Generalized Pareto Distribution with 99th percentile threshold exceedances (GPD99). (c) Changes in return period of present-day 100-year water levels through time (1900 to 2100; RCP4.5 scenario) at four selected sites: Fremantle (blue; past SLR trend 1.73 mm per year), Galveston (red; past SLR trend 6.31 mm per year), San Francisco (green; past SLR trend 1.87 mm per year), and Stockholm (brown; past SLR trend −3.78 mm per year). Results are shown for GUM-AMAX (dashed lines) and GPD99 (solid lines); horizontal grey line represents the 100-year return period. Locations of the four sites can be seen in the inset in Fig. 1b.
Figure 5
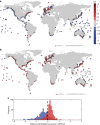
Figure 5. Offsets between return water levels derived from observations and models.
(a,b) Differences in 100-year return water levels obtained from tide gauge observations with the Gumbel distribution and annual maxima (GUM-AMAX) method and those from the (a) DINAS-COAST (D-C) and (b) Global Tide and Surge Reanalysis (GTSR) data sets (negative values indicate that models overestimate extreme sea levels). (c) Histograms of differences between 100-year return water levels from observations and D-C (blue) and GTSR (red).
Figure 6
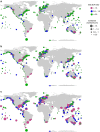
Figure 6. Combined regional sea-level rise and extreme sea level uncertainties.
Combined uncertainties (5–95% range; see circle sizes for magnitude) in future sea-level rise (SLR) projections (Representative Concentration Pathway 4.5 scenario and 2081–2100 mean minus 1986–2005 mean) and present-day extreme sea level estimates and their relative importance (see colour coding) for the (a) 10-year, (b) 100-year and (c) 1,000-year return periods.
Figure 7
Figure 7. Temporal changes in extreme sea level (here for the 100-year events) and sea-level rise uncertainty contribution.
(a,c,e,g) Changes through time (2015–2100) in the combined (red) and individual sea-level rise (SLR) (blue) (Representative Concentration Pathway 4.5 scenario) and extreme sea level (ESL) (green) uncertainties for the 100-year events. (b,d,f,h) Changes in the relative contribution of ESL (green; 100-year events) and SLR (blue) uncertainties through time. Results are shown for the same four sites as in Fig. 4c, with their locations depicted in Fig. 1b.

References

    1. Hinkel J. et al.. Coastal flood damage and adaptation cost under 21st century sea-level rise. Proc. Natl Acad. Sci. USA 111, 3292–3297 (2014). - PMC - PubMed
    1. Kron W. Coasts: the high-risk areas of the world. Nat. Hazards 66, 1363–1382 (2013).
    1. Church J. A. et al.. in IPCC Climate Change 2013: the Physical Science Basis (eds Stocker T. F.et al.. 1137–1216Cambridge University Press (2013).
    1. Wong P. P. et al.. in IPCC Climate Change 2014: impacts, Adaptation, and Vulnerability (eds Field C. B.et al.. 361–409Cambridge University Press (2014).
    1. Hallegatte S., Green C., Nicholls R.J. & Corfee-Morlot J. Future flood losses in major coastal cities. Nat. Clim. Change 3, 802–806 (2013).

Publication types

LinkOut - more resources