

Iron homeostasis in plants - a brief overview
- PMID: 28686269
- PMCID: PMC5708359
- DOI: 10.1039/c7mt00136c
Iron homeostasis in plants - a brief overview
Abstract
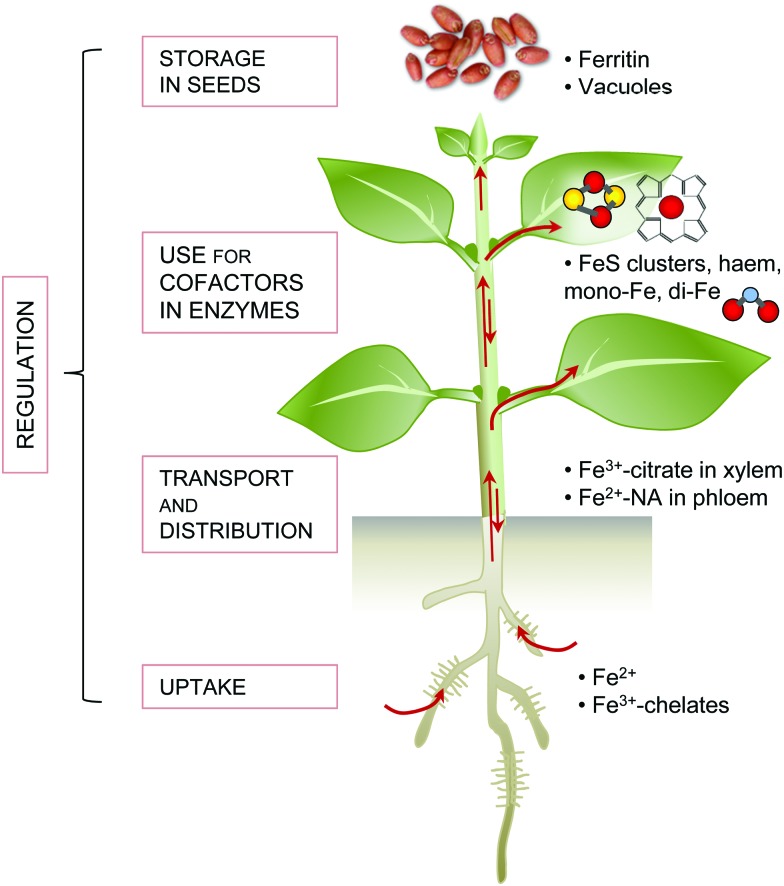
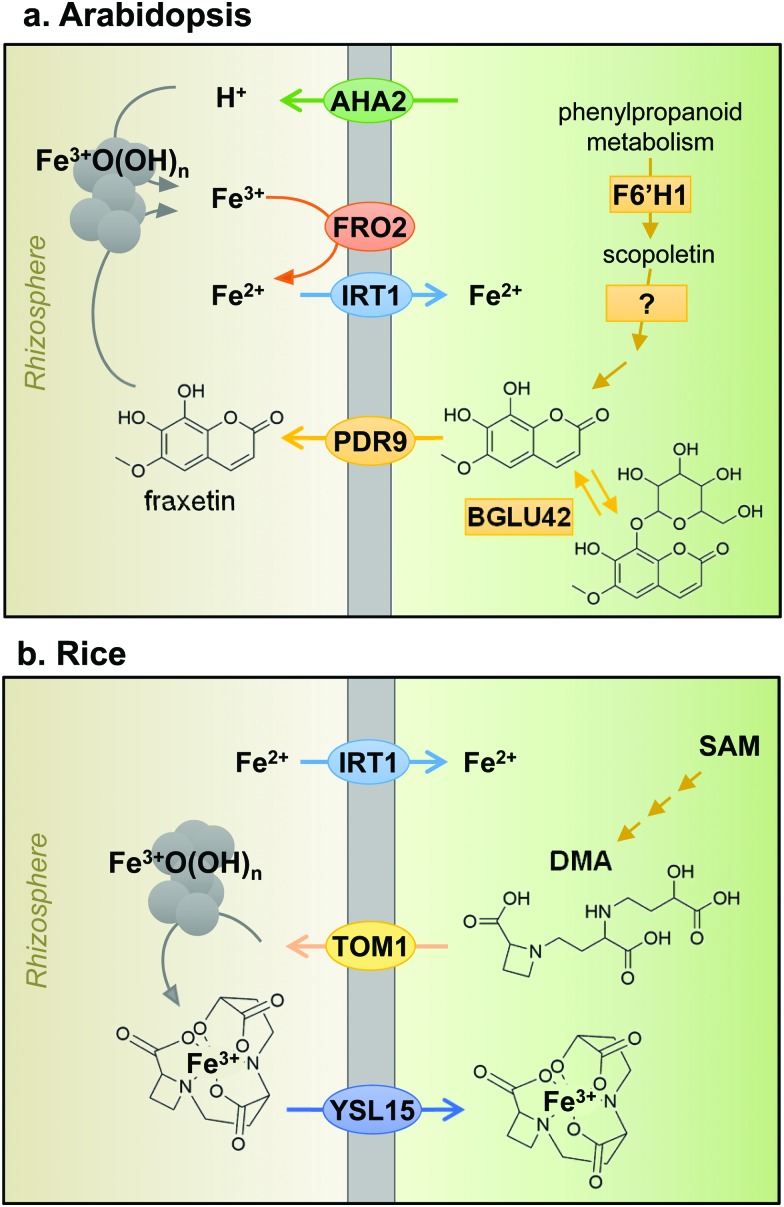
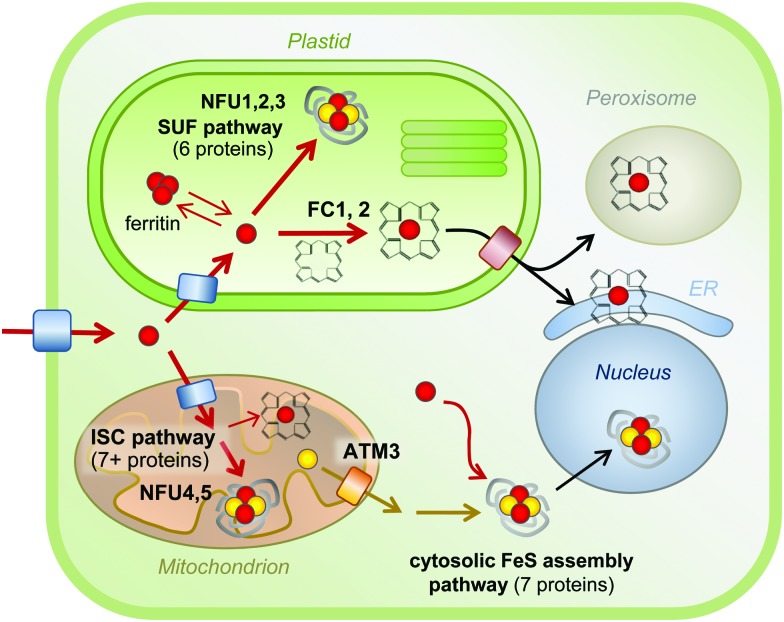
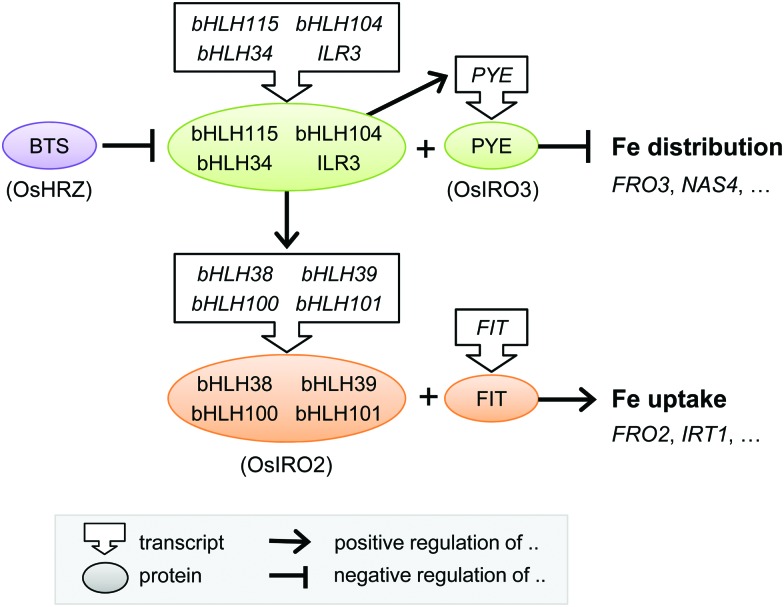
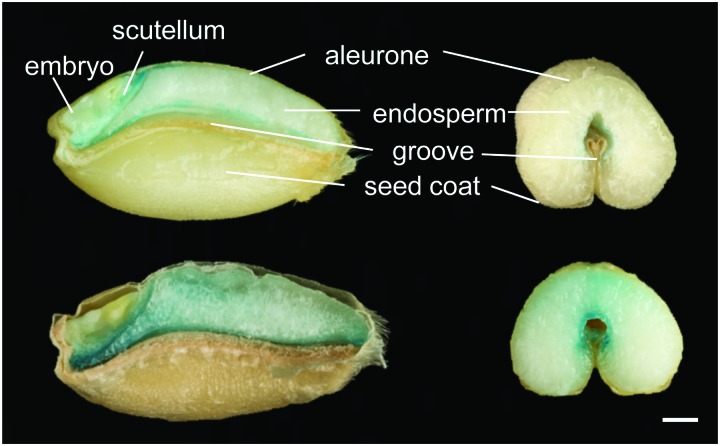
Iron plays a crucial role in biochemistry and is an essential micronutrient for plants and humans alike. Although plentiful in the Earth's crust it is not usually found in a form readily accessible for plants to use. They must therefore sense and interact with their environment, and have evolved two different molecular strategies to take up iron in the root. Once inside, iron is complexed with chelators and distributed to sink tissues where it is used predominantly in the production of enzyme cofactors or components of electron transport chains. The processes of iron uptake, distribution and metabolism are overseen by tight regulatory mechanisms, at the transcriptional and post-transcriptional level, to avoid iron concentrations building to toxic excess. Iron is also loaded into seeds, where it is stored in vacuoles or in ferritin. This is important for human nutrition as seeds form the edible parts of many crop species. As such, increasing iron in seeds and other tissues is a major goal for biofortification efforts by both traditional breeding and biotechnological approaches.
Figures
Similar articles
-
Iron sensing, signalling and acquisition by microbes and plants under environmental stress: Use of iron-solubilizing bacteria in crop biofortification for sustainable agriculture.Plant Sci. 2025 Jul;356:112496. doi: 10.1016/j.plantsci.2025.112496. Epub 2025 Apr 11. Plant Sci. 2025. PMID: 40222392 Review.
-
Homing in on iron homeostasis in plants.Trends Plant Sci. 2009 May;14(5):280-5. doi: 10.1016/j.tplants.2009.02.006. Epub 2009 Apr 15. Trends Plant Sci. 2009. PMID: 19375375 Review.
-
Iron Availability and Homeostasis in Plants: A Review of Responses, Adaptive Mechanisms, and Signaling.Methods Mol Biol. 2023;2642:49-81. doi: 10.1007/978-1-0716-3044-0_3. Methods Mol Biol. 2023. PMID: 36944872 Review.
-
MicroRNAs modulating nutrient homeostasis: a sustainable approach for developing biofortified crops.Protoplasma. 2023 Jan;260(1):5-19. doi: 10.1007/s00709-022-01775-w. Epub 2022 Jun 3. Protoplasma. 2023. PMID: 35657503 Review.
-
Iron uptake, trafficking and homeostasis in plants.Planta. 2003 Feb;216(4):541-51. doi: 10.1007/s00425-002-0920-4. Epub 2002 Nov 26. Planta. 2003. PMID: 12569395 Review.
Cited by
-
Further insights into the role of bHLH121 in the regulation of iron homeostasis in Arabidopsis thaliana.Plant Signal Behav. 2020 Oct 2;15(10):1795582. doi: 10.1080/15592324.2020.1795582. Epub 2020 Jul 21. Plant Signal Behav. 2020. PMID: 32692954 Free PMC article.
-
Supraoptimal Iron Nutrition of Brassica napus Plants Suppresses the Iron Uptake of Chloroplasts by Down-Regulating Chloroplast Ferric Chelate Reductase.Front Plant Sci. 2021 May 20;12:658987. doi: 10.3389/fpls.2021.658987. eCollection 2021. Front Plant Sci. 2021. PMID: 34093616 Free PMC article.
-
Mitochondrial Iron Transporters (MIT1 and MIT2) Are Essential for Iron Homeostasis and Embryogenesis in Arabidopsis thaliana.Front Plant Sci. 2019 Nov 25;10:1449. doi: 10.3389/fpls.2019.01449. eCollection 2019. Front Plant Sci. 2019. PMID: 31850005 Free PMC article.
-
Genetic Basis and Breeding Perspectives of Grain Iron and Zinc Enrichment in Cereals.Front Plant Sci. 2018 Jul 2;9:937. doi: 10.3389/fpls.2018.00937. eCollection 2018. Front Plant Sci. 2018. PMID: 30013590 Free PMC article. Review.
-
Small-Molecules Selectively Modulate Iron-Deficiency Signaling Networks in Arabidopsis.Front Plant Sci. 2019 Jan 31;10:8. doi: 10.3389/fpls.2019.00008. eCollection 2019. Front Plant Sci. 2019. PMID: 30766541 Free PMC article.
References
Publication types
MeSH terms
Substances
Grants and funding
LinkOut - more resources
Full Text Sources
Other Literature Sources
Medical
Research Materials
