

Diagnostic accuracy of tablet-based software for the detection of concussion
- PMID: 28686616
- PMCID: PMC5501428
- DOI: 10.1371/journal.pone.0179352
Diagnostic accuracy of tablet-based software for the detection of concussion
Abstract
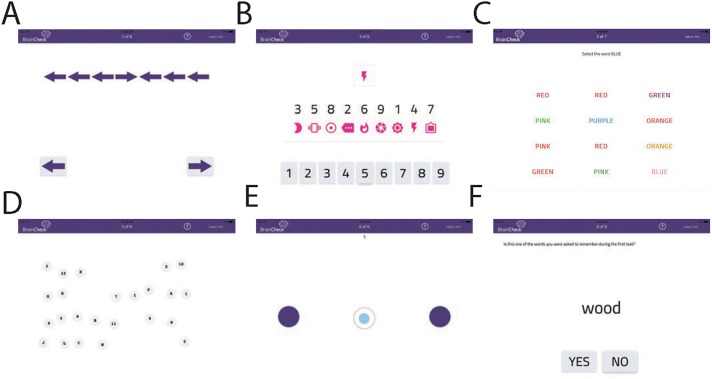
Despite the high prevalence of traumatic brain injuries (TBI), there are few rapid and straightforward tests to improve its assessment. To this end, we developed a tablet-based software battery ("BrainCheck") for concussion detection that is well suited to sports, emergency department, and clinical settings. This article is a study of the diagnostic accuracy of BrainCheck. We administered BrainCheck to 30 TBI patients and 30 pain-matched controls at a hospital Emergency Department (ED), and 538 healthy individuals at 10 control test sites. We compared the results of the tablet-based assessment against physician diagnoses derived from brain scans, clinical examination, and the SCAT3 test, a traditional measure of TBI. We found consistent distributions of normative data and high test-retest reliability. Based on these assessments, we defined a composite score that distinguishes TBI from non-TBI individuals with high sensitivity (83%) and specificity (87%). We conclude that our testing application provides a rapid, portable testing method for TBI.
Conflict of interest statement
Figures


Similar articles
-
Assessment of acute head injury in an emergency department population using sport concussion assessment tool - 3rd edition.Appl Neuropsychol Adult. 2018 Mar-Apr;25(2):110-119. doi: 10.1080/23279095.2016.1248765. Epub 2016 Nov 17. Appl Neuropsychol Adult. 2018. PMID: 27854143
-
Adult sports-related traumatic brain injury in United States trauma centers.Neurosurg Focus. 2016 Apr;40(4):E4. doi: 10.3171/2016.1.FOCUS15613. Neurosurg Focus. 2016. PMID: 27032921
-
An alternative to the balance error scoring system: using a low-cost balance board to improve the validity/reliability of sports-related concussion balance testing.Clin J Sport Med. 2014 May;24(3):256-62. doi: 10.1097/JSM.0000000000000016. Clin J Sport Med. 2014. PMID: 24284947
-
Ethical implications of neuroimaging in sports concussion.J Head Trauma Rehabil. 2012 May-Jun;27(3):216-21. doi: 10.1097/HTR.0b013e3182229b6c. J Head Trauma Rehabil. 2012. PMID: 21897290 Review.
-
Retirement-from-sport considerations following pediatric sports-related concussion: case illustrations and institutional approach.Neurosurg Focus. 2016 Apr;40(4):E8. doi: 10.3171/2016.1.FOCUS15600. Neurosurg Focus. 2016. PMID: 27032925 Review.
Cited by
-
Circulating FGF-21 as a Disease-Modifying Factor Associated with Distinct Symptoms and Cognitive Profiles in Myalgic Encephalomyelitis and Fibromyalgia.Int J Mol Sci. 2025 Aug 8;26(16):7670. doi: 10.3390/ijms26167670. Int J Mol Sci. 2025. PMID: 40868993 Free PMC article.
-
A Rapid, Mobile Neurocognitive Screening Test to Aid in Identifying Cognitive Impairment and Dementia (BrainCheck): Cohort Study.JMIR Aging. 2019 Mar 21;2(1):e12615. doi: 10.2196/12615. JMIR Aging. 2019. PMID: 31518280 Free PMC article.
-
Using health technology to capture digital phenotyping data in HIV-associated neurocognitive disorders.AIDS. 2021 Jan 1;35(1):15-22. doi: 10.1097/QAD.0000000000002726. AIDS. 2021. PMID: 33048886 Free PMC article. No abstract available.
-
The Cognitive Sequelae of Transient Ischemic Attacks-Recent Insights and Future Directions.J Clin Med. 2022 May 7;11(9):2637. doi: 10.3390/jcm11092637. J Clin Med. 2022. PMID: 35566762 Free PMC article. Review.
-
Diagnostic test accuracy of self-administered cognitive assessment tools for dementia.Cochrane Database Syst Rev. 2024 Dec 19;12(12):CD013725. doi: 10.1002/14651858.CD013725.pub2. Cochrane Database Syst Rev. 2024. PMID: 39698927
References
-
- Daneshvar DH, Nowinski CJ, McKee AC, Cantu RC. The epidemiology of sport-related concussion. Clin Sports Med. 2011; 30(1):1–17. doi: 10.1016/j.csm.2010.08.006 - DOI - PMC - PubMed
-
- Control CfD, Prevention U. Nonfatal traumatic brain injuries related to sports and recreation activities among persons aged ≤19 years—United States, 2001–2009. MMWR Morb Mortal Wkly Rep. 2011; 60(39):1337–42. - PubMed
-
- Lew HL, Thomander D, Chew KT, Bleiberg J. Review of sports-related concussion: Potential for application in military settings. J Rehabil Res Dev. 2007; 44(7):963–74. Epub 2007/12/14. - PubMed
-
- Greenwald RM, Chu JJ, Beckwith JG, Crisco JJ. A proposed method to reduce underreporting of brain injury in sports. Clin J Sport Med. 2012; 22(2):83–5. doi: 10.1097/JSM.0b013e31824cc5d3 - DOI - PubMed
-
- Halstead ME, Walter KD. Sport-related concussion in children and adolescents. Pediatrics. 2010; 126(3):597–615. doi: 10.1542/peds.2010-2005 - DOI - PubMed
MeSH terms
LinkOut - more resources
Full Text Sources
Other Literature Sources
Medical
