. 2017 Jul 7;12(7):e0180828.
doi: 10.1371/journal.pone.0180828. eCollection 2017.

Drosophila lines with mutant and wild type human TDP-43 replacing the endogenous gene reveals phosphorylation and ubiquitination in mutant lines in the absence of viability or lifespan defects

Affiliations

Drosophila lines with mutant and wild type human TDP-43 replacing the endogenous gene reveals phosphorylation and ubiquitination in mutant lines in the absence of viability or lifespan defects

Jer-Cherng Chang et al. PLoS One. .

Abstract

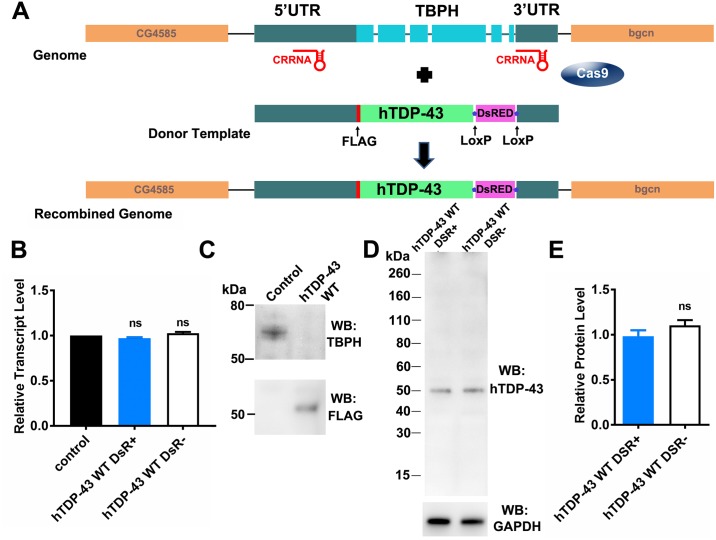
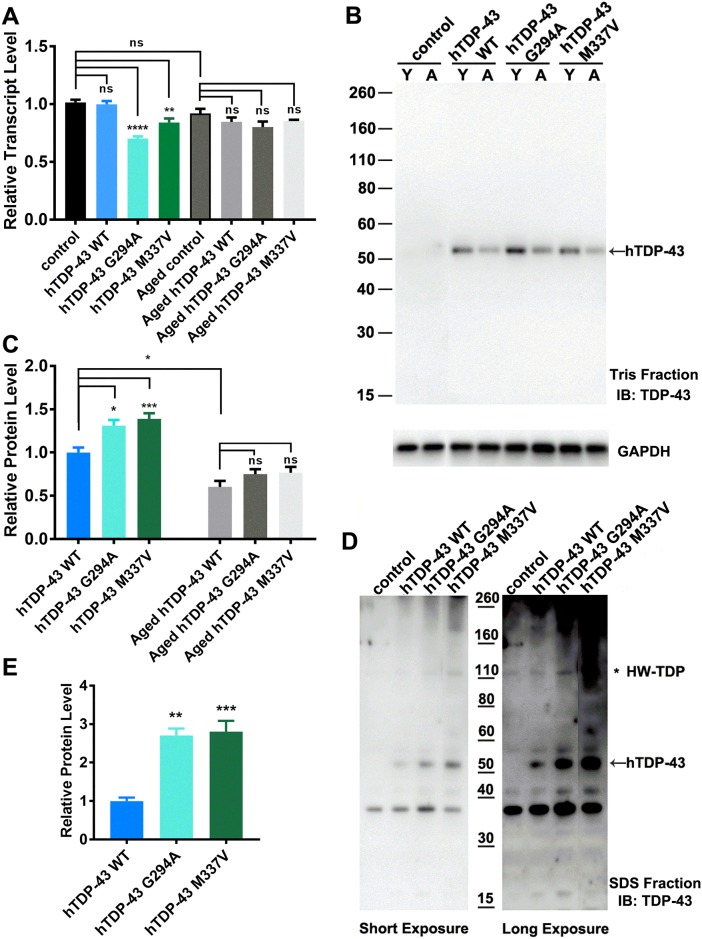
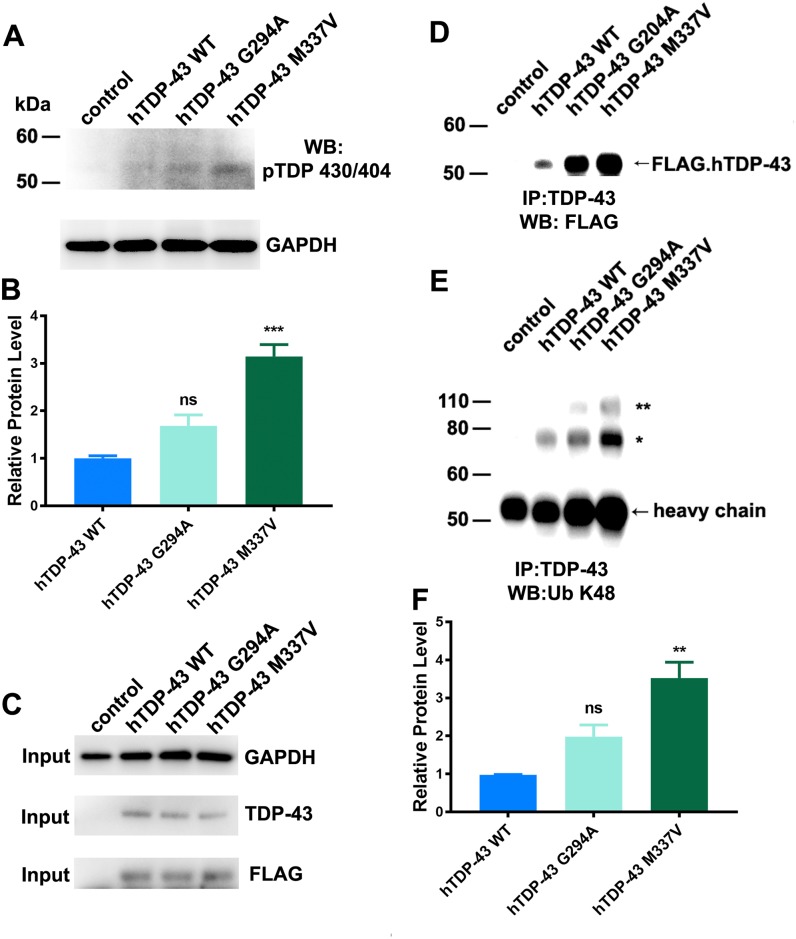
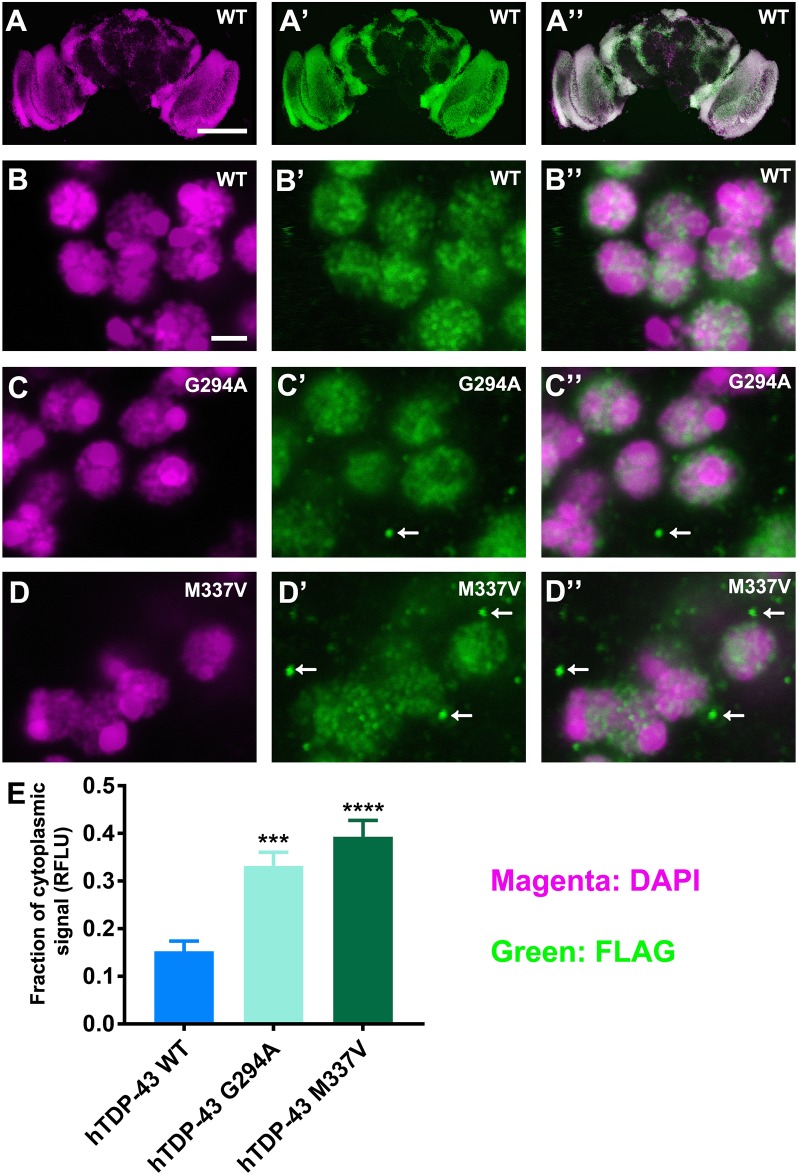
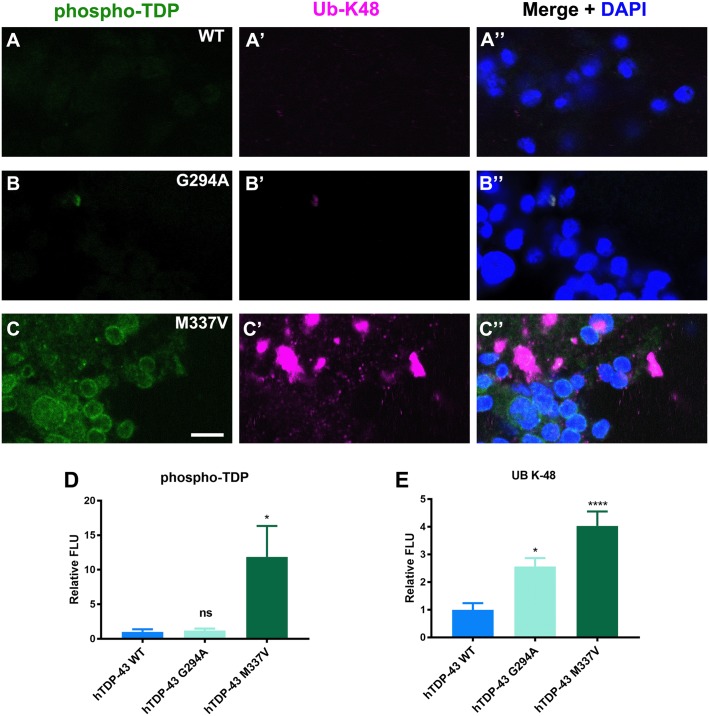
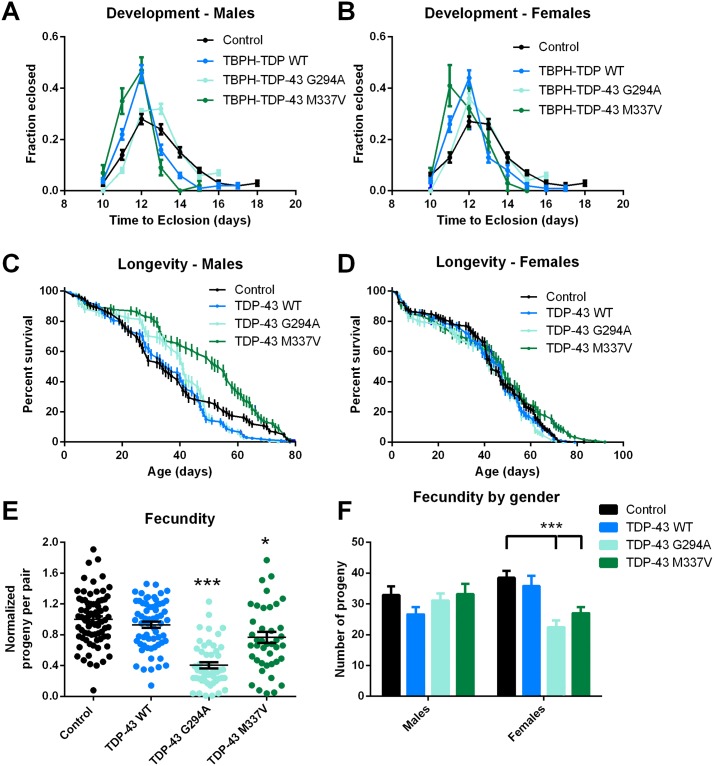
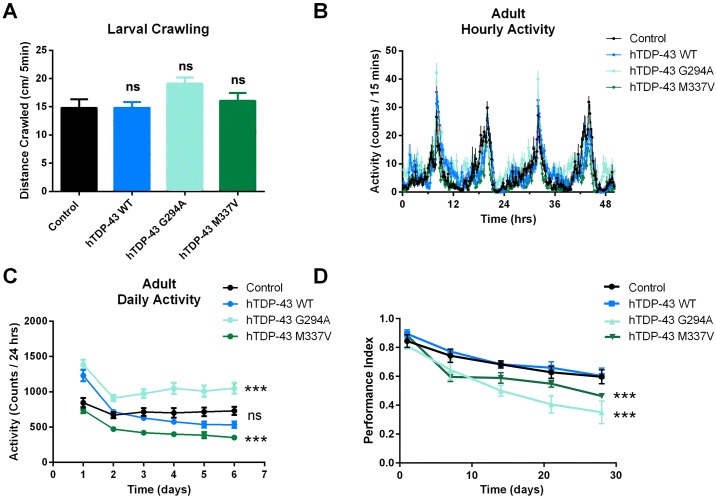
Mutations in TDP-43 are associated with proteinaceous inclusions in neurons and are believed to be causative in neurodegenerative diseases such as frontotemporal dementia or amyotrophic lateral sclerosis. Here we describe a Drosophila system where we have engineered the genome to replace the endogenous TDP-43 orthologue with wild type or mutant human TDP-43(hTDP-43). In contrast to other models, these flies express both mutant and wild type hTDP-43 at similar levels to those of the endogenous gene and importantly, no age-related TDP-43 accumulation observed among all the transgenic fly lines. Immunoprecipitation of TDP-43 showed that flies with hTDP-43 mutations had increased levels of ubiquitination and phosphorylation of the hTDP-43 protein. Furthermore, histologically, flies expressing hTDP-43 M337V showed global, robust neuronal staining for phospho-TDP. All three lines: wild type hTDP-43, -G294A and -M337V were homozygous viable, with no defects in development, life span or behaviors observed. The primary behavioral defect was that flies expressing either hTDP-43 G294A or M337V showed a faster decline with age in negative geotaxis. Together, these observations implied that neurons could handle these TDP-43 mutations by phosphorylation- and ubiquitin-dependent proteasome systems, even in a background without the wild type TDP-43. Our findings suggest that these two specific TDP-43 mutations are not inherently toxic, but may require additional environmental or genetic factors to affect longevity or survival.


Conflict of interest statement

Competing Interests: The authors have declared that no competing interests exist.

Figures

Fig 1
Fig 1. Replacement of the Drosophila TBPH gene with human TDP-43 (hTDP-43) using the CRISPR/Cas9 genome editing system.
A. Schematic diagram showing the relative positions of chimeric RNA (CRRNA) hybridization site in the TBPH gene and the donor template containing the 5' UTR of TBPH, hTDP-43 cDNA, the DsRed cassette flanked by LoxP sites and the 3'UTR of TBPH. B. Real time RT-PCR using a probe against the 5'UTR of TBPH showing unchanged levels of transcript in control flies, and flies expressing wild type hTDP-43 either retaining the DsRED cassette (hTDP-43 DsR+) or with it excised (hTDP-43 DsR-). Mean and standard error from six independent samples are shown. One way ANOVA showed no significant (ns) differences between the genotypes. C. Representative immuno-blot from adult heads showing TBPH present in control flies but not transgenic hTDP-43 WT flies (upper panel) and hTDP-43 (detected with an anti-FLAG antibody) present in flies expressing wild type hTDP-43 but not in control flies (lower panel). D. Representative hTDP-43 immuno-blot from adult heads showing a single band of the expected molecular weight, with similar protein levels in flies with (DSR+) or without (DSR-) the DsRED cassette. The lower panel shows the levels of GAPDH used as a loading control. E. Quantification of immunoblots. The intensity of the hTDP-43 immuno-reactive band was quantified, normalized to the intensity of GAPDH band and compared to the ratio obtained for the DsRED positive fly. T-test showed no significant (ns) change when the DsRed cassette was excised.
Fig 2
Fig 2. TDP-43 mutations result in changes of transcript and protein level in young flies, but not in aged flies.
A. Transcript levels. Real time RT-PCR was carried out on the total RNA from adult heads of young (7 day old) and aged (28 day old) animals. For each sample, primers to the 5’ UTR of TBPH and three separate housekeeping genes were used (EF2, CG9165 and SDha) and the relative expression levels averaged across each housekeeping gene and then normalized to the relative expression in control flies. No significant difference between control flies and flies expressing wild type hTDP-43 was seen; whereas flies expressing either mutant hTDP-43 had significantly lower levels of hTDP-43 transcript. However, these transcript variations between hTDP-43 wild type and mutant flies were diminished in aged samples. Mean and SEM from three independent samples are shown, ** p<0.01, **** p<0.0001(ANOVA). B-E. Protein levels. Adult fly heads from each genotype were homogenized in Tris buffer (see Methods), centrifuged and the supernatant (Tris fraction) analyzed by immunoblot with an anti-hTDP-43 antiserum and anti-GAPDH as a loading control. The pellet was re-homogenized in SDS buffer, centrifuged and the supernatant (SDS fraction) analyzed by immunoblot in parallel. B. Representative immuno-blot for Tris-soluble fractions of young (Y) and aged (A) flies for each genotype. C. Quantification of Tris-soluble fraction showing increased levels of hTDP-43 in both lines expressing mutant hTDP-43 relative to flies expressing wild type hTDP-43 (WT hTDP-43). The intensity of the 50kDa band was digitized and the relative intensity compared to that of GAPDH calculated. For each blot the relative expression was normalized to the expression of hTDP-43 in flies expressing wild type hTDP-43. The levels of hTDP-43 in flies expressing mutant hTDP-43 was significantly elevated relative to flies expressing wild type hTDP-43. Notably, the hTDP-43 protein level was decreased with age in all fly lines. There was no difference in hTDP-43 levels among all the aged genotypes. *p<0.05, ** p<0.01, (ANOVA) (mean and SEM, n = 3–9). D. Representative blot for the SDS-soluble fraction for each genotype. The two panels represent different exposures with the longer exposure revealing increased levels of high molecular weight species of hTDP-43 in the flies expressing mutant hTDP-43. E. Quantification of immunoblots for the SDS-soluble fractions showing increased levels of hTDP-43 in both lines expressing mutant hTDP-43 relative to flies expressing wild type hTDP-43 (WT hTDP-43). The intensity of the ~50 kDa band was digitized and the relative intensity compared to that of GAPDH calculated. For each blot the relative expression was normalized to the expression of hTDP-43 in flies expressing wild type hTDP-43. The levels of hTDP-43 in flies expressing mutant hTDP-43 was significantly elevated relative to flies expressing wild type hTDP-43. ** p<0.01, (ANOVA) (mean and SEM, n = 3).
Fig 3
Fig 3. Characterization of the phosphorylated and ubiquitinated hTDP-43 in flies expressing mutant and wild-type hTDP-43.
A. Representative immunoblots of head lysates blotted with anti-pTDP and anti-GAPDH. B. Quantification of the immunoreactive pTDP signal, normalized to the signal of GAPDH. C. Input levels. Representative immunoblots of input samples probed with anti-GAPDH, -TDP-43 and -FLAG antiserum. D-F. Immunoprecipitated samples. Adult fly heads from each genotype were homogenized in Tris buffer (see Methods), centrifuged and the supernatants immunoprecipitated with anti-TDP-43 and protein G agarose and analyzed by immuno-blots. D. Representative immuno-blot probed for FLAG.hTDP-43. Both mutant fly lines (G294A and M337V) revealed the full length hTDP-43 (~50 kDa), and also a truncated fragment (~40 kDa). Samples from both mutants also revealed significantly higher levels of hTDP-43 compared to flies expressing wild type hTDP-43. E. Representative immuno-blot probed for the K48 specific ubiquitin linkage (Ub K48). An approximately 80-kDa UB K48 signal was present in all of the transgenic hTDP-43 fly samples (*), whereas a larger, approximately 110-kDa Ub K48 band was only detectible in samples from the mutant hTDP-43 lines. F. Quantification of the 80-kDa Ub K48 signal shows that the sample of the M337V mutant has the significant increase of Ub K48 intensity. ** p<0.01,***p<0.001 (ANOVA) (mean and SEM, n = 3).
Fig 4
Fig 4. Increased cytoplasmic localization of hTDP-43 in flies expressing mutant hTDP-43.
A. Widespread expression of hTDP-43 in adult brain. Adult brains were fixed and stained with an anti-FLAG (FLAG) antiserum to label FLAG-hTDP-43 (A’) and DAPI to label nuclei (A). Merged images are shown in the third column (A”). The boxed area indicates the region shown at higher magnification in B-D. B-D. Higher magnification images from flies expressing wild type hTDP-43 (B), hTDP-43 G294A (C) and hTDP-43 M337V (D). For both mutant lines there is an increase in FLAG-positive puncta observed in areas that are DAPI negative (arrows in C’ and D’). E. Quantification of the non-nuclear hTDP-43 in adult brain. Cytoplasmic FLAG fluorescence was normalized to the total FLAG fluorescence, and over 100 neurons were quantified for individual prep. As the result the cytoplasmic FLAG is significantly elevated in flies expressing hTDP-43 G294A and M337V. (ANOVA, *** p<0.0005,****p<0.0001, n = 8). Scale bar is 50 μm in A and 2μm in B.
Fig 5
Fig 5. Global phosphorylation of hTDP-43 and increased ubiquitin puncta in neurons in flies expressing hTDP-43 M337V.
Adult brains of flies expressing wild type (A) and mutant hTDP-43 (B&C) were fixed and double stained with anti-phospho (409/410)TDP (green) and an anti-ubiquitin linkage K48 (magenta) antiserum to label ubiquitin (A’, B’ and C’) and DAPI to label nuclei (blue). Merged images are shown in the third column. A. No significant signal was detected in either phospho-TDP or the Ub-K48 channels in flies expressing wild type hTDP-43. B. Flies expressing hTDP-43 G294A showed no significant signal in either phospho-TDP or the Ub-K48 channels. Occasionally, cytoplasmic puncta was double labeled with phospho-TDP and Ub-K48. C. Representative images from flies expressing hTDP-43 M337V showing global phospho-TDP staining to all the neurons and intense ubiquitin staining in the cytoplasm (DAPI negative). D&E. Quantification of the pTDP and Ub-K48 signal in adult brains. D. Quantification of phosphorylated TDP signal in the adult brains. E. Quantification of the Ub-K48 signal in adult brains. (ANOVA, *p<0.05,**** p<0.0001, n = 8–9). Scale bar is 50 μm in A and 2μm in B. Scale bar is 5μm.
Fig 6
Fig 6. Flies that expressed mutant versions of hTDP-43 show no major phenotypes.
A&B. Time of development. There were no significant differences in the median time taken between egg laying and eclosion between any of the lines for either male (A) or female (B) flies. Each point represents the mean ± SEM of at least 200 flies for each genotype. C&D. Life span. The life span of male (C) and female (D) flies were determined and showed that expression of mutant hTDP-43 did not lead to a reduced life span. For males, flies expressing hTDP-M337V had a slightly longer life span and there were no differences in the life span in female flies for any genotype. Each line represents the survival curves for between 150 and 200 flies with the error bars representing the standard error. Data was analyzed using a Mantel-Cox log rank test. E &F. Fecundity. Single virgin male and female flies were placed in a vial and allowed to mate and lay eggs for one week and the total number of progeny recorded. E. Results represent three separate experiments with males and females of the same genotype in each vial. The number of progeny from each pair was normalized to the mean number of progeny for the control flies in that experiment. Each point represents the number of progeny from a single pair of flies and the lines represent the mean and SEM for between 40 and 60 pairs of flies. Both lines expressing mutant hTDP-43 generated significantly fewer progeny than either control flies or flies expressing wild type hTDP-43, * p<0.05; *** p<0.001; ANOVA followed by Holm-Sidak multiple comparison test. F. Fecundity of males compared to females. Individual males of each genotype were crossed with individual females of each genotype and the total progeny of each pair were then pooled based on the sex and genotype of the parent. The data represents the mean and SEM for between 30 and 35 pairs of flies. There were no significant differences in the number of progeny between the males of each genotype, whereas female flies expressing either mutant hTDP-43 produced significantly fewer offspring. *** p<0.001; two way ANOVA followed by Sidaks multiple comparison test.
Fig 7
Fig 7. The hTDP-43 mutant flies show minor behavioral defects.
A. Larval locomotion. The total distance third instar larvae crawled for 5 minutes on agar plate was quantified. There were no significant difference among hTDP-43 WT, hTDP-43 G294A, hTDP-43 M337V and control larvae (ANOVA, n = 21–30). B. Adult hourly activity. The activity pattern of individual flies was tracked using an activity recorder and no significant differences were observed for any genotype (mean ± SEM, n = 18–25 flies). C. Adult daily activity. The total activity for each fly was summed for each 24hr period and monitored for 6 days. There was no significant difference between control flies and flies expressing wild type hTDP-43, whereas flies expressing hTDP-43 G294A showed significantly higher levels of activity and flies expressing hTDP-43 M337V had significantly lower levels of activity compared to flies expressing wild type hTDP-43. Two way ANOVA followed by Dunnett’s multiple comparison test. Each point represents mean ± SEM n = 25–35 flies. D. Adult negative geotaxis. The ability of flies to climb to the top of a tube was determined as described in the methods section. There was no significant difference in the performance index of control flies and flies expressing wild type hTDP-43. The climbing indexes of hTDP-43 G294A and M337V flies were gradually reduced by time compared to that of flies expressing wild type hTDP-43. Two way ANOVA followed by Dunnett’s multiple comparison test. Each point represents mean ± SEM n = 3–20.

References

    1. Heemels MT. Neurodegenerative diseases. Nature. 2016;539(7628):179 Epub 2016/11/11. doi: 10.1038/539179a . - DOI - PubMed
    1. Arai T, Hasegawa M, Akiyama H, Ikeda K, Nonaka T, Mori H, et al. TDP-43 is a component of ubiquitin-positive tau-negative inclusions in frontotemporal lobar degeneration and amyotrophic lateral sclerosis. Biochemical and biophysical research communications. 2006;351(3):602–11. doi: 10.1016/j.bbrc.2006.10.093 . - DOI - PubMed
    1. Neumann M, Sampathu DM, Kwong LK, Truax AC, Micsenyi MC, Chou TT, et al. Ubiquitinated TDP-43 in frontotemporal lobar degeneration and amyotrophic lateral sclerosis. Science. 2006;314(5796):130–3. doi: 10.1126/science.1134108 . - DOI - PubMed
    1. Banks GT, Kuta A, Isaacs AM, Fisher EM. TDP-43 is a culprit in human neurodegeneration, and not just an innocent bystander. Mammalian genome: official journal of the International Mammalian Genome Society. 2008;19(5):299–305. Epub 2008/07/02. doi: 10.1007/s00335-008-9117-x . - DOI - PMC - PubMed
    1. Geser F, Martinez-Lage M, Robinson J, Uryu K, Neumann M, Brandmeir NJ, et al. Clinical and pathological continuum of multisystem TDP-43 proteinopathies. Archives of neurology. 2009;66(2):180–9. Epub 2009/02/11. doi: 10.1001/archneurol.2008.558 . - DOI - PMC - PubMed

MeSH terms

LinkOut - more resources