

Defining and characterizing the critical transition state prior to the type 2 diabetes disease
- PMID: 28686739
- PMCID: PMC5501620
- DOI: 10.1371/journal.pone.0180937
Defining and characterizing the critical transition state prior to the type 2 diabetes disease
Abstract
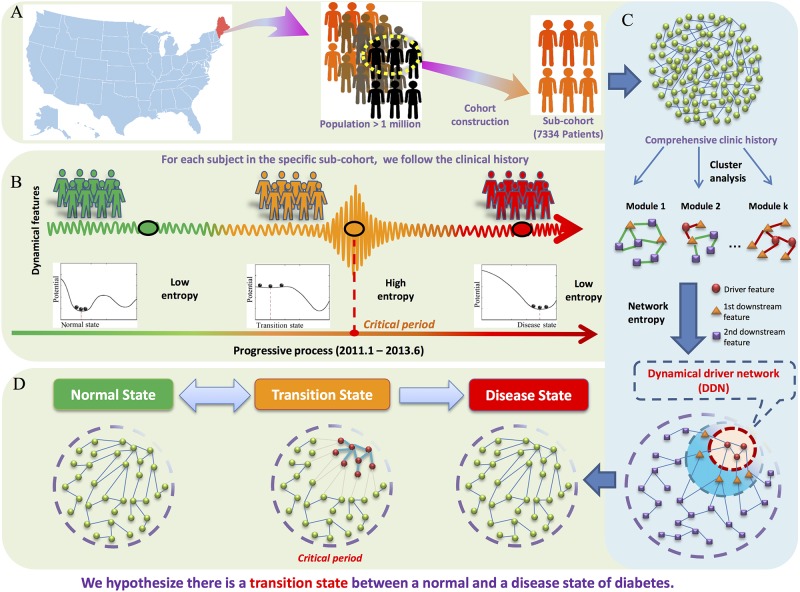
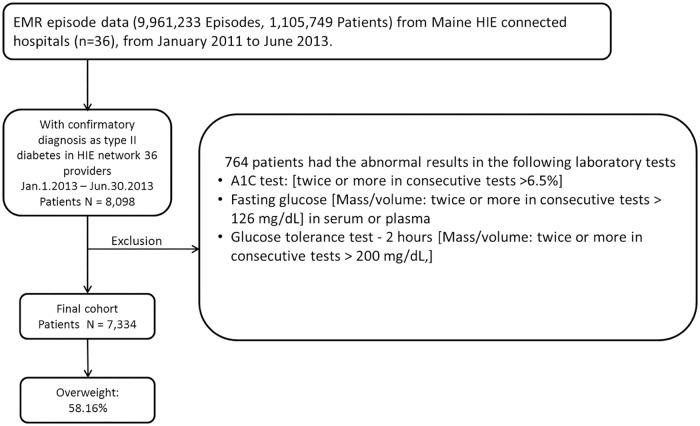
Background: Type 2 diabetes mellitus (T2DM), with increased risk of serious long-term complications, currently represents 8.3% of the adult population. We hypothesized that a critical transition state prior to the new onset T2DM can be revealed through the longitudinal electronic medical record (EMR) analysis.
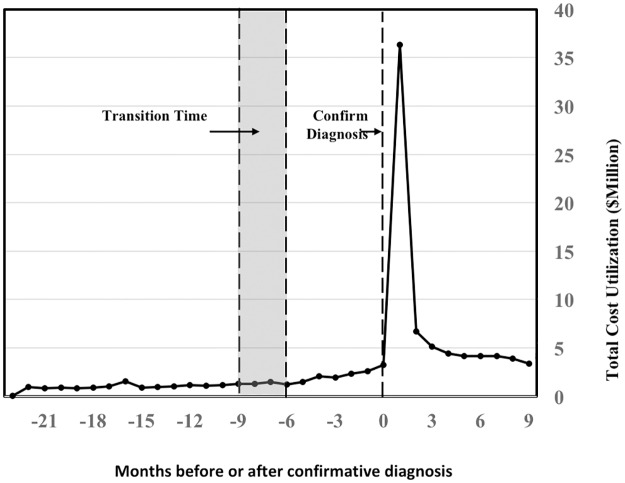
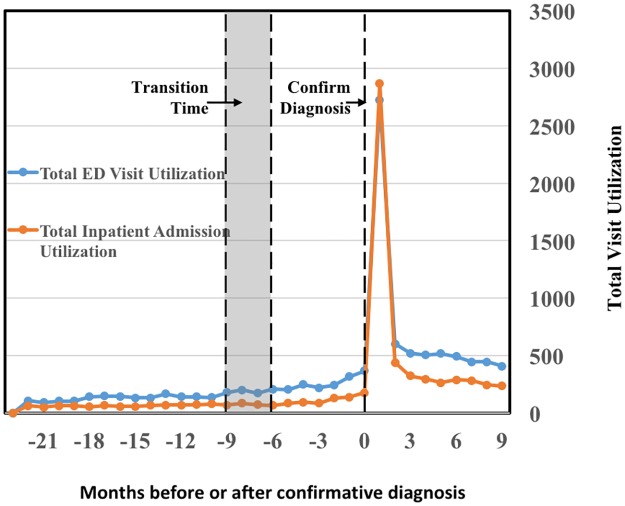
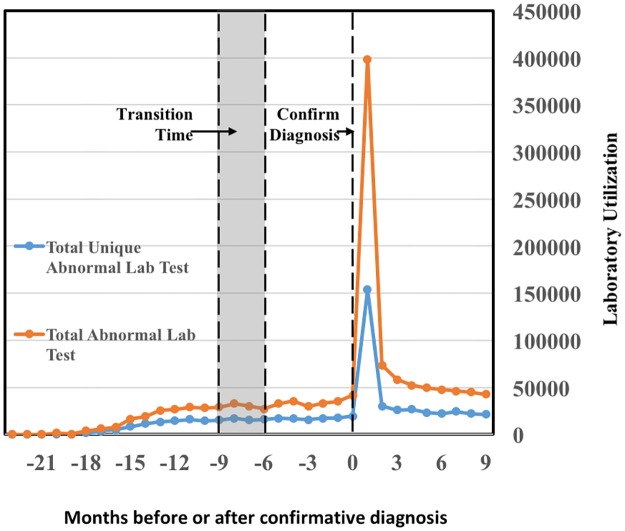
Method: We applied the transition-based network entropy methodology which previously identified a dynamic driver network (DDN) underlying the critical T2DM transition at the tissue molecular biological level. To profile pre-disease phenotypical changes that indicated a critical transition state, a cohort of 7,334 patients was assembled from the Maine State Health Information Exchange (HIE). These patients all had their first confirmative diagnosis of T2DM between January 1, 2013 and June 30, 2013. The cohort's EMRs from the 24 months preceding their date of first T2DM diagnosis were extracted.
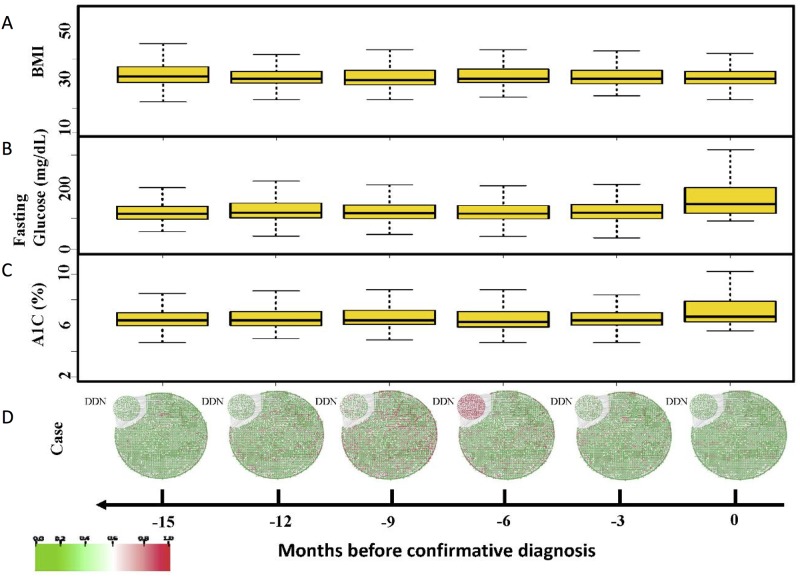
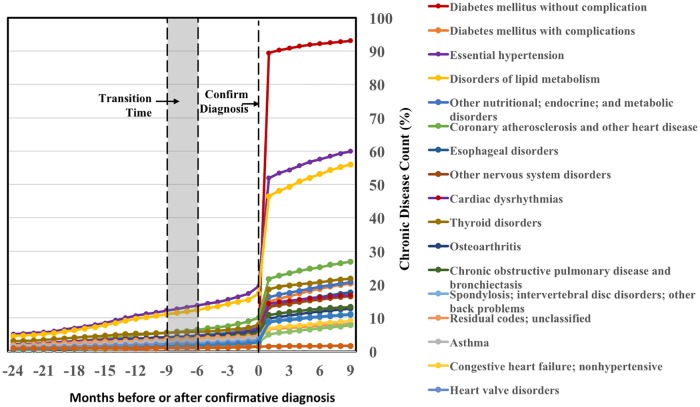
Results: Analysis of these patients' pre-disease clinical history identified a dynamic driver network (DDN) and an associated critical transition state six months prior to their first confirmative T2DM state.
Conclusions: This 6-month window before the disease state provides an early warning of the impending T2DM, warranting an opportunity to apply proactive interventions to prevent or delay the new onset of T2DM.
Conflict of interest statement
Figures
Similar articles
-
The Longitudinal Epidemiologic Assessment of Diabetes Risk (LEADR): Unique 1.4 M patient Electronic Health Record cohort.Healthc (Amst). 2020 Dec;8(4):100458. doi: 10.1016/j.hjdsi.2020.100458. Epub 2020 Oct 1. Healthc (Amst). 2020. PMID: 33011645 Free PMC article.
-
Detecting tissue-specific early warning signals for complex diseases based on dynamical network biomarkers: study of type 2 diabetes by cross-tissue analysis.Brief Bioinform. 2014 Mar;15(2):229-43. doi: 10.1093/bib/bbt027. Epub 2013 Apr 25. Brief Bioinform. 2014. PMID: 23620135
-
The Diagnostic Value of Whole Blood lncRNA ENST00000550337.1 for Pre-Diabetes and Type 2 Diabetes Mellitus.Exp Clin Endocrinol Diabetes. 2017 Jun;125(6):377-383. doi: 10.1055/s-0043-100018. Epub 2017 Apr 13. Exp Clin Endocrinol Diabetes. 2017. PMID: 28407663 Clinical Trial.
-
[Phenotypes of prediabetes and type 2 diabetes].Dtsch Med Wochenschr. 2014 May;139(21):1109-13. doi: 10.1055/s-0034-1370076. Epub 2014 May 13. Dtsch Med Wochenschr. 2014. PMID: 24823979 Review. German.
-
[Limitations of the diagnostic criteria for type 2 diabetes and glucose intolerance].Rev Invest Clin. 2000 Mar-Apr;52(2):177-84. Rev Invest Clin. 2000. PMID: 10846442 Review. Spanish.
Cited by
-
Identification of Prediabetes Discussions in Unstructured Clinical Documentation: Validation of a Natural Language Processing Algorithm.JMIR Med Inform. 2022 Feb 24;10(2):e29803. doi: 10.2196/29803. JMIR Med Inform. 2022. PMID: 35200154 Free PMC article.
-
High-resolution analyses of associations between medications, microbiome, and mortality in cancer patients.Cell. 2023 Jun 8;186(12):2705-2718.e17. doi: 10.1016/j.cell.2023.05.007. Epub 2023 Jun 8. Cell. 2023. PMID: 37295406 Free PMC article.
-
Can We Reduce Mortality of COVID-19 if We do Better in Glucose Control?Med Drug Discov. 2020 Sep;7:100048. doi: 10.1016/j.medidd.2020.100048. Epub 2020 Jun 2. Med Drug Discov. 2020. PMID: 32551437 Free PMC article.
-
Single center blind testing of a US multi-center validated diagnostic algorithm for Kawasaki disease in Taiwan.Front Immunol. 2022 Oct 3;13:1031387. doi: 10.3389/fimmu.2022.1031387. eCollection 2022. Front Immunol. 2022. PMID: 36263040 Free PMC article.
-
Lipidomics of human adipose tissue reveals diversity between body areas.PLoS One. 2020 Jun 16;15(6):e0228521. doi: 10.1371/journal.pone.0228521. eCollection 2020. PLoS One. 2020. PMID: 32544198 Free PMC article.
References
-
- Organization WH. Global Report on Diabetes. Geneva. 2016.
-
- American Diabetes A. Economic costs of diabetes in the U.S. in 2012. Diabetes care. 2013;36(4):1033–46. doi: 10.2337/dc12-2625 ; - DOI - PMC - PubMed
-
- Willi C, Bodenmann P, Ghali WA, Faris PD, Cornuz J. Active smoking and the risk of type 2 diabetes: a systematic review and meta-analysis. JAMA: the journal of the American Medical Association. 2007;298(22):2654–64. doi: 10.1001/jama.298.22.2654 . - DOI - PubMed
-
- Kyu HH, Bachman VF, Alexander LT, Mumford JE, Afshin A, Estep K, et al. Physical activity and risk of breast cancer, colon cancer, diabetes, ischemic heart disease, and ischemic stroke events: systematic review and dose-response meta-analysis for the Global Burden of Disease Study 2013. BMJ. 2016;354:i3857 doi: 10.1136/bmj.i3857 ; - DOI - PMC - PubMed
-
- Schellenberg ES, Dryden DM, Vandermeer B, Ha C, Korownyk C. Lifestyle interventions for patients with and at risk for type 2 diabetes: a systematic review and meta-analysis. Ann Intern Med. 2013;159(8):543–51. doi: 10.7326/0003-4819-159-8-201310150-00007 . - DOI - PubMed
MeSH terms
LinkOut - more resources
Full Text Sources
Other Literature Sources
Medical
