. 2017 Jul 6;21(1):78-90.e6.
doi: 10.1016/j.stem.2017.06.014.

Intestinal Enteroendocrine Lineage Cells Possess Homeostatic and Injury-Inducible Stem Cell Activity

Affiliations

Intestinal Enteroendocrine Lineage Cells Possess Homeostatic and Injury-Inducible Stem Cell Activity

Kelley S Yan et al. Cell Stem Cell. .

Abstract

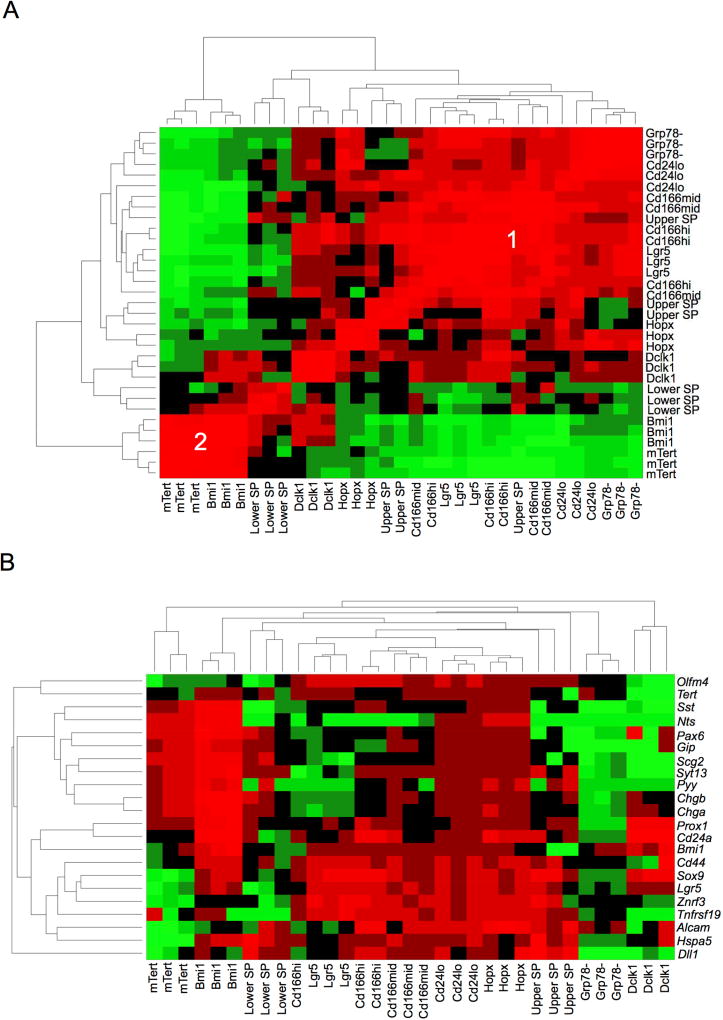
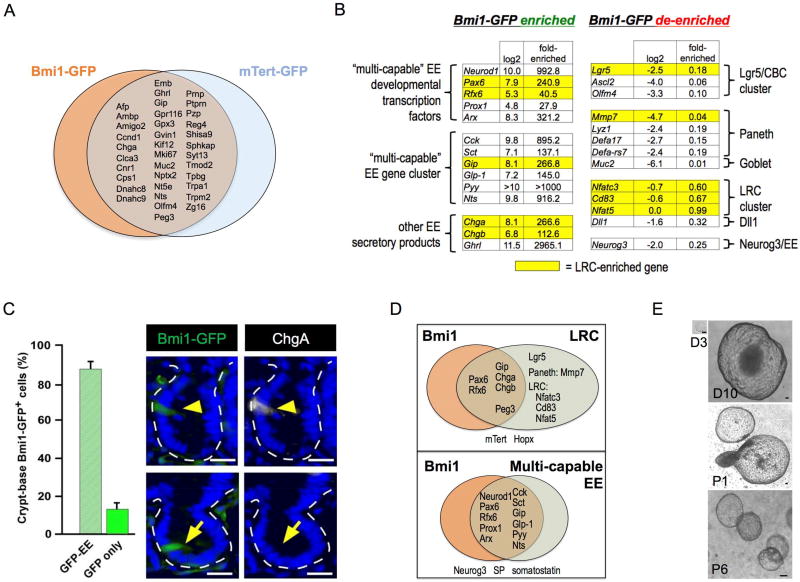
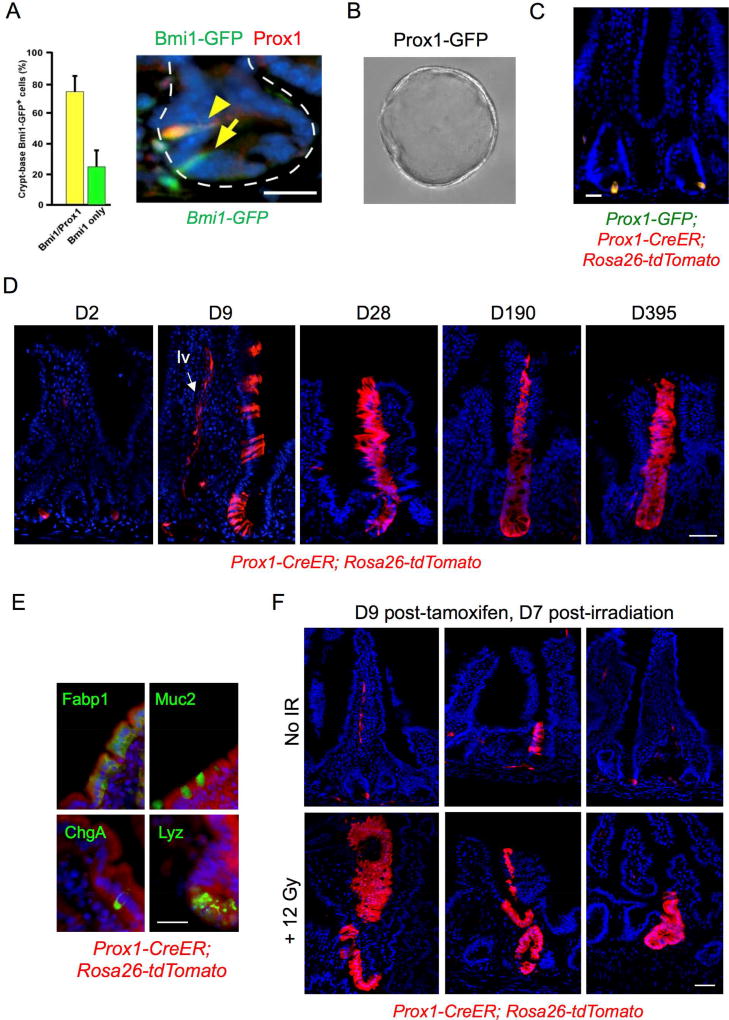
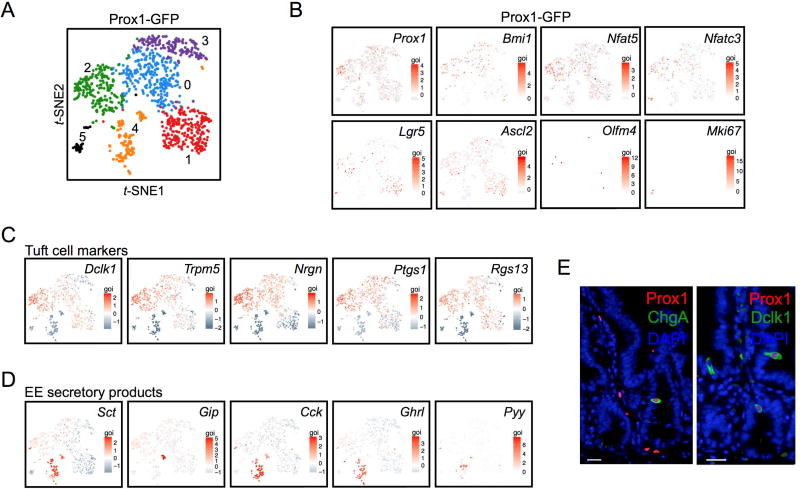
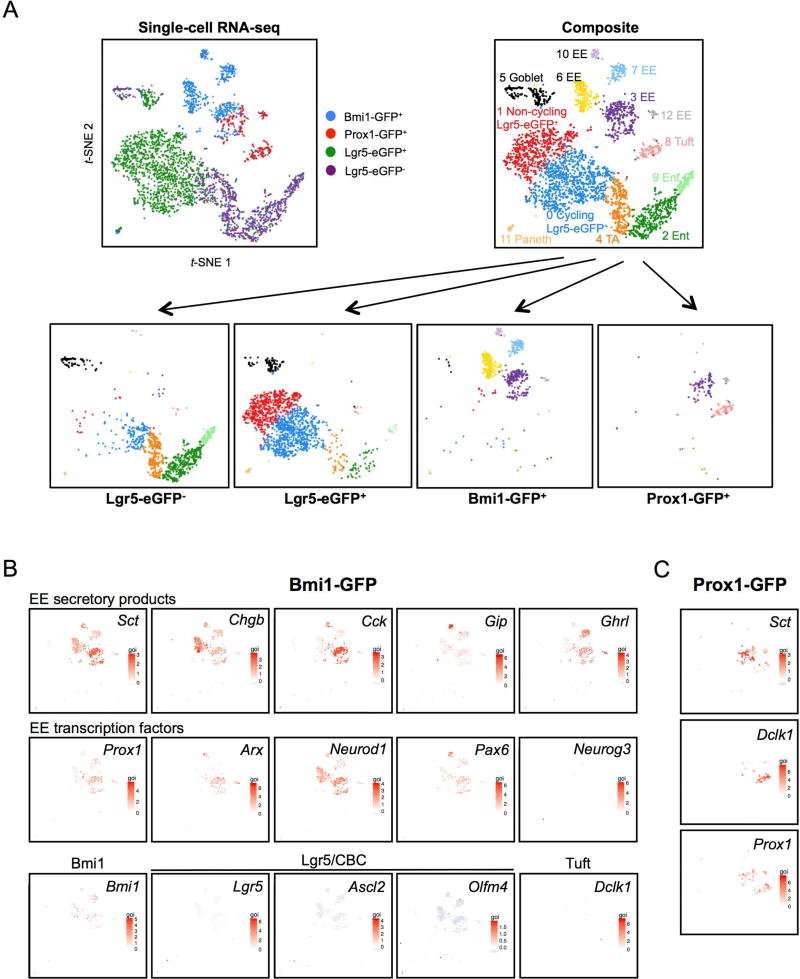
Several cell populations have been reported to possess intestinal stem cell (ISC) activity during homeostasis and injury-induced regeneration. Here, we explored inter-relationships between putative mouse ISC populations by comparative RNA-sequencing (RNA-seq). The transcriptomes of multiple cycling ISC populations closely resembled Lgr5+ ISCs, the most well-defined ISC pool, but Bmi1-GFP+ cells were distinct and enriched for enteroendocrine (EE) markers, including Prox1. Prox1-GFP+ cells exhibited sustained clonogenic growth in vitro, and lineage-tracing of Prox1+ cells revealed long-lived clones during homeostasis and after radiation-induced injury in vivo. Single-cell mRNA-seq revealed two subsets of Prox1-GFP+ cells, one of which resembled mature EE cells while the other displayed low-level EE gene expression but co-expressed tuft cell markers, Lgr5 and Ascl2, reminiscent of label-retaining secretory progenitors. Our data suggest that the EE lineage, including mature EE cells, comprises a reservoir of homeostatic and injury-inducible ISCs, extending our understanding of cellular plasticity and stemness.


Figures

Figure 1
Figure 1. Hierarchical clustering of ISC populations by bulk cell mRNA-seq
A. Unsupervised hierarchical clustering reveals the association of Lgr5hi, Cd166+, Cd24lo, upper SP and Grp78 cells into Cluster 1. Bmi1-GFP+ and mTert-GFP+ cells are present in Cluster 2, while Hopx+, Dclk1+ and lower SP cells exhibit intermediate features between Clusters 1 and 2. B. Supervised hierarchical analysis demonstrating enrichment of an Lgr5hi/CBC gene signature amongst Cluster 1 populations.
Figure 2
Figure 2. Characterization of the Bmi1/mTert ISC cluster
A. Venn diagram of overlapping gene enrichment between Bmi1-GFP+ and mTert-GFP+ cells. B. Enteroendocrine gene signature in Bmi1-GFP+ cells includes numerous EE secretory factors and EE transcription factors (Neurod1, Arx, Prox1) but notably lacks Neurog3. C. Anti-ChgA (white) immunofluorescence co-localization in intestinal crypts is found in 89.9% of crypt Bmi1-GFP cells (anti-GFP, green). Bar = 25 µm. Error bars indicate mean ± s.e.m. D. Overlap between genes enriched in Bmi1-GFP+, LRC and multi-capable EE. E. Clonogenic enteroid culture of FACS-isolated Bmi1-GFP+ cells validating their clonogenic potential ex vivo. D = day, P = passage number. Bar = 100 µm.
Figure 3
Figure 3. Functional similarities between Bmi1-GFP+ and Prox1+ cells in vivo
A. Co-localization of Prox1 expression in 74.4% of Bmi1-GFP+ crypt cells by immunofluorescence, Bmi1-GFP (anti-GFP, green) and anti-Prox1 (red). Bar = 25 µm. Error bars indicate mean ± s.e.m. B. Clonogenic enteroid growth ex vivo from Prox1-GFP+ cells isolated from proximal jejunum, day 5. 20× magnification. C. Short-term (36h) in vivo tamoxifen-induced labeling of Prox1+ cells in jejunum of Prox1-GFP; Prox1-CreER; Rosa26 tdTomato mice marks crypt epithelial cells. Bar = 20 µm. D. Persistent lineage tracing in jejunum from a subset of crypt-based Prox1+ cells in tamoxifen-treated Prox1-CreER; Rosa26 tdTomato mice, 9 to 365 days after tamoxifen treatment. Lineage tracing was observed in approximately 1/150 crypts. Labeling was also observed in lymphatic vessels (“lv”, arrow) consistent with the known expression of Prox1 in lacteals and in ~10% of villi. Bar = 50 µm. E. Multi-potency of Prox1-expressing cells. Differentiation markers were detected by IF within Prox1 lineage stripes, with Fabp1 for enterocytes, Muc2 for goblet cells, ChgA for EE cells and Lyz for Paneth cells. Bar = 20 µm. F. Injury-inducibility of Prox1+ lineage traces in tamoxifen-treated Prox1-CreER; Rosa26 tdTomato mice. Tamoxifen was administered 2 days prior to delivery of 12 Gy whole body irradiation, followed by tissue harvest after an additional 7 days. Bar = 50 µm.
Figure 4
Figure 4. Single-cell transcriptomics of Prox1-GFP+ cells
A. t-SNE projection of 1,051 Prox1-GFP+ cells colored by clustering. B. Expression of key genes including Prox1 and markers of stem/progenitor cells. Lgr5, Ascl2 and Olfm4 represent canonical CBC markers whereas Nfat5, Nfatc3 and Cd83 are LRC/secretory progenitor makers. C. Tuft cell marker expression among the Prox1-GFP+ clusters. D. EE marker expression among the Prox1-GFP+ clusters. E. Immunofluorescence validation of EE (ChgA) and tuft (Dclk1) marker expression in Prox1+ cells. Bar = 20 µm.
Figure 5
Figure 5. Direct comparison of Prox1-GFP+, Bmi1-GFP+ and Lgr5-eGFP+ cells at single-cell resolution
A. (Top left) Composite t-SNE projection of 1,607 Lgr5-eGFP+, 658 crypt Bmi1-GFP+, 246 crypt Prox1-GFP+ and 1,010 Lgr5-eGFP(−) cells color-coded by FACS-isolated sample. (Top right) Composite t-SNE plot reveals 13 distinct clusters identified by their gene expression. (Bottom) Deconvolution of the cells into their four individual component samples. All five EE clusters visualized by t-SNE represent Bmi1-GFP+ cells (Clusters 3, 6, 7, 10, 12) are globally distinct from Lgr5-eGFP+ cells. B. Bmi1-GFP+ cells express EE genes at the single-cell level. Gene expression heatmaps overlaid on t-SNE plot of crypt Bmi1-GFP+ cells. All five EE clusters representing Bmi1-GFP+ cells express various EE secretory products or EE cell fate determination transcription factors. Bmi1-GFP+ cells (>92%) express EE hormone and transcription factor mRNAs consistent with EE cell identity but lack Lgr5+ ISC signature, secretory progenitor and other lineage marker genes.
Figure 6
Figure 6. SPADE single-cell gene expression lineage hierarchy analysis reveals relationship of Prox1-GFP and Bmi1-GFP cell clusters
A. SPADE lineage hierarchy reconstruction of the intestinal epithelium determined for all cells for the annotated 13 lineages by clustering analysis and t-SNE projection of scRNA-seq data. Cells on the same or neighboring branches are expected to be more hierarchically related compared to cells on different branches in a given tree. A. Hierarchical relationships between the 13 clusters colored by cluster identity. B. Hierarchical relationships colored by sample type. Notably, Bmi1-GFP+ cells mark clusters at the distal branches of the EE lineage whereas Prox1-GFP+ cells mark the tuft lineage and more proximal branches of the EE lineage.

References

    1. Anchang B, Hart TD, Bendall SC, Qiu P, Bjornson Z, Linderman M, Nolan GP, Plevritis SK. Visualization and cellular hierarchy inference of single-cell data using SPADE. Nature protocols. 2016;11:1264–1279. - PubMed
    1. Barker N, van Es JH, Kuipers J, Kujala P, van den Born M, Cozijnsen M, Haegebarth A, Korving J, Begthel H, Peters PJ, et al. Identification of stem cells in small intestine and colon by marker gene Lgr5. Nature. 2007;7165;449:1003–1007. - PubMed
    1. Barriga FM, Montagni E, Mana M, Mendez-Lago M, Hernando-Momblona X, Sevillano M, Guillaumet-Adkins A, Rodriguez-Esteban G, Buczacki SJ, Gut M, et al. Mex3a Marks a Slowly Dividing Subpopulation of Lgr5+ Intestinal Stem Cells. Cell stem cell 2017 - PMC - PubMed
    1. Beucher A, Gjernes E, Collin C, Courtney M, Meunier A, Collombat P, Gradwohl G. The homeodomain-containing transcription factors Arx and Pax4 control enteroendocrine subtype specification in mice. PLoS One. 2012;7:e36449. - PMC - PubMed
    1. Bezencon C, Furholz A, Raymond F, Mansourian R, Metairon S, Le Coutre J, Damak S. Murine intestinal cells expressing Trpm5 are mostly brush cells and express markers of neuronal and inflammatory cells. The Journal of comparative neurology. 2008;509:514–525. - PubMed

Publication types

Substances