. 2017 Sep 5:627:412-419.
doi: 10.1016/j.gene.2017.07.002. Epub 2017 Jul 4.

A global evolutionary and metabolic analysis of human obesity gene risk variants

Affiliations

A global evolutionary and metabolic analysis of human obesity gene risk variants

Joseph J Castillo et al. Gene. .

Abstract

It is generally accepted that the selection of gene variants during human evolution optimized energy metabolism that now interacts with our obesogenic environment to increase the prevalence of obesity. The purpose of this study was to perform a global evolutionary and metabolic analysis of human obesity gene risk variants (110 human obesity genes with 127 nearest gene risk variants) identified using genome-wide association studies (GWAS) to enhance our knowledge of early and late genotypes. As a result of determining the mean frequency of these obesity gene risk variants in 13 available populations from around the world our results provide evidence for the early selection of ancestral risk variants (defined as selection before migration from Africa) and late selection of derived risk variants (defined as selection after migration from Africa). Our results also provide novel information for association of these obesity genes or encoded proteins with diverse metabolic pathways and other human diseases. The overall results indicate a significant differential evolutionary pattern for the selection of obesity gene ancestral and derived risk variants proposed to optimize energy metabolism in varying global environments and complex association with metabolic pathways and other human diseases. These results are consistent with obesity genes that encode proteins possessing a fundamental role in maintaining energy metabolism and survival during the course of human evolution.

Keywords: Environment; Evolution; Metabolism; Obesity; Variants.


Conflict of interest statement

Conflict of interest

The authors declare no conflict of interest.

Figures

Fig. 1
Fig. 1
Chromosomal ideogram of human obesity genes. The chromosomal loci for the 110 obesity genes are provided using a chromosomal ideogram. The obesity genes with ancestral risk variants are localized adjacent to chromosomal loci denoted by gray arrowheads, whereas the obesity genes with derived risk variants are localized adjacent to chromosomal loci denoted with black arrowheads.
Fig. 2
Fig. 2
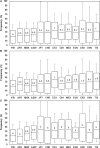
Obesity gene ancestral risk variant frequencies. Box and whisker plots represent the mean frequency, standard deviation, and range of obesity gene ancestral risk variant frequencies in 13 available populations. The middle horizontal lines within boxes represent the mean frequency, boxes represent plus and minus one standard deviation, and the whiskers represent the range. A significant difference for the mean frequency of a population is indicated by different lower case letters. (A) Total obesity gene ancestral risk variant frequencies (64 variants), (B) genic obesity gene ancestral risk variant frequencies (41 variants), and (C) nongenic obesity ancestral risk variant frequencies (23 variants) are provided. The abbreviations for 13 populations are as follows: YRI, Yoruba in Ibadan, Nigeria (Sub-Saharan African); AFR, African American descent from the Coriell Cell Repository; MKK, Maasai in Kinyawa, Kenya; ASW, African ancestry in Southwest USA; JPT, Japanese in Tokyo, Japan; CHB, Han Chinese in Beijing; CEU, Northern and Western European ancestry in Utah; GIH, Gujarati Indians in Houston, Texas; MEX, Mexican ancestry in Los Angeles, California; EUR, European American; CHD, Chinese ancestry in Denver, Colorado; CHN, Chinese American descent from the Coriell Cell Repository; and TSI, Tuscans in Italy.
Fig. 3
Fig. 3
Obesity gene derived risk variant frequencies. Box and whisker plots represent the mean frequency, standard deviation, and range of obesity gene ancestral risk variant frequencies in 13 available populations. The middle horizontal lines within boxes represent the mean frequency, boxes represent plus and minus one standard deviation, and the whiskers represent the range. A significant difference for the mean frequency of a population is indicated by different lower case letters. (A) Total obesity gene derived risk variant frequencies (63 variants), (B) genic obesity gene derived risk variant frequencies (42 variants), and (C) nongenic obesity derived risk variant frequencies (21 variants) are provided. The abbreviations for 13 populations are as follows: YRI, Yoruba in Ibadan, Nigeria (Sub-Saharan African); AFR, African American descent from the Coriell Cell Repository; MKK, Maasai in Kinyawa, Kenya; ASW, African ancestry in Southwest USA; JPT, Japanese in Tokyo, Japan; CHB, Han Chinese in Beijing; CEU, Northern and Western European ancestry in Utah; GIH, Gujarati Indians in Houston, Texas; MEX, Mexican ancestry in Los Angeles, California; EUR, European American; CHD, Chinese ancestry in Denver, Colorado; CHN, Chinese American descent from the Coriell Cell Repository; and TSI, Tuscans in Italy.
Fig. 4
Fig. 4
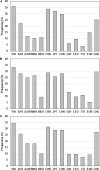
Genetic variation among populations. Bar graph representing the frequency in percent of variants with a greater than 50% difference from the average obesity gene variants’ frequency: (A) Ancestral obesity gene variants, (B) derived obesity gene variants, and (C) combined obesity gene variants. The abbreviations for 13 populations are as follows: YRI, Yoruba in Ibadan, Nigeria (Sub-Saharan African); AFR, African American descent; MKK, Maasai in Kinyawa, Kenya; ASW, African ancestry in Southwest USA; JPT, Japanese in Tokyo, Japan; CHB, Han Chinese in Beijing; CEU, Northern and Western European ancestry in Utah; GIH, Gujarati Indians in Houston, Texas; MEX, Mexican ancestry in Los Angeles, California; EUR, European American; CHD, Chinese ancestry in Denver, Colorado; CHN, Chinese American descent; and TSI, Tuscans in Italy.

References

    1. Abadi A, et al. Assessing the effects of 35 European-derived BMI-associated SNPs in Mexican Children. Obesity. 2016;24:1989–1995. - PubMed
    1. Ahmad S, et al. Physical activity, smoking, and genetic predisposition to obesity in people from Pakistan: the PROMIS study. BMC Med Genet. 2015;16:114. - PMC - PubMed
    1. Alves R, Ghaleil RAG, Stern JS. Evolution of enzymes in metabolism: A network perspective. J Mol Biol. 2002;320:751–770. - PubMed
    1. Berndt SI, et al. Genome-wide meta-analysis identifies 11 new loci for anthropometric traits and provides insights into genetic architecture. Nat Genet. 2013;45:501–512. - PMC - PubMed
    1. Bian L, et al. MAP2K3 is associated with body mass index in American Indians and Caucasians and may mediate hypothalmic inflammation. Hum Mol Genet. 2013;22:4438–4449. - PMC - PubMed