. 2017 Nov;31(11):4734-4744.
doi: 10.1096/fj.201700197RR. Epub 2017 Jul 7.

Regulator of G-protein signaling Gβ5-R7 is a crucial activator of muscarinic M3 receptor-stimulated insulin secretion

Affiliations

Regulator of G-protein signaling Gβ5-R7 is a crucial activator of muscarinic M3 receptor-stimulated insulin secretion

Qiang Wang et al. FASEB J. 2017 Nov.

Abstract

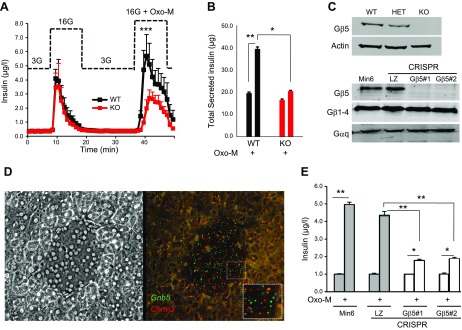
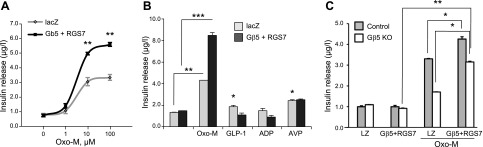
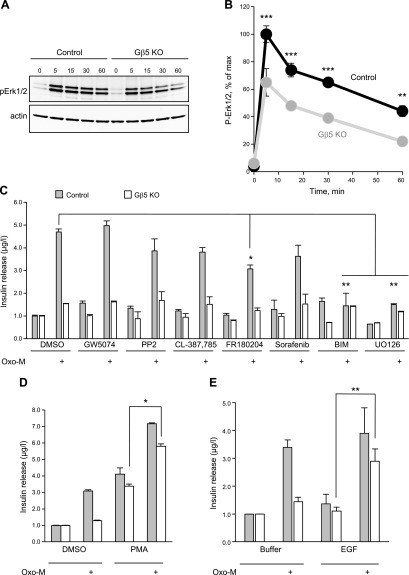
In pancreatic β cells, muscarinic cholinergic receptor M3 (M3R) stimulates glucose-induced secretion of insulin. Regulator of G-protein signaling (RGS) proteins are critical modulators of GPCR activity, yet their role in β cells remains largely unknown. R7 subfamily RGS proteins are stabilized by the G-protein subunit Gβ5, such that the knockout of the Gnb5 gene results in degradation of all R7 subunits. We found that Gnb5 knockout in mice or in the insulin-secreting MIN6 cell line almost completely eliminates insulinotropic activity of M3R. Moreover, overexpression of Gβ5-RGS7 strongly promotes M3R-stimulated insulin secretion. Examination of this noncanonical mechanism in Gnb5-/- MIN6 cells showed that cAMP, diacylglycerol, or Ca2+ levels were not significantly affected. There was no reduction in the amplitude of free Ca2+ responses in islets from the Gnb5-/- mice, but the frequency of Ca2+ oscillations induced by cholinergic agonist was lowered by more than 30%. Ablation of Gnb5 impaired M3R-stimulated phosphorylation of ERK1/2. Stimulation of the ERK pathway in Gnb5-/- cells by epidermal growth factor restored M3R-stimulated insulin release to near normal levels. Identification of the novel role of Gβ5-R7 in insulin secretion may lead to a new therapeutic approach for improving pancreatic β-cell function.-Wang, Q., Pronin, A. N., Levay, K., Almaca, J., Fornoni, A., Caicedo, A., Slepak, V. Z. Regulator of G-protein signaling Gβ5-R7 is a crucial activator of muscarinic M3 receptor-stimulated insulin secretion.

Keywords: CRISPR-Cas9; UBO-QIC; fluorescent biosensor; islet of Langerhans; pupil sphincter.


Figures

Figure 1.
Figure 1.
Gβ5 knockout inhibits M3R-stimulated insulin secretion. Cholinergic stimulation of insulin secretion was tested in primary islets (A, B) or MIN6 cells lacking Gβ5 (E). A) Islets from Gnb5−/− (KO, red) and wild-type (WT, black) mice were perifused. After equilibration with media containing 3 mM glucose (3G), islets were challenged with 16.7 mM glucose (16G), with or without 10 μM Oxo-M. The data points are the mean ± sd of insulin concentrations measured in collected fractions from experiments on 4 independent animal cohorts (3–5 animals/genotype). ***P < 0.001 in the peak; for other data points, P < 0.05. B) Quantification of total secreted insulin (area under the curve shown in A). C) Immunoblot analysis of islets from Gnb5−/− mice (top) and CRISPR-Cas9-knockout MIN6 clones (bottom). Total cell lysates were probed for Gβ5, Gβ1, Gαq, and actin (representative of at least 2 experiments). D) In situ RNA hybridization of mouse pancreatic slices using RNAscope probes against Gnb5 (green) and Chrm3 (red) gene products was performed. Shown are phase-contrast (left) and fluorescence (right) images of a representative islet. The inset shows magnification of the fluorescent dots representing the single target mRNA molecules. E) Wild-type MIN6 cells, control CRISPR (LZ), and 2 stable clones after CRISPR-Cas9-mediated knockout of the Gnb5 gene (#1 and #2) were stimulated with 16.7 mM glucose or 16.7 mM glucose plus 100 μM Oxo-M. Data are means ± sd of insulin concentration in the supernatant from the cultured cells. *P < 0.05; **P < 0.01.
Figure 2.
Figure 2.
Overexpression of the Gβ5-RGS7 complex promotes coupling of M3R to insulin secretion in MIN6 cells. A) MIN6 cells were transfected with plasmids encoding Gβ5 and RGS7 or lacZ and stimulated with the indicated concentrations of Oxo-M in the presence of 16.7 mM glucose. Insulin in the supernatants was measured by ELISA. Data are means ± sd from 3 independent transfections, each performed in triplicate. B) Transfected MIN6 cells were incubated with 100 μM Oxo-M or 0.1 μM GLP-1, 100 μM ADP, 0.1 μM AVP, all added in the presence of 16.7 mM glucose. For GLP-1 and AVP, there was a significant increase in insulin secretion compared to control; ADP did not cause significant change. C) The Gβ5−/− MIN6 cells (clone #1) or control CRISPR cells (Gβ5 +/+) were transfected with Gβ5 and RGS7 or control (LZ) plasmid, and then stimulated with 16.7 mM glucose or 16.7 mM glucose plus 100 μM Oxo-M (n = 3). Data are means ± sd. ***P < 0.001; **P < 0.01; *P < 0.05.
Figure 3.
Figure 3.
M3R-stimulated insulin secretion and second-messenger responses in Gnb5−/− and Gnb5+/+ Min6 cells. A) Wild-type Min6 cells were cultured and treated with 20 ng/ml pertussis toxin (PTX), 0.1 μM FR, 10 μM U73122, Ca2+-free medium, or 10 μM nifedipine (Nif), and released insulin was measured after stimulation with 100 μM Oxo-M. Data are means ± sd from at least 3 independent experiments. There was no statistically significant effect of PTX. B) MIN6 cells were transduced with the cAMP sensor and imaged in a flow cell on a fluorescence microscope in real time. After 200 s, solutions of 1 μM forskolin, 100 μM Oxo-M, or 100 nM GLP-1 were added for 200 s. Shown is representative results of 3 independent experiments. C) Free Ca2+ responses to 100 μM Oxo-M in the knockout (Gβ5 KO) and control MIN6 cells were recorded by using fura-2 with microscopy. Data points are averages from the total of 100–200 cells. Shown is a representative of 3 independent experiments. D) Cells were transduced with the fluorescence sensor for DAG. Data are representative of 2 experiments. E) Effect of ionomycin (Ion) on insulin secretion from the Gnb5−/− MIN6 cells. Oxo-M (100 μM) and ionomycin (4 μM) were added in the presence of 16.7 mM glucose. Data are means ± sd from at least 3 independent experiments. *P < 0.05; **P < 0.01.
Figure 4.
Figure 4.
Gβ5 knockout impairs M3R-stimulated ERK1/2 phosphorylation in MIN6 cells. A) Gnb5+/+ (control) or knockout (Gβ5-KO) cells were stimulated with 100 μM Oxo-M for the indicated periods (minutes) and subjected to Western blot analysis with anti-phospho-ERK1/2 and anti-actin antibodies. Shown is a representative immunoblot. B) Quantitative analysis of Western blots (n = 3). Mean ± sd. At least 5 additional experiments with individual time points had a similar reduction of ERK1/2 phosphorylation in Gβ5-KO (data not shown). C) The control and knockout cells were stimulated with Oxo-M in the presence of inhibitors of protein kinases PKC (BIM, bisindolylmaleimide I), Src (GW5074 and PP2), EGFR (CL-387785), Erk1/2 (FR180204), MKK1/2 (U0126), and sorafenib (Raf and other Tyr-kinases), and insulin secretion was measured. D) The Gβ5-knockout and control MIN6 cells were stimulated with Oxo-M in the presence or absence of 100 ng/ml PMA, which was added with Oxo-M. E) Cells were treated as in D with 50 ng/ml EGF. Data in CE are means ± sd from 5 independent experiments. *P < 0.05; **P < 0.01; ***P < 0.001.
Figure 5.
Figure 5.
Effects of Gβ5 knockout on cholinergic stimulation of pancreatic islets and pupillary constrictor muscle. A) Islets from wild-type (control) and Gnb5−/− mice were loaded with fura-2. The series of 13 traces show raw data from selected regions of interest within a representative control islet. The islet was perifused with 3 mM glucose (3G) to establish a baseline, then challenged with 100 μM Oxo-M in 3G, followed up by 100 μM Oxo-M in 16 mM (high) glucose (16G) for 10 min. It was then perifused with 3G for 20 min (gap in the traces) and challenged again with 16G for 10 min. Oscillations of free Ca2+ occurred only in the presence of Oxo-M. B) Ca2+ oscillations in wild-type and Gnb5−/− islets. The data show an average of >10 areas of interest selected within 1 islet of each genotype. C) Changes in [Ca2+]i induced by Oxo-M in 3G. Each dot represents the response of 1 islet (region of interest placed around the whole islet). D) Average amplitude of Ca2+ oscillations induced by Oxo-M in 16G. E) Frequency of Ca2+ oscillations induced by Oxo-M in 16G quantified as the number of peaks per minute. C–E) Each dot represents 1 islet (3–4 mice per genotype). F) Enucleated eyes from WT and Gnb5−/− (KO) mice were incubated in HBSS and photographed 60 min after addition of 1 mM pilocarpine. G) Time-course of pilocarpine-induced pupil constriction recorded in eyes from control and Gnb5−/− mice. After stimulation, images were taken at the indicated times, and pupil diameter was measured. Data points are means ± sd from 6 independent experiments on eyes from 3 individual animals of each genotype. H) In situ RNA hybridization of a mouse eye section using probes for mRNAs encoding Gβ5 (Gnb5) and M3R (Chrm3). A representative image shows the sphincter smooth muscle, iris, lens, and lens epithelium (LE).

Similar articles

Cited by

References

    1. Moran B. M., Flatt P. R., McKillop A. M. (2016) G protein-coupled receptors: signalling and regulation by lipid agonists for improved glucose homoeostasis. Acta Diabetol. 53, 177–188 - PubMed
    1. Ruiz de Azua I., Gautam D., Jain S., Guettier J. M., Wess J. (2012) Critical metabolic roles of β-cell M3 muscarinic acetylcholine receptors. Life Sci. 91, 986–991 - PMC - PubMed
    1. Kong K. C., Tobin A. B. (2011) The role of M(3)-muscarinic receptor signaling in insulin secretion. Commun. Integr. Biol. 4, 489–491 - PMC - PubMed
    1. Selway J., Rigatti R., Storey N., Lu J., Willars G. B., Herbert T. P. (2012) Evidence that Ca2+ within the microdomain of the L-type voltage gated Ca2+ channel activates ERK in MIN6 cells in response to glucagon-like peptide-1. PLoS One 7, e33004 - PMC - PubMed
    1. Selway J. L., Moore C. E., Mistry R., John Challiss R. A., Herbert T. P. (2011) Molecular mechanisms of muscarinic acetylcholine receptor-stimulated increase in cytosolic free Ca(2+) concentration and ERK1/2 activation in the MIN6 pancreatic β-cell line. Acta Diabetol. 49, 277–289 - PMC - PubMed

MeSH terms

LinkOut - more resources