. 2017 Sep 15;77(18):5142-5157.
doi: 10.1158/0008-5472.CAN-16-2586. Epub 2017 Jul 7.

Cancer-Associated Fibroblasts Share Characteristics and Protumorigenic Activity with Mesenchymal Stromal Cells

Affiliations

Cancer-Associated Fibroblasts Share Characteristics and Protumorigenic Activity with Mesenchymal Stromal Cells

Lucia Borriello et al. Cancer Res. .

Abstract

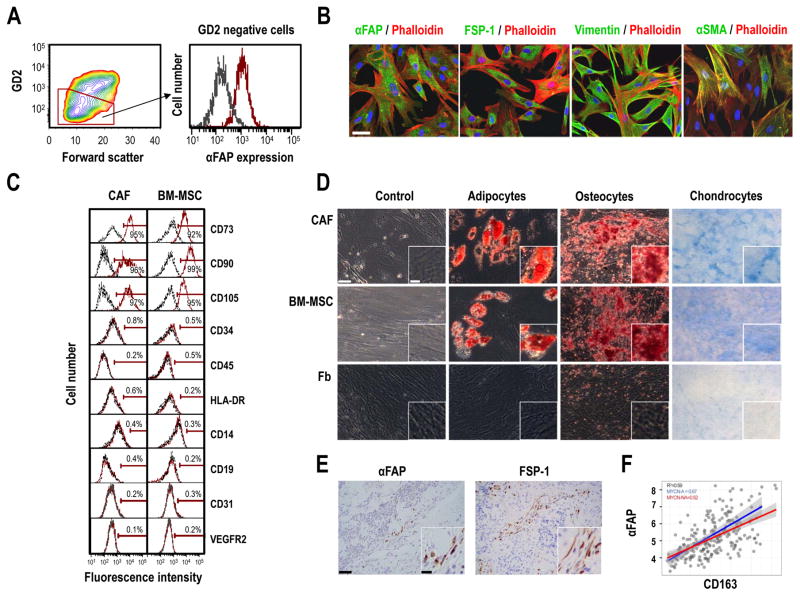
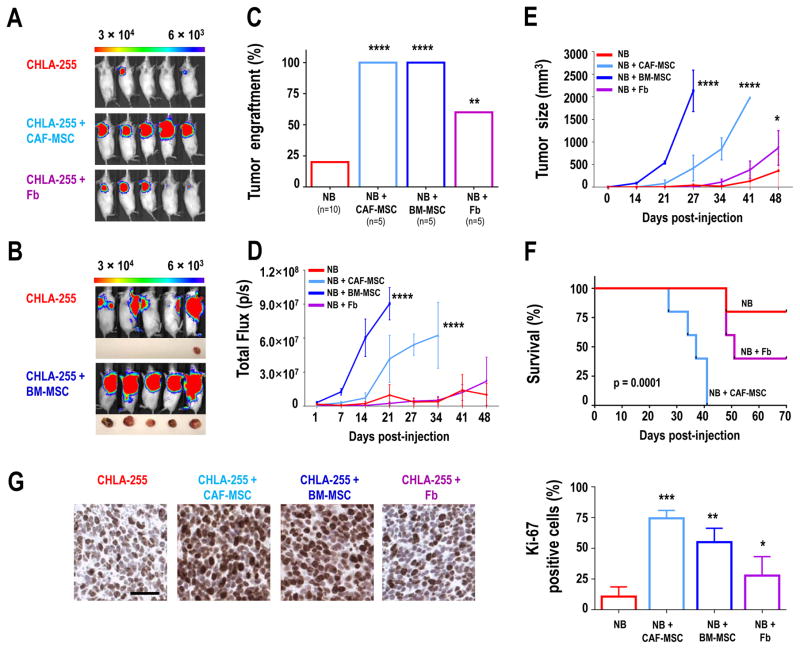
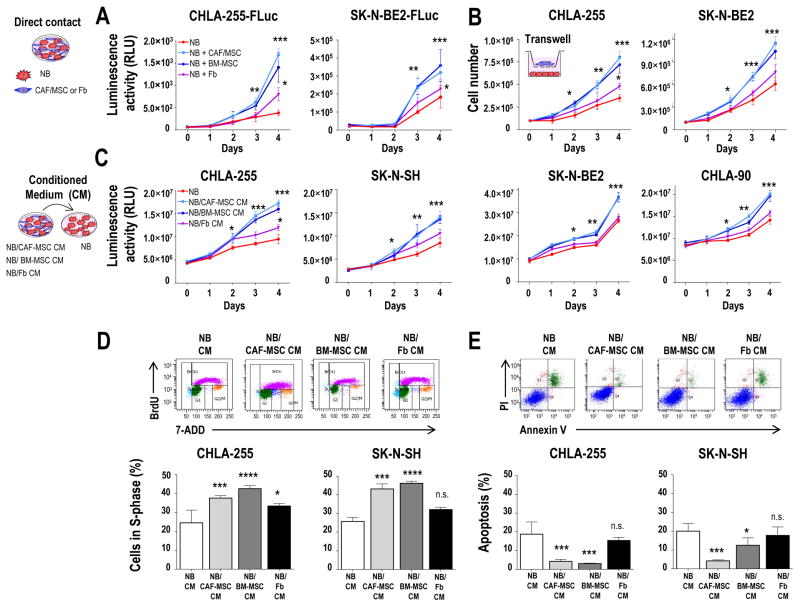
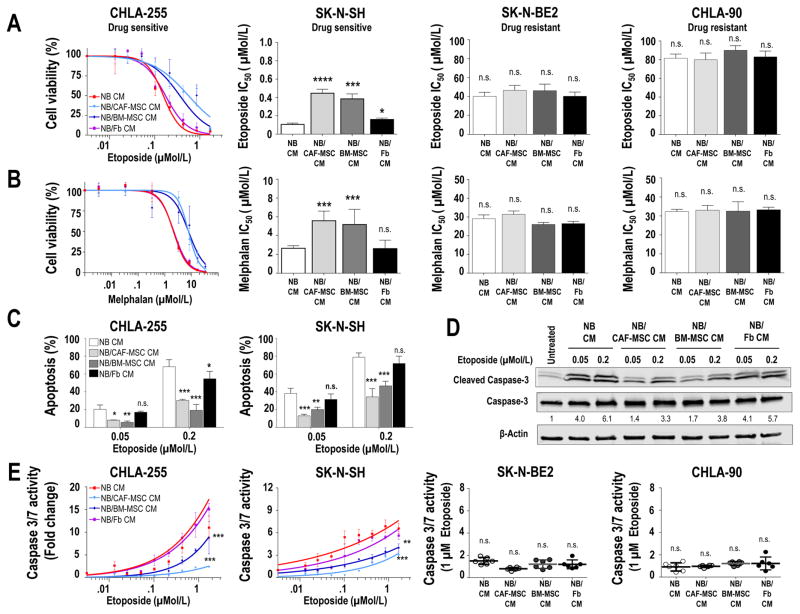
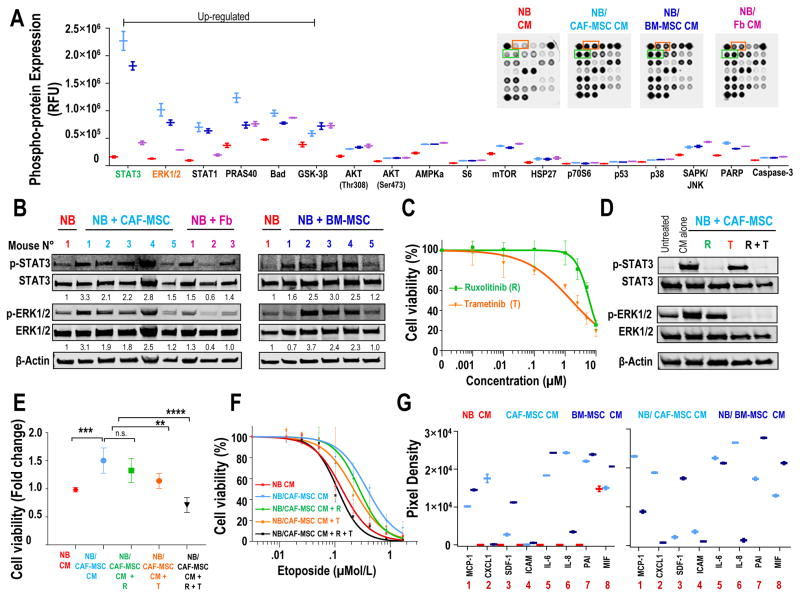
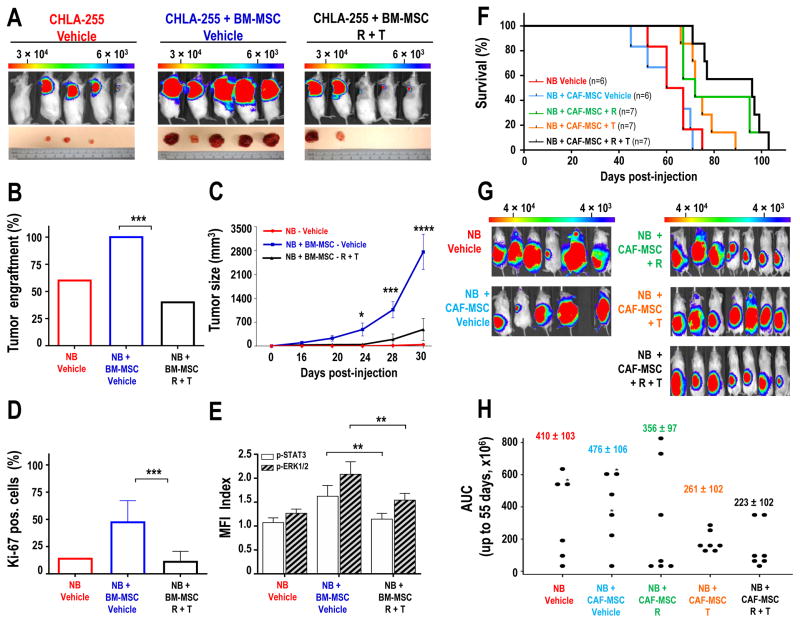
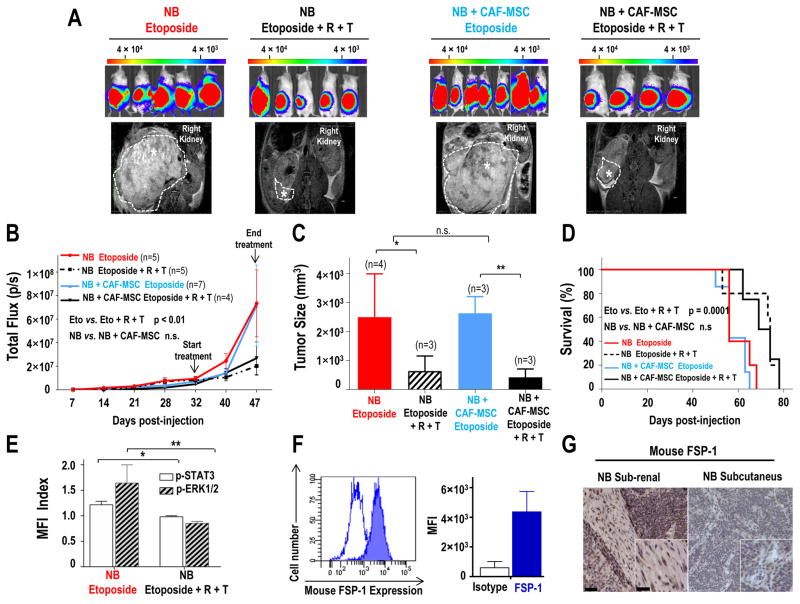
Cancer-associated fibroblasts (CAF) have been suggested to originate from mesenchymal stromal cells (MSC), but their relationship with MSCs is not clear. Here, we have isolated from primary human neuroblastoma tumors a population of αFAP- and FSP-1-expressing CAFs that share phenotypic and functional characteristics with bone marrow-derived MSCs (BM-MSC). Analysis of human neuroblastoma tumors also confirmed the presence of αFAP- and FSP-1-positive cells in the tumor stroma, and their presence correlated with that of M2 tumor-associated macrophages. These cells (designated CAF-MSCs) enhanced in vitro neuroblastoma cell proliferation, survival, and resistance to chemotherapy and stimulated neuroblastoma tumor engraftment and growth in immunodeficient mice, indicating an effect independent of the immune system. The protumorigenic activity of MSCs in vitro and in xenografted mice was dependent on the coactivation of JAK2/STAT3 and MEK/ERK1/2 in neuroblastoma cells. In a mouse model of orthotopically implanted neuroblastoma cells, inhibition of JAK2/STAT3 and MEK/ERK/1/2 by ruxolitinib and trametinib potentiated tumor response to etoposide and increased overall survival. These data point to a new type of protumorigenic CAF in the tumor microenvironment of neuroblastoma and to STAT3 and ERK1/2 as mediators of their activity. Cancer Res; 77(18); 5142-57. ©2017 AACR.


Conflict of interest statement

Conflict of Interest Statement: None of the authors have a conflict of interest to declare.

Figures

Figure 1
Figure 1. CAF isolated from patients with NB share characteristics with MSC, and are present in primary NB tumors
A: Fluorescence-activated cell sorting (FACS) of a subpopulation of GD2-negative cells expressing αFAP from a freshly digested NB tumor. In the histogram overlay on the right, the black line represents isotype control and the red line represents specific staining; B: Representative immunofluorescence images captured by confocal microscopy of CAF-MSC stained for αFAP, FSP-1, Vimentin and αSMA and counterstained with Phalloidin and DAPI. Scale bar = 50 μm; C: Expression of surface markers by flow cytometry in cultured CAF-MSC and BM-MSC; D: Top: Representative images of CAF-MSC, BM-MSC and Fb differentiated into adipocytes, osteocytes and chondrocytes. Bottom: Histogram representing the quantification of differentiated cells by measuring the absorbance (±SD) of solubilized Oil Red O staining (adipocytes), Alizarin Red (osteocytes) and Alcian Blue (chondrocytes) from duplicate wells. Scale bar = 50 μm in the main picture and 15 μm in insert. E: Representative images of sections of NB tumors (n=11) stained for αFAP or FSP-1 as described in Materials and Methods. Scale bar = 50μm in the main picture and 15 μm in insert; F: Scatter diagrams of mRNA expression of αFAP and CD163 in primary tumors of children with high-risk NB (n=219). Spearman correlation values and regression lines for the entire dataset and subsets of samples with MYCN-A (blue line) and those with MYC-NA (red line).
Figure 2
Figure 2. CAF-MSC increase tumor engraftment and growth in xenograft models
A: Representative bioluminescence images of NOD/SCID mice (n=5 per group) taken at day 21 after subcutaneous injection into the right flank of CHLA-255-FLuc cells, either alone or mixed with CAF-MSC or Fb (ratio 4:1); B: Representative bioluminescence images of NOD/SCID mice (n=5 per group) taken at day 21 after subcutaneous injection of CHLA-255-FLuc cells alone into the right flank or mixed with BM-MSC into the left flank. Representative pictures of tumors harvested at day 27 are shown below the bioluminescence images. Note that the bioluminescence from the tumor in the left flank remains visible in images taken of the right flank; C: Percentage of engrafted tumors in each group for the 2 experiments (A and B); D: Average of the bioluminescence signal intensity (p/s = photons per second) over time of all mice (±SEM) in each group; E: Average tumor size (±SEM) over time of all mice in each group; F: Kaplan-Meier survival curves in each group of mice in experiment shown in A; G: Left: Representative images of Ki-67 expression in tumors from each group of mice. Right: Quantification of Ki-67-positive cells (±SEM) from an average of 10 fields (×20) examined for each section in each group. Scale bar = 50 μm; *p<0.05; **p< 0.01, *** for p<0.001, and **** for p< 0.0001.
Figure 3
Figure 3. CAF-MSC and BM-MSC promote tumor cell viability by increasing proliferation and inhibiting apoptosis
A: Indicated NB-FLuc cells were cultured in direct contact with CAF-MSC, BM-MSC or Fb (ratio 4:1), and examined for viability over 4 days by adding D-Luciferin as described in Materials and Methods. As controls, NB cells were grown alone in their own conditioned medium. The data represent the mean (±SD) luminescence activity in relative light units (RLU) from six samples and are representative of one of three independent experiments showing similar results; B: Indicated NB cells were co-cultured in a transwell system using the same conditions as in A. The data represent the mean number (±SD) of trypan blue-negative cells in triplicate samples and are representative of one of two independent experiments showing similar results; C: Indicated NB cells were cultured in CM from NB, NB/CAF-MSC, NB/BM-MSC or NB/Fb co-cultures and examined for viability by CellTiterGlo as described in Materials and Methods, over 4 days as in A. The data represent the mean (±SD) luminescence activity of six samples and are representative of one of two independent experiments; D: Indicated NB cells were cultured as described in C and examined for BrdU incorporation after 48 hours as indicated in Materials and Methods. The histograms represent the mean (±SD) percentage of cells in S-phase for triplicate samples and results are representative of one of three independent experiments showing similar results; E: NB cells were cultured as indicated in C and examined for apoptosis after 4 days by flow cytometry as indicated in Materials and Methods. The histograms represent the mean (±SD) percentage of Annexin V+/PI+ and Annexin V+/PI cells for triplicate samples, and results are representative of one of two independent experiments showing similar results. *p<0.05;**p< 0.01; ***p<0.001; ****p< 0.0001; n.s. = not significant.
Figure 4
Figure 4. CAF-MSC protect tumor cells from drug-induced apoptosis
A–B: Indicated NB cells were cultured in CM from NB, NB/CAF-MSC, NB/BM-MSC or NB/Fb co-cultures, treated with etoposide (A) or melphalan (B) at the indicated concentrations for 48 hours and examined for cell viability. The graph on the left represents the dose-response curve with the mean (±SD) percentage of viable cells from control (no drug) in triplicate samples and are representative of one of three independent experiments showing similar results. The histograms on the right represent the mean (±SD) IC50 values calculated from the dose-response curves; C: NB cells were cultured as described in A, treated at the indicated concentrations of etoposide, and examined after 48 hours for apoptosis by flow cytometry. The histograms represent the mean (±SD) percentage of Annexin V+/PI+ and Annexin V+/PI cells from triplicate samples and results are representative of one of two independent experiments showing similar results; D: CHLA-255 cells were cultured and treated as in C and examined after 48 hours for cleavage of caspase-3 by western blot analysis. β-actin was used as a loading control; E: Indicated NB cells were cultured and treated as described in A and examined for caspase 3/7 activity after 48 hours. The data represent the mean fold change (±SD) of caspase 3/7 activity from triplicate samples and are representative of one of two independent experiments showing similar results. The scatter dot plot graphics on the right represent the mean fold change (±SD) of caspase 3/7 activity of NB treated with etoposide at a concentration of 1 μM and are representative of one of two experiments showing similar results. *p<0.05; **p< 0.01; ***p<0.001; ****p< 0.0001; n.s. = non-significant.
Figure 5
Figure 5. The pro-tumorigenic activity of CAF-MSC is STAT3 and ERK1/2-dependent
A: CHLA-255 cells were exposed to CM from NB, NB/CAF-MSC, NB/BM-MSC or NB/Fb co-cultures for 30 minutes and analyzed for the indicated phosphorylated proteins using the PathScan Intracellular Signaling Array. The graphic represents the mean (±SD) relative fluorescence units (RFU) for each phosphorylated protein. Insert: Picture of typical dot blots; B: Western blot analysis of the expression of p-STAT3 and p-ERK1/2 in lysates of tumors obtained from the subcutaneous injection of mice with CHLA-255-FLuc cells alone or mixed with CAF-MSC, Fb or BM-MSC as shown in Fig. 2A–B. β-Actin was used as a loading control; C: CHLA-255 cells were treated with increased concentrations of ruxolitinib (R) or trametinib (T) and examined for cell viability after 48 hours. The data represent the mean (±SD) percentage of viable cells determined by the luminescence activity from triplicate samples and results are representative of one of two independent experiments showing similar results; D: Western blot analysis of the expression of p-STAT3, STAT3, p-ERK1/2 and ERK1/2 in CHLA-255 cells exposed to NB/CAF-MSC CM and treated with ruxolitinib (2.5 μM), trametinib (0.01 μM) or combination of both inhibitors for 30 minutes. β-Actin was used as a loading control. Data are representative of one of two independent experiments showing similar results; E: CHLA-255 cells were exposed to NB CM or NB/CAF-MSC CM, treated as in D and examined for viability after 48 hours. The data represent the mean (±SD) fold change of cells viability determined by the luminescence activity from triplicate samples and results are representative of one of two independent experiments; F: CHLA-255 cells were exposed to NB CM or NB/CAF-MSC CM, treated with the indicated concentrations of etoposide in the presence of ruxolitinib (R), trametinib (T) or their combination (R+T) and examined for viability after 48 hours. The data represent the mean (±SD) percentage of viable cells determined by luminescence activity from triplicate samples and are representative of one of two independent experiments showing similar results. G: CHLA-255, CAF-MSC and BM-MSC cells were cultured alone or together for 48 hours. The levels of soluble factors present in the CM were analyzed by a Cytokine Array Panel and quantified by scanning as described in Materials and Methods. The graphs represent the mean (±SD) pixel density of each duplicate spot obtained with CM of cells cultured alone (left) or together (right). **p< 0.01; ***p<0.001; ****p< 0.0001; n.s. = non-significant.
Figure 6
Figure 6. Inhibition of STAT3 and ERK1/2 suppresses tumor engraftment and growth and increases survival in NB xenograft models
A: Representative bioluminescence images of NSG mice at day 30 after subcutaneous injection with CHLA-255-FLuc cells alone (n=5) or mixed with BM-MSC (ratio 4:1) and treated with vehicle (n=5) or ruxolitinib (R, 90 mg/kg/day) and trametinib (T, 0.1 mg/kg/day) (n=5). Lower panel: pictures of tumors harvested at day 32; B: Percentage of engrafted tumors in each group; C: Mean (±SD) tumor size over time for all mice in each group; D: Quantification of Ki-67-positive cells (±SEM) from an average of 10 fields (×20) examined for each section in each group. The data represent the mean (±SD) percent of Ki-67 positive cells from 10 fields (×20) examined for each tumor section; E: Flow cytometry analysis for p-STAT3 and p-ERK1/2 in GD2-positive NB cells harvested from tumors shown in A. The data represent the mean (±SD) MFI index from all developed tumors in each group; F: Kaplan-Meier survival curves of mice injected in the sub-renal capsule with CHLA-255-FLuc cells alone or with CAF-MSC (ratio 4:1). One week after implantation, mice were treated with vehicle or ruxolitinib (R, 90 mg/kg/day), or trametinib (T, 0.1 mg/kg/day), or their combination (R+T). The data are the results of 2 independent experiments with a total of 33 mice that developed tumors. Mice that didn’t developed tumors were excluded from the analysis; G: Representative bioluminescence images at day 50 of NSG mice in each group H: Dot plot of area under curve (AUC) of all bioluminescence signal intensity (p/s = photons per second) up to day 55 (n=33 mice) in each group. The stars indicate which mouse had a censored AUC as they died before day 55. * p<0.05; **p< 0.01; ***p<0.001.
Figure 7
Figure 7. Combined inhibition of STAT3 and ERK1/2 sensitizes NB cells to chemotherapy in xenograft model
A: Representative bioluminescence images of NSG mice at day 47 after sub-renal capsule injection with CHLA-255-FLuc cells alone or mixed with CAF-MSC (ratio 4:1). After five weeks, mice were treated either with etoposide (10 mg/kg, three times/week) or etoposide and a combination of ruxolitinib (R, 60 mg/kg/twice a day) and trametinib (T, 3 mg/kg/day) for two weeks. Lower panel: Representative MRI images of the tumors at day 49; B: Average bioluminescence signal intensity (p/s = photons per second) over time of all mice (±SD) in each group; C: Average tumor size (±SD) measured by MRI at day 49; D: Kaplan-Meier survival curves in each group of mice; E: Flow cytometry analysis for p-STAT3 and p-ERK1/2 in GD2-positive NB cells harvested from tumors five hours after treatment with R and T. The data represent the MFI from 2 tumors in each group; F: Flow cytometry analysis of mFSP-1 expression in tumors derived from the injection of NB cells alone. Left: Open curve represents the isotype control and the filled curve represents mFSP-1 staining. Right: The histogram represents the MFI (±SD) from three tumors; G: Representative images of sections of tumors derived from injection of NB cells alone under the renal capsule or subcutaneously and stained for mouse FSP-1 as described in Materials and Methods. Scale bar = 50 μm in the main picture and 20 μm in insert. *p<0.05; **p< 0.01; n.s. = not significant.

Similar articles

Cited by

References

    1. Hanahan D, Weinberg RA. Hallmarks of cancer: the next generation. Cell. 2011;144:646–74. - PubMed
    1. Lyden D, Hattori K, Dias S, Costa C, Blaikie P, Butros L, et al. Impaired recruitment of bone-marrow-derived endothelial and hematopoietic precursor cells blocks tumor angiogenesis and growth. NatMed. 2001;7:1194–201. - PubMed
    1. Ohlund D, Elyada E, Tuveson D. Fibroblast heterogeneity in the cancer wound. J Exp Med. 2014;211:1503–23. - PMC - PubMed
    1. Mantovani A, Locati M. Tumor-associated macrophages as a paradigm of macrophage plasticity, diversity, and polarization: lessons and open questions. Arterioscler Thromb Vasc Biol. 2013;33:1478–83. - PubMed
    1. Augsten M. Cancer-associated fibroblasts as another polarized cell type of the tumor microenvironment. Front Oncol. 2014;4:62. - PMC - PubMed

MeSH terms