

Increased levels of Gab1 and Gab2 adaptor proteins skew interleukin-4 (IL-4) signaling toward M2 macrophage-driven pulmonary fibrosis in mice
- PMID: 28687632
- PMCID: PMC5572909
- DOI: 10.1074/jbc.M117.802066
Increased levels of Gab1 and Gab2 adaptor proteins skew interleukin-4 (IL-4) signaling toward M2 macrophage-driven pulmonary fibrosis in mice
Abstract
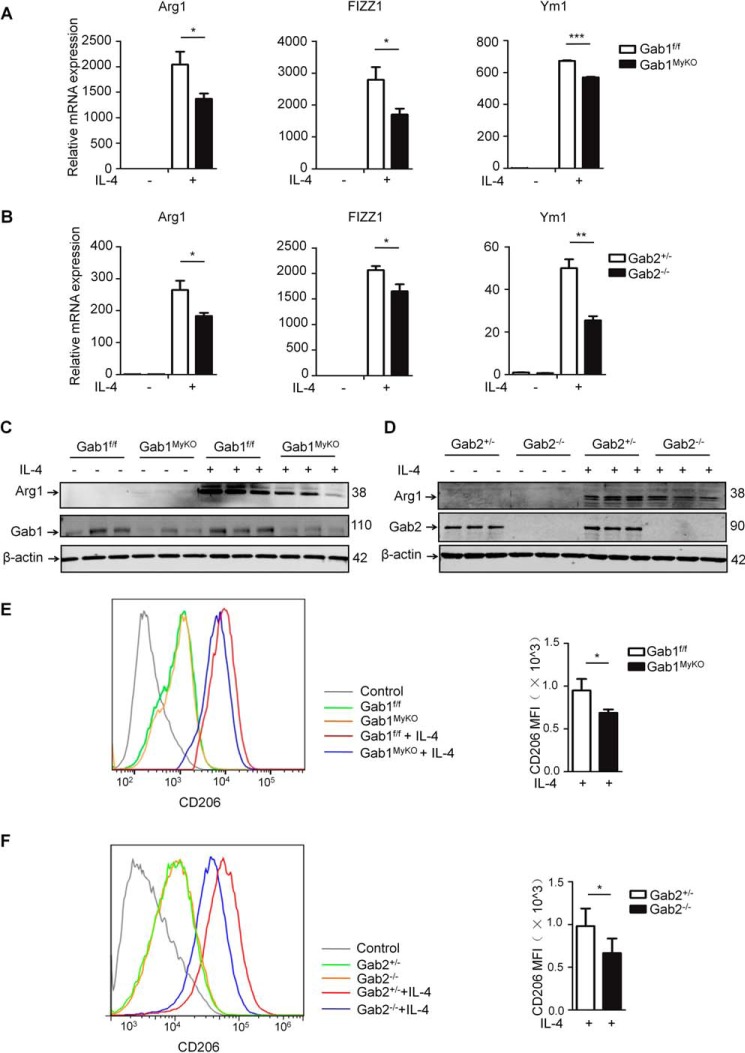
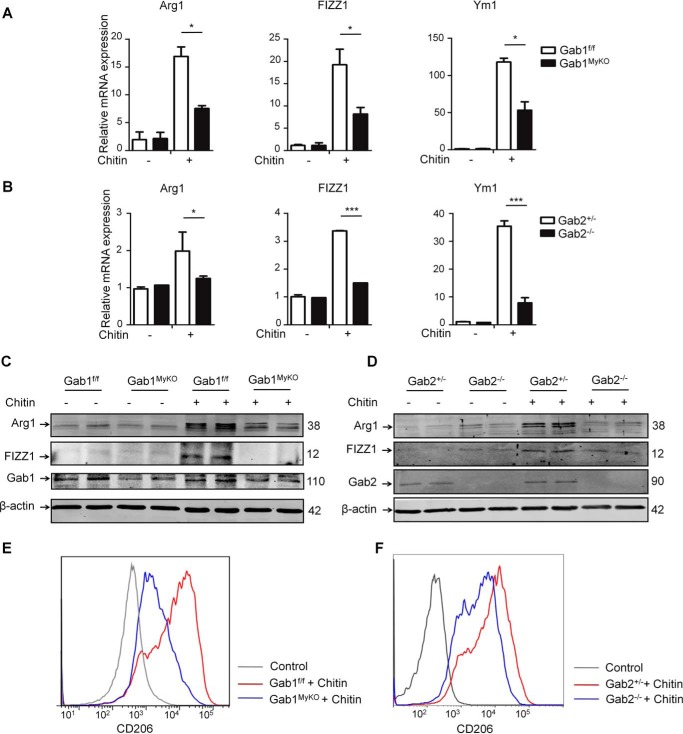
M2-polarized macrophages, also known as alternatively activated macrophages, have long been associated with pulmonary fibrosis; however, the mechanism has not been fully defined. Gab1 and Gab2 proteins belong to the Gab family of adaptors and are integral components of the signal specificity in response to various extracellular stimuli. In this report, we found that levels of both Gab1 and Gab2 were elevated in M2-polarized macrophages isolated from bleomycin-induced fibrotic lungs. In vitro Gab1/2 deficiency in bone marrow-derived macrophages abrogated IL-4-mediated M2 polarization. Furthermore, in vivo conditional removal of Gab1 (Gab1MyKO) and germ line knock-out of Gab2 (Gab2-/-) in macrophages prevented a bias toward the M2 phenotype and attenuated bleomycin-induced fibrotic lung remodeling. In support of these observations, Gab1/2 were involved in responses predominated by IL-4 signaling, an essential determinant for macrophage M2 polarization. Further investigation revealed that both Gab1 and -2 are recruited to the IL-4 receptor, synergistically enhancing downstream signal amplification but conferring IL-4 signal preference. Mechanistically, the loss of Gab1 attenuated AKT activation, whereas the absence of Gab2 suppressed STAT6 activation in response to IL-4 stimulation, both of which are commonly attributed to M2-driven pulmonary fibrosis in mice. Taken together, these observations define a non-redundant role of Gab docking proteins in M2 polarization, adding critical insights into the pathogenesis of idiopathic pulmonary fibrosis.
Keywords: AKT signaling; Akt PKB; Gabs; M2 polarization; STAT transcription factor; STAT6 signaling; adaptor protein; macrophage; pulmonary fibrosis.
© 2017 by The American Society for Biochemistry and Molecular Biology, Inc.
Conflict of interest statement
The authors declare that they have no conflicts of interest with the contents of this article
Figures


Similar articles
-
Myeloid-specific disruption of tyrosine phosphatase Shp2 promotes alternative activation of macrophages and predisposes mice to pulmonary fibrosis.J Immunol. 2014 Sep 15;193(6):2801-11. doi: 10.4049/jimmunol.1303463. Epub 2014 Aug 15. J Immunol. 2014. PMID: 25127857
-
IL20Rb aggravates pulmonary fibrosis through enhancing bone marrow derived profibrotic macrophage activation.Pharmacol Res. 2024 May;203:107178. doi: 10.1016/j.phrs.2024.107178. Epub 2024 Apr 5. Pharmacol Res. 2024. PMID: 38583686
-
Inhibition of HIF-1α ameliorates pulmonary fibrosis by suppressing M2 macrophage polarization through PRMT1/STAT6 signals.Int Immunopharmacol. 2025 Jan 27;146:113931. doi: 10.1016/j.intimp.2024.113931. Epub 2024 Dec 28. Int Immunopharmacol. 2025. PMID: 39733638
-
Silica-induced ROS in alveolar macrophages and its role on the formation of pulmonary fibrosis via polarizing macrophages into M2 phenotype: a review.Toxicol Mech Methods. 2025 Feb;35(2):89-100. doi: 10.1080/15376516.2024.2400323. Epub 2024 Sep 10. Toxicol Mech Methods. 2025. PMID: 39223849 Review.
-
The Role of Macrophages in Lung Fibrosis and the Signaling Pathway.Cell Biochem Biophys. 2024 Jun;82(2):479-488. doi: 10.1007/s12013-024-01253-5. Epub 2024 Mar 27. Cell Biochem Biophys. 2024. PMID: 38536578 Review.
Cited by
-
Inhibition of chlorine-induced airway fibrosis by budesonide.Toxicol Appl Pharmacol. 2019 Jan 15;363:11-21. doi: 10.1016/j.taap.2018.08.024. Epub 2018 Sep 3. Toxicol Appl Pharmacol. 2019. PMID: 30189237 Free PMC article.
-
Mitochondrial dysfunction in fibrotic diseases.Cell Death Discov. 2020 Sep 5;6:80. doi: 10.1038/s41420-020-00316-9. eCollection 2020. Cell Death Discov. 2020. PMID: 32963808 Free PMC article. Review.
-
Macrophages: friend or foe in idiopathic pulmonary fibrosis?Respir Res. 2018 Sep 6;19(1):170. doi: 10.1186/s12931-018-0864-2. Respir Res. 2018. PMID: 30189872 Free PMC article. Review.
-
Polarized Macrophages in Periodontitis: Characteristics, Function, and Molecular Signaling.Front Immunol. 2021 Dec 7;12:763334. doi: 10.3389/fimmu.2021.763334. eCollection 2021. Front Immunol. 2021. PMID: 34950140 Free PMC article. Review.
-
Liver-specific overexpression of Gab2 accelerates hepatocellular carcinoma progression by activating immunosuppression of myeloid-derived suppressor cells.Oncogene. 2022 Jun;41(24):3316-3327. doi: 10.1038/s41388-022-02298-7. Epub 2022 Apr 11. Oncogene. 2022. PMID: 35411035
References
MeSH terms
Substances
LinkOut - more resources
Full Text Sources
Other Literature Sources
Medical
Molecular Biology Databases
Research Materials
Miscellaneous
