. 2017 Jul;29(7):1678-1696.
doi: 10.1105/tpc.17.00397. Epub 2017 Jul 6.

A Plastid Phosphatidylglycerol Lipase Contributes to the Export of Acyl Groups from Plastids for Seed Oil Biosynthesis

Affiliations

A Plastid Phosphatidylglycerol Lipase Contributes to the Export of Acyl Groups from Plastids for Seed Oil Biosynthesis

Kun Wang et al. Plant Cell. 2017 Jul.

Abstract

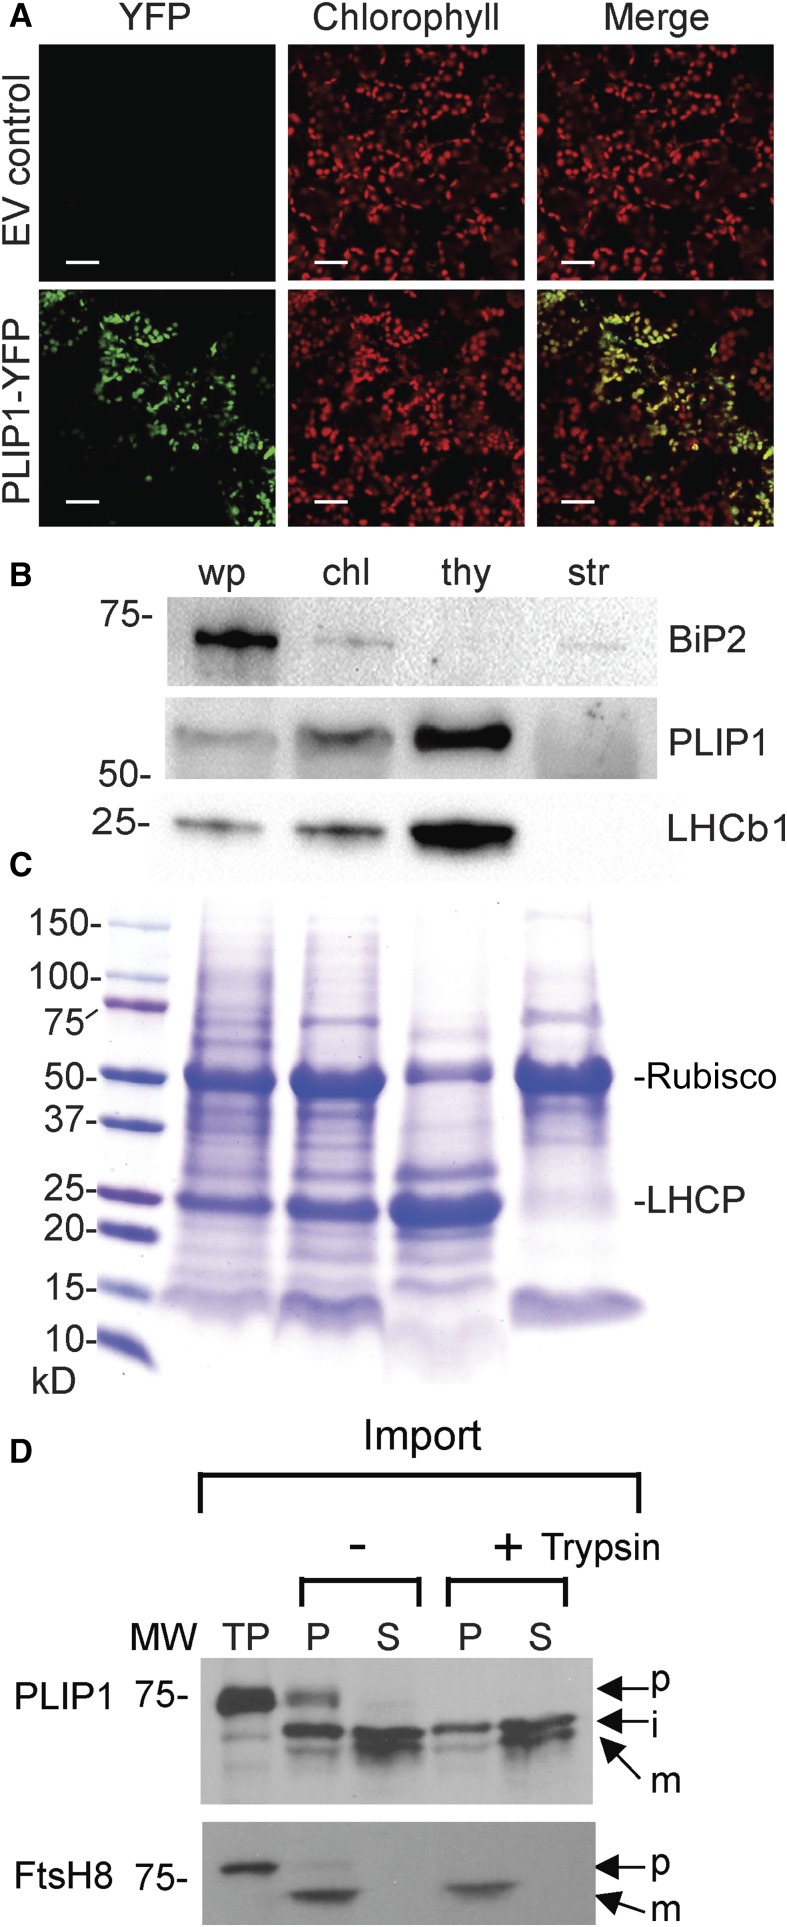
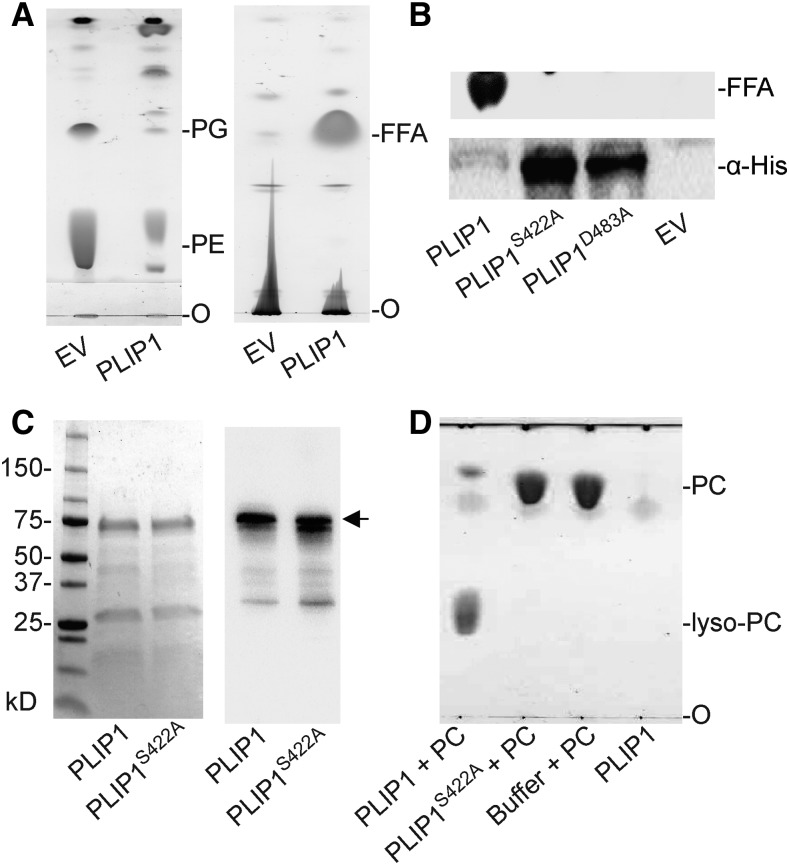
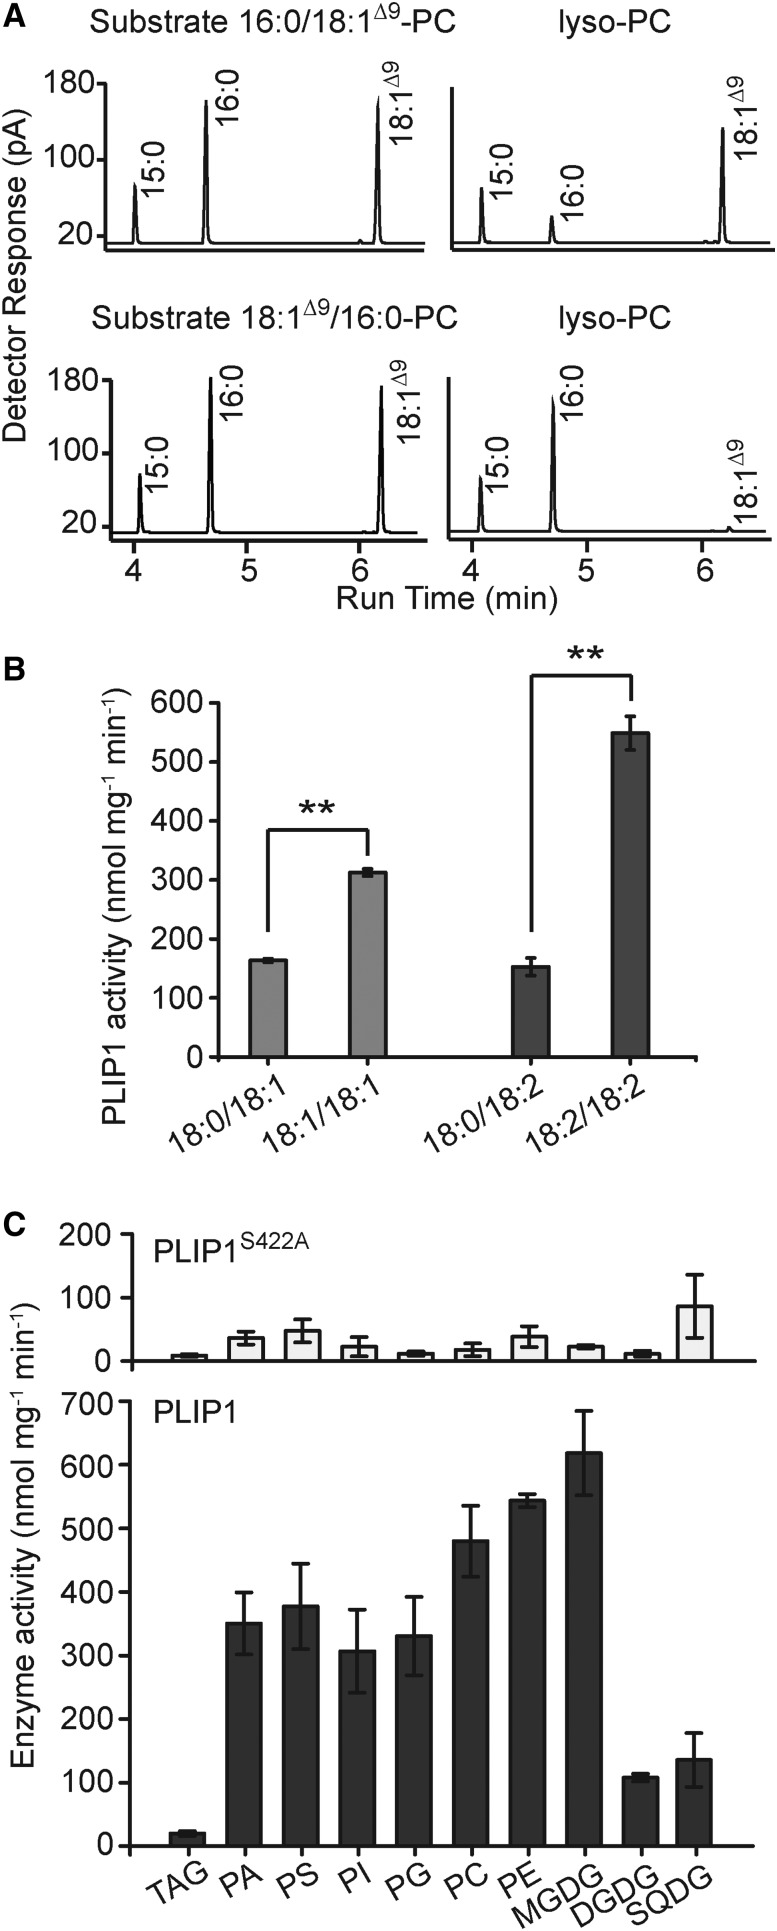
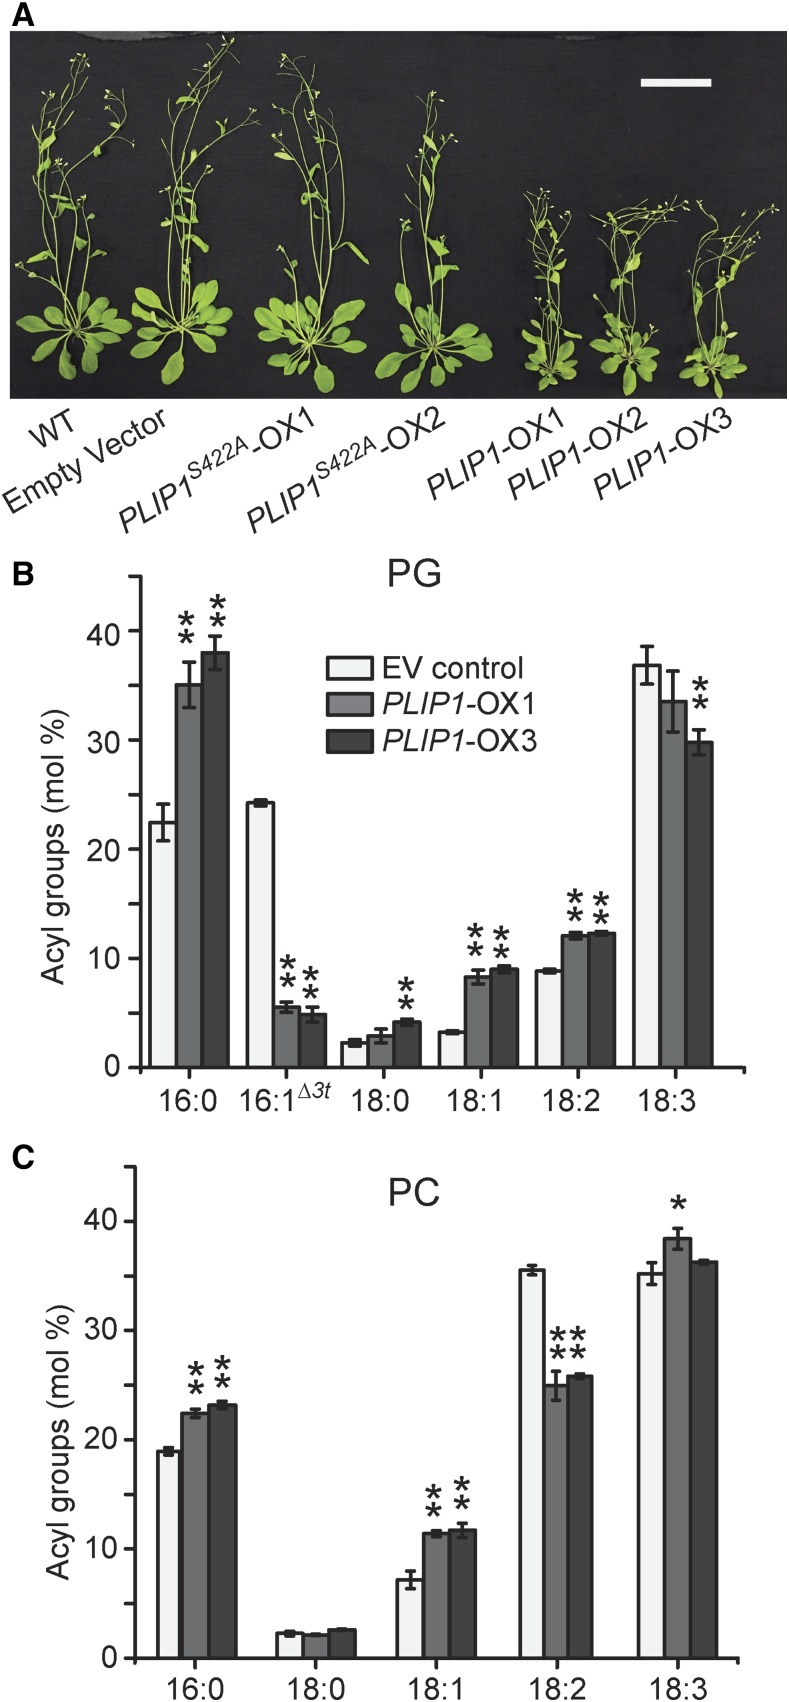
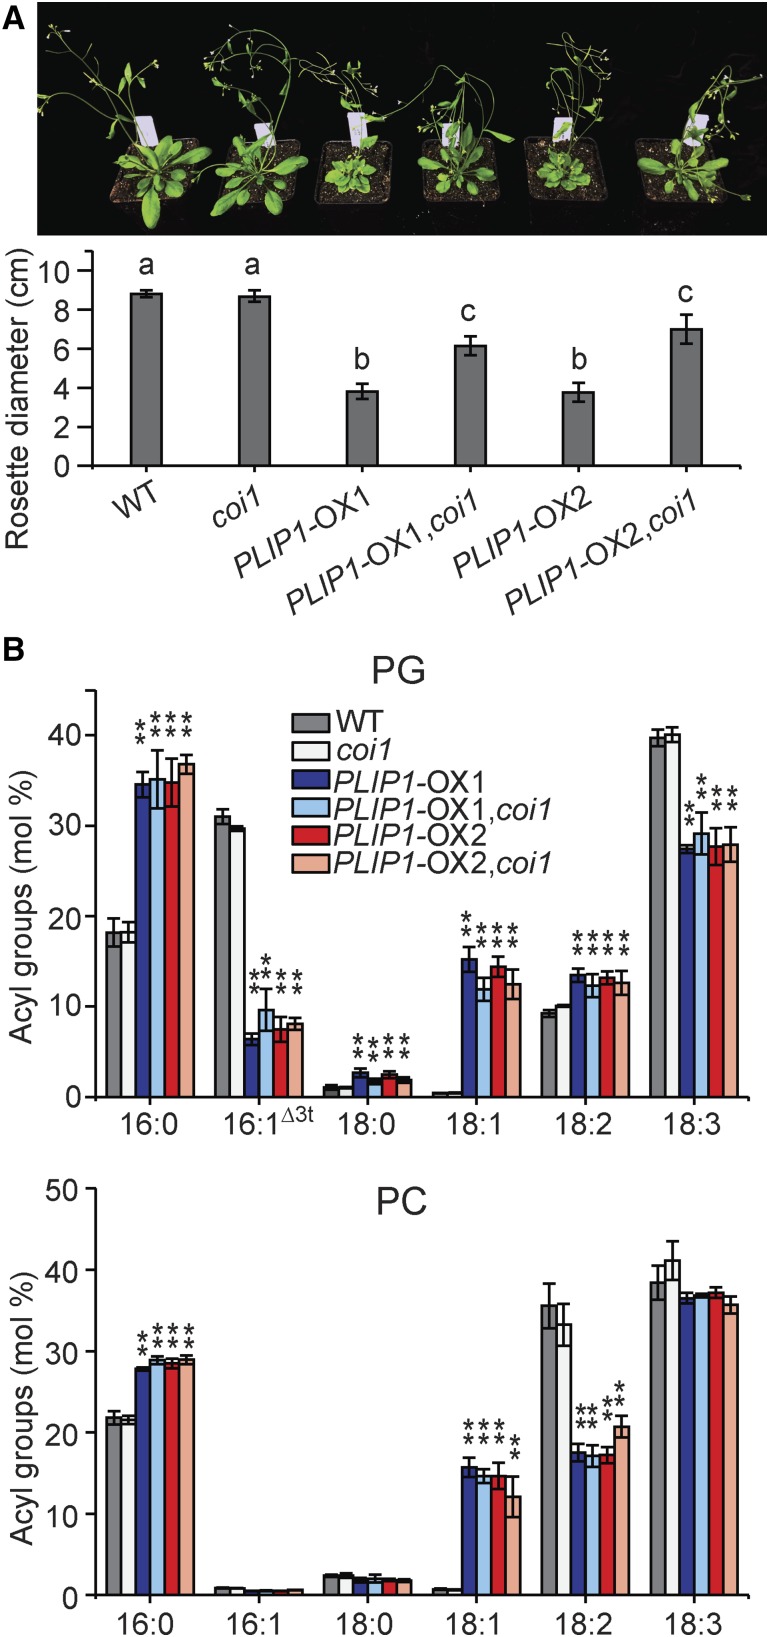
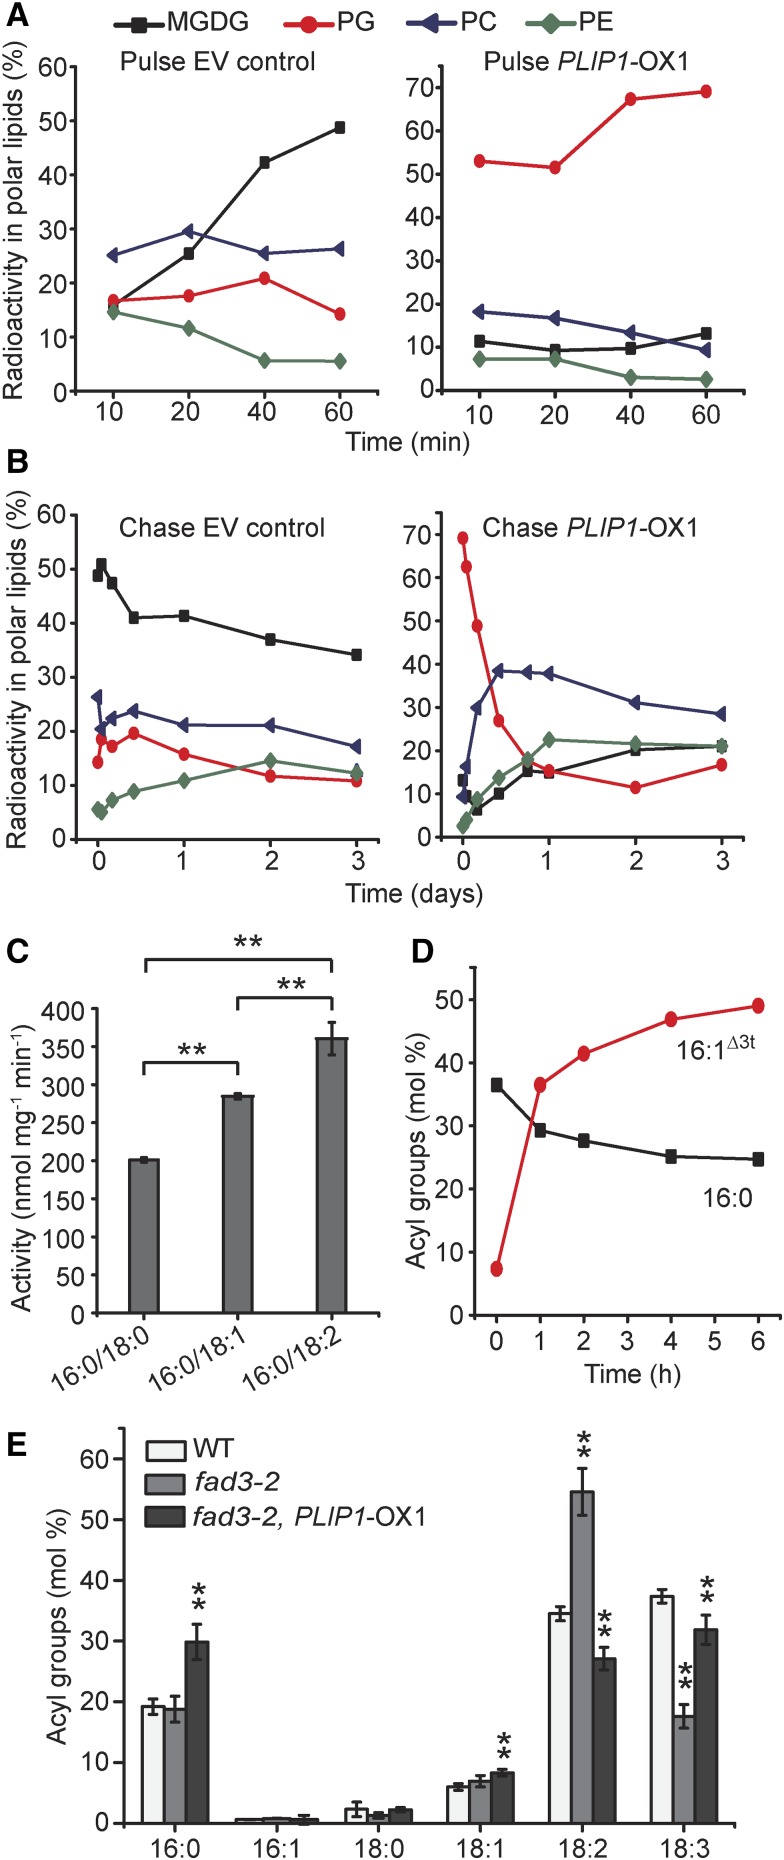
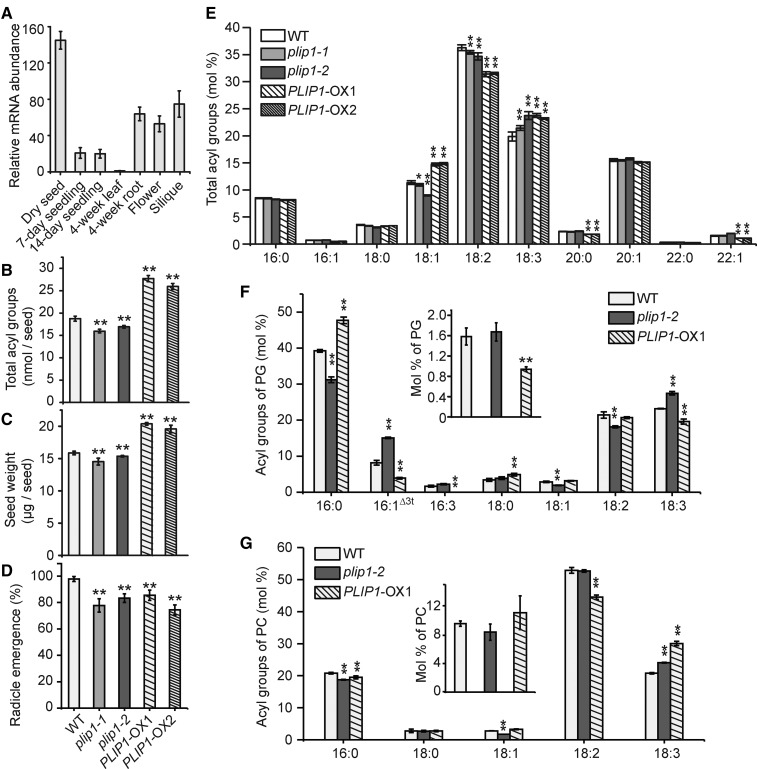
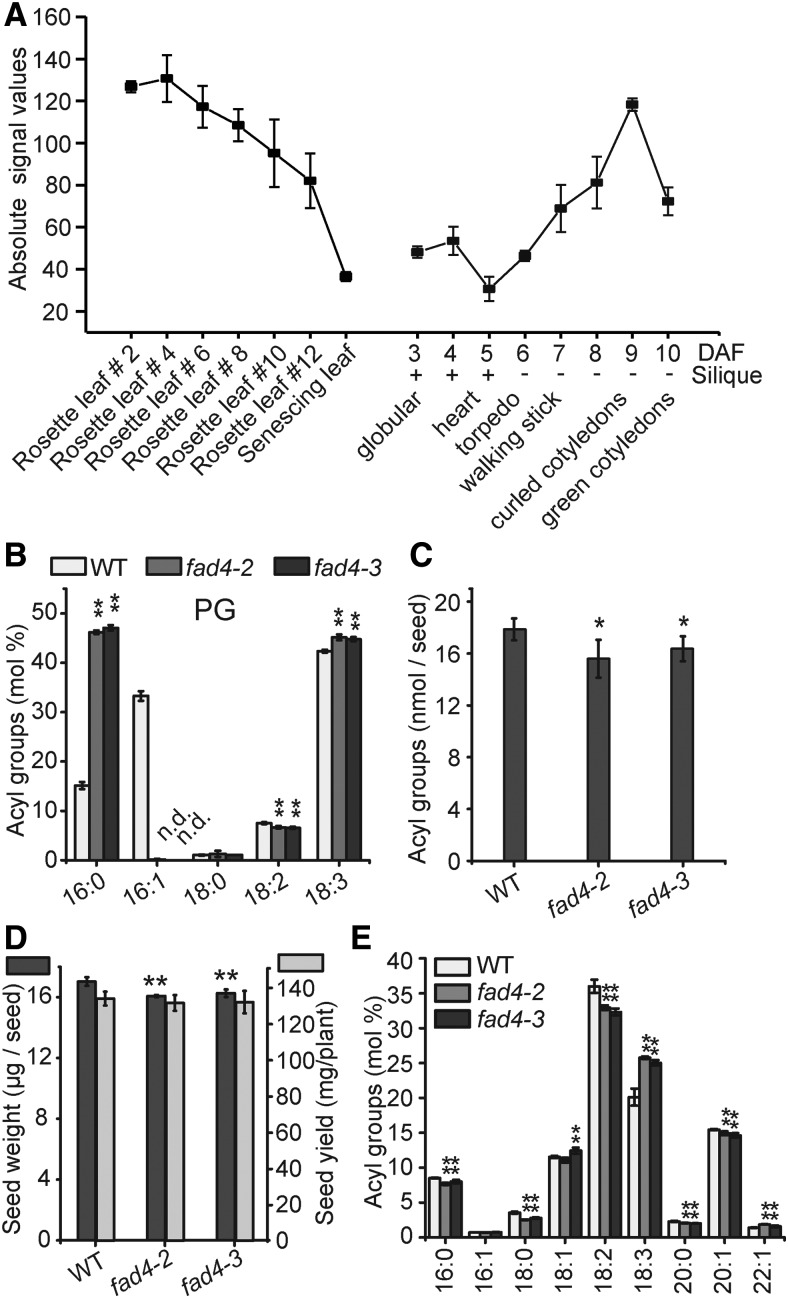
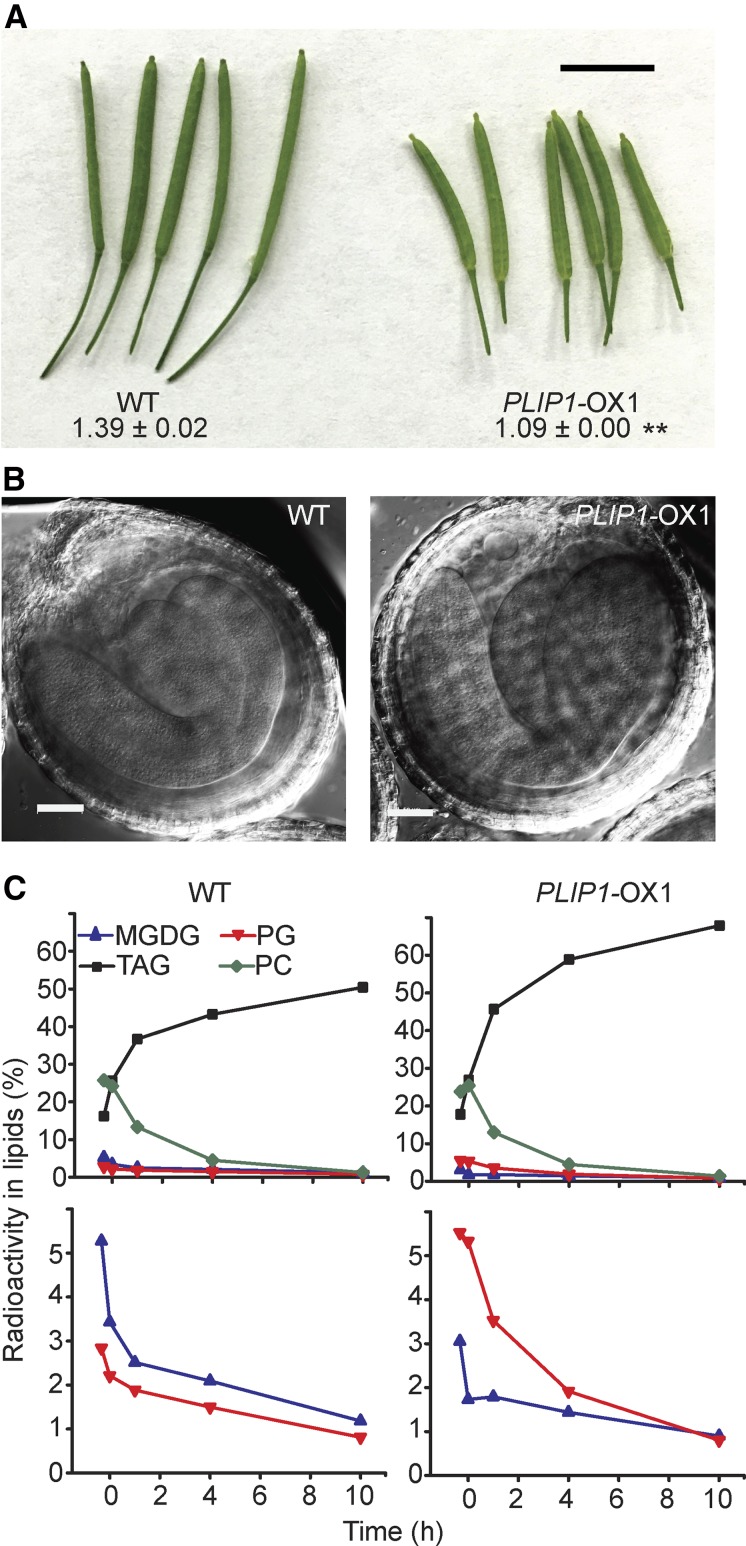
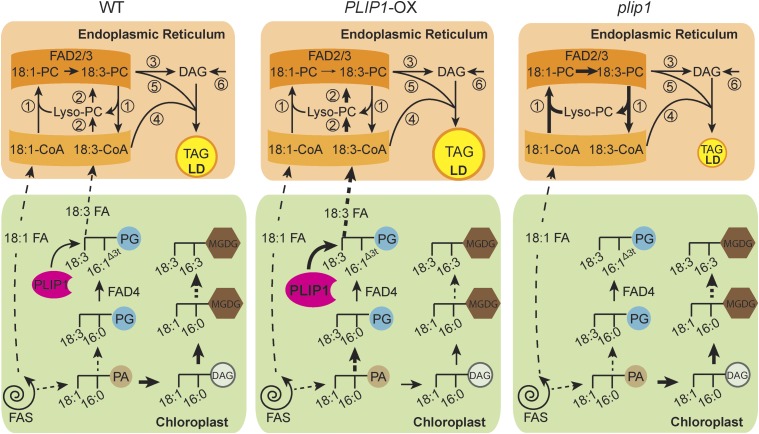
The lipid composition of thylakoid membranes inside chloroplasts is conserved from leaves to developing embryos. A finely tuned lipid assembly machinery is required to build these membranes during Arabidopsis thaliana development. Contrary to thylakoid lipid biosynthetic enzymes, the functions of most predicted chloroplast lipid-degrading enzymes remain to be elucidated. Here, we explore the biochemistry and physiological function of an Arabidopsis thylakoid membrane-associated lipase, PLASTID LIPASE1 (PLIP1). PLIP1 is a phospholipase A1 In vivo, PLIP1 hydrolyzes polyunsaturated acyl groups from a unique chloroplast-specific phosphatidylglycerol that contains 16:1 Δ3trans as its second acyl group. Thus far, a specific function of this 16:1 Δ3trans -containing phosphatidylglycerol in chloroplasts has remained elusive. The PLIP1 gene is highly expressed in seeds, and plip1 mutant seeds contain less oil and exhibit delayed germination compared with the wild type. Acyl groups released by PLIP1 are exported from the chloroplast, reincorporated into phosphatidylcholine, and ultimately enter seed triacylglycerol. Thus, 16:1 Δ3trans uniquely labels a small but biochemically active plastid phosphatidylglycerol pool in developing Arabidopsis embryos, which is subject to PLIP1 activity, thereby contributing a small fraction of the polyunsaturated fatty acids present in seed oil. We propose that acyl exchange involving thylakoid lipids functions in acyl export from plastids and seed oil biosynthesis.


Figures

Figure 1.
Figure 1.
Subcellular Localization of PLIP1 in Arabidopsis. (A) Subcellular localization of PLIP1-YFP in leaf mesophyll cells of 3-week-old Arabidopsis Col-0 transformed with PLIP1-YFP driven by the 35S promoter or EV control using confocal laser scanning microscopy. Chlorophyll autofluorescence is shown in red, and YFP fluorescence is shown in green. Overlay of chlorophyll and YFP is shown as well (Merge). Representative images from one experiment are presented. Bars = 30 µm. (B) PLIP1 enrichment in chloroplast fractions analyzed by immunoblotting. Intact and subfractionated chloroplasts were prepared using 4-week-old Arabidopsis (Col-0) plants grown on MS medium. Equal amounts of protein of leaf tissues from the whole plant (wp), intact chloroplasts (chl), thylakoid (thy), and stroma (str) were separated by SDS-PAGE or further subjected to immunoblotting analysis using an antibody against PLIP1S422A, a nonfunctional mutant of PLIP1. Immunoblotting was used to detect marker proteins BiP2 (endoplasmic reticulum) and LHCb1 (thylakoid). For protein loading, 12 µg per fraction was loaded for PLIP1; 2 µg per fraction for BiP2 and LHCb1. (C) SDS-PAGE Coomassie blue staining was used to detect Rubisco large subunit (stroma) and light-harvesting chlorophyll a/b binding protein (LHCP) (thylakoid), which were used as markers. Numbers indicate protein molecular mass in kilodaltons. For protein loading, 12 µg per fraction were loaded. (D) Chloroplast import experiments with labeled PLIP1 and control protein FtsH8. Chloroplasts were treated with (+) or without (−) trypsin. Total chloroplast membranes (P) or soluble (S) fractions were analyzed by SDS-PAGE followed by fluorography. TP, translation products; p, precursor; i, intermediate; m, mature form; MW, molecular weight markers.
Figure 2.
Figure 2.
Recombinant PLIP1 Has Lipase Activity. (A) Thin-layer chromatographic analysis of polar (left) and neutral (right) lipids in E. coli containing a 6×His-PLIP1 expression construct or EV control at 6 h following induction. FFA, free fatty acid; O, origin of sample loading. TLC plates were stained with iodine vapor. (B) Mutation of the PLIP1 active site motif. Lipid extracts of E. coli cultures 6 h after induction expressing 6×His-PLIP1 or two point mutation alleles, 6×His -PLIP1S422A or 6×His-PLIP1D483A, or containing an EV control were analyzed by TLC to detect FFA products (top panel). Protein extracts were analyzed for protein production using an antibody against the 6×His tag. (C) SDS-PAGE analysis of purified PLIP1 and PLIP1S422A proteins. Loading was 5 µg per lane for both samples. SDS-PAGE separated proteins were stained by Coomassie blue (left) or detected by immunoblotting with an antibody raised against PLIP1S422A (right). Numbers indicate protein molecular mass in kilodaltons. 6×His-PLIP1 and 6×His-PLIP1S422A are indicated by the arrow. (D) Thin-layer chromatogram of products of a representative in vitro lipase reaction using PC with the wild type (PLIP1 + PC) and the mutant enzyme (PLIP1S422A + PC). Substrate without enzyme (Buffer + PC) and enzyme without substrate (PLIP1) were included as controls. O, origin of sample loading. Lipids were visualized by iodine vapor staining.
Figure 3.
Figure 3.
Specificity of PLIP1 in Vitro Activity. (A) Gas-liquid chromatograms of methyl esters derived from commercial PC substrates or lyso-PC fractions from PLIP1 lipase reactions with different PC substrates. 15:0 was used as an internal standard. (B) PLIP1 lipase activity on commercial PC substrates (carbon number:double bond number; sn-1/sn-2) with different degrees of saturation of the sn-1 acyl groups. PC containing 18:0/18:1 and 18:1/18:1 and PC containing 18:0/18:2 and 18:2/18:2 were compared, respectively. n = 4, ±sd. Student’s t test was applied (**P < 0.01). (C) PLIP1 activity on different substrates. For each PLIP1 lipase reaction, 60 µg lipids and 0.5 µg protein were used. The reactions were incubated at ambient temperature (∼22°C) for 1.5 h, which was still during the linear portion of the reaction time course for PC (Supplemental Figure 2). PLIP1S422A was included as a negative control and is shown in the top panel. All lipids contained two oleic acids (18:1), except MGDG, DGDG, and SQDG, which were isolated from plants, and PI, which was isolated from bovine liver. n = 3 to 4 for each substrate, ±sd. PA, phosphatidic acid; PS, phosphatidylserine.
Figure 4.
Figure 4.
Growth and Lipid Phenotypes of PLIP1 Overexpression Plants. (A) Growth of 4-week-old soil-grown plants. Arabidopsis wild-type plant, one EV control line, and two PLIP1S422A-OX and three PLIP1-OX overexpression lines are shown. Bar = 5 cm. (B) and (C) Relative acyl composition of PG and PC in PLIP1-OX and EV control lines. Mature leaf lipids were extracted and analyzed from the plants shown in (A). Leaf samples harvested from one plant were taken as one biological repeat; n = 4, ±sd. Student’s t test was applied to compare the EV control with each PLIP1-OX line (*P < 0.05; **P < 0.01).
Figure 5.
Figure 5.
Phenotypes of PLIP1-OX and coi1 plants. (A) Image of the 4-week-old plants grown on soil and the rosette diameter of the indicated plants. n = 6, ±sd, one-way ANOVA with post-hoc Turkey HSD test was applied. Rosette diameters indicated by different letters (a, b, and c) are significantly different (P < 0.01). (B) Relative acyl group compositions of leaf PG and PC in the indicated plants in (A). Leaf samples harvested from one plant were treated as one biological repeat; n = 3, ±sd. Student’s t test was applied to compare the wild type with each of the remaining genotypes (**P < 0.01).
Figure 6.
Figure 6.
PLIP1 Precursor-Product Relationships in PLIP1 Overexpression Plants. (A) and (B) In vivo pulse-chase acetate labeling of lipids in wild-type and PLIP1-OX1 plants. The length of the [14C]-acetate labeling pulse was 60 min (A), after which medium was replaced with nonlabeled free acetate to initiate the chase with a duration of three days (B). The fractions of label in all polar lipids are given as percentages of total incorporation of label in polar lipids. Experiments were repeated three times with similar results, and one representative result is shown. (C) Activity of purified recombinant PLIP1 on PC with different sn-2 acyl groups. PC containing 16:0/18:0, 16:0/18:1, and 16:0/18:2 were used as substrates. n = 4, ±sd. Student’s t test was applied (**P < 0.01). (D) PLIP1 enzyme activity preference for molecular species of phosphatidylglycerol isolated from N. benthamiana leaves. Acyl groups of lyso-phosphatidylglycerol are shown as molar percentages of total acyl groups at any given time point. Experiments were repeated three times with similar results and data from one representative experiment are shown. (E) Relative acyl composition of PC in wild-type, fad3-2, and fad3-2 PLIP1-OX1 plants. Leaf lipids were extracted and isolated by TLC and fatty acid methyl esters derived from the lipids were analyzed by GC. Mature leaf samples harvested from one plant were taken as one biological repeat; n = 4, ±sd. Student’s t test was applied (**P < 0.01).
Figure 7.
Figure 7.
Effect of PLIP1 on Seed Oil Biosynthesis and Germination. (A) PLIP1 transcript levels in different tissues or developmental stages determined by quantitative PCR. Expression levels were normalized to those lowest in 4-week-old leaf tissues and shown as relative fold changes. n = 3 for each tissue, ±sd. (B) Total acyl group content in dry seeds of the wild type, plip1-1, plip1-2, PLIP1-OX1, and PLIP1-OX2. Thirty seeds were analyzed in bulk for each repeat; n = 5, ±sd. (C) Weight of the seeds shown in (B). Two hundred seeds were analyzed for each repeat; n = 4-7, ±sd. (D) Germination of wild-type, plip1-1, plip1-2, PLIP1-OX1, and PLIP1-OX2 seeds. The fraction of seeds showing radicle emergence was determined 40 h after stratified seeds were sown on MS medium. One hundred seeds were used for each repeat, n = 3, ±sd. (E) Relative acyl group composition of dry seeds shown in (B). Acyl groups with a molar percentage <0.5% were omitted. Thirty seeds were analyzed in bulk for each repeat; n = 5, ±sd. (F) and (G) content and compositional analysis of PG and PC in developing seeds isolated from wild-type, plip1-1, and PLIP1-OX1 siliques harvested 7 d after flowering. Molar percentages of PG and PC in lipids are shown in the inserted figures. Equivalent volume (100 μL) of developing seeds was used for each repeat. n = 3, ±sd. Where appropriate, Student’s t test was applied to compare wild-type values with those of plip1-2 and PLIP1-OX, respectively (*P < 0.05; **P < 0.01).
Figure 8.
Figure 8.
Analysis of fad4-2 and fad4-3 Plants. (A) Absolute expression levels of FAD4 in leaves and developing seeds at different stages. Data were extracted from the Arabidopsis eFB browser. Average values from triplicates are shown, and the error bars represent sd. (B) Leaf PG acyl group composition of 3-week-old MS-medium-grown wild-type, fad4-2, and fad4-3 plants. Leaves harvested from one plant were pooled as one biological repeat; n = 3 to 4, ±sd. n.d., not detected. (C) Total acyl group content in dry seeds of the wild type, fad4-2, and fad4-3. Thirty seeds were used for each repeat; n = 5, ±sd. (D) Seed weight and yield measurements of wild-type, fad4-2 and fad4-3 plants. For seed weight measurement, 200 seeds were used for each repeat, n = 3, ±sd. For seed yield measurement, seeds harvested from four plants grown in the same pot were used as one repeat, n = 3, ±sd. (E) Relative acyl group composition of seed lipid extracts from of the wild type, fad4-2, and fad4-3. 30 seeds were used for each repeat, n = 5, ±sd. Acyl groups with a molar percentage less than 0.5% were omitted. Where appropriate, Student’s t test was used to compare the wild type and each fad4 mutant (*P < 0.05; **P < 0.01).
Figure 9.
Figure 9.
Phenotypic Analysis of PLIP1-OX1 Embryos. (A) Morphology of the wild-type and PLIP1-OX1 siliques 9 d after flowering. The numbers indicate the length of siliques. n = 9 to 12, ±sd. Student’s t test was applied (**P < 0.01). Bar = 0.5 cm. (B) Differential interference contrast images of embryos isolated from siliques of WT and PLIP1-OX1 plants. Bars = 50 µm. Representative images are shown. (C) Pulse-chase labeling of developing embryos isolated from siliques of wild-type and PLIP1-OX1 plants. Equivalent volume (100 μL) of developing seeds were used for each time point. The first two time points represent the labeling pulse. Embryos were transferred to unlabeled medium after 1 h. Values represent the fraction of label in select individual lipids compared with label in total lipids. The top panels show four lipids, as indicated. The lower panels show PG and MGDG again, but on an expanded scale. Experiments were repeated three times on PLIP1-OX1 seeds and one time on PLIP1-OX2 seeds, with similar results. One representative result is shown.
Figure 10.
Figure 10.
Hypothesis for the Role of PLIP1 in Triacylglycerol Biosynthesis. The left panel depicts the wild type, the middle panel the PLIP1 overexpression lines, and the right panel the plip1 mutant. The thickness of the arrows indicates the relative fluxes in the three different lines. Reactions or sets of reactions are numbered as follows: (1) In the wild type (left panel), acyl exchange on PC involving desaturation of acyl groups by FAD2/3 provides one mechanism to introduce polyunsaturated FAs into PC. (2) A parallel mechanism to introduce PUFAs into PC involves PLIP1. In the chloroplast, PLIP1 hydrolyzes 18:3/16:1Δ3t- PG and other 16:1Δ3t-phosphatidylglycerol species at the sn-1 glyceryl position and releases 18:3 (carbon:double bonds) or other acyl groups at the sn-1 position. The released acyl group is exported to the ER and incorporated into the acyl-CoA pool and PC. (3) A head group exchange mechanism leads to diacylglycerol (DAG) formation from PC containing PUFAs. (4) TAG, which accumulates in lipid droplets (LDs), is formed by the action of DAG-acyltransferases, which can introduce additional acyl groups into DAG from the acyl-CoA pool. (5) Phospholipid-DAG acyltransferase provides an additional route for the incorporation of polyunsaturated FAs from PC into TAG. (6) DAG can also be formed by de novo assembly through the Kennedy pathway, which, however, is thought to play a minor role in the synthesis of TAGs in seeds. In the chloroplast, biosynthesis of PG and MGDG shares the precursor phosphatidic acid (PA), with more PA being shuttled to MGDG biosynthesis in the wild type. In PLIP1-OX lines (middle panel), both PG biosynthesis and degradation are accelerated, resulting in increased export of 18:3 and other acyl groups and their direct incorporation into PC (reaction 2). Direct incorporation of 18:3 competes with polyunsaturated FA formation by the acyl-editing pathway of PC involving FAD2/3 (reaction 1), but leads to increased flux of 18:3 into the end product TAG. As a result of increased PG turnover in chloroplasts of PLIP1-OX lines, PA is preferably shuttled into PG biosynthesis, which subsequently reduces its availability for MGDG assembly in the plastid visible in changes in the MGDG acyl composition. In the plip1 mutant (right panel), the PLIP1-dependent pathway is deficient, resulting in decreased TAG biosynthesis. Without the competing effect of PLIP1 on the acyl exchange reactions and FAD2/3, more 18:1 is converted to 18:3, explaining the altered acyl composition of TAG and other extraplastidic lipids.

Comment in

References

    1. Ajjawi I., Lu Y., Savage L.J., Bell S.M., Last R.L. (2010). Large-scale reverse genetics in Arabidopsis: case studies from the Chloroplast 2010 Project. Plant Physiol. 152: 529–540. - PMC - PubMed
    1. Alonso J.M., et al. (2003). Genome-wide insertional mutagenesis of Arabidopsis thaliana. Science 301: 653–657. - PubMed
    1. Andersson M.X., Dörmann P. (2009). Chloroplast membrane lipid biosynthesis and transport. In The Chloroplast, Sandelius A.S., Aronsson H., eds (Berlin, Heidelberg: Springer Berlin Heidelberg; ), pp. 125–158.
    1. Aronsson H., Jarvis P. (2002). A simple method for isolating import-competent Arabidopsis chloroplasts. FEBS Lett. 529: 215–220. - PubMed
    1. Bates P.D., Ohlrogge J.B., Pollard M. (2007). Incorporation of newly synthesized fatty acids into cytosolic glycerolipids in pea leaves occurs via acyl editing. J. Biol. Chem. 282: 31206–31216. - PubMed

MeSH terms