. 2017 Aug 15;199(4):1301-1307.
doi: 10.4049/jimmunol.1700267. Epub 2017 Jul 7.

Antigen Acquisition Enables Newly Arriving B Cells To Enter Ongoing Immunization-Induced Germinal Centers

Affiliations

Antigen Acquisition Enables Newly Arriving B Cells To Enter Ongoing Immunization-Induced Germinal Centers

Jackson S Turner et al. J Immunol. .

Abstract

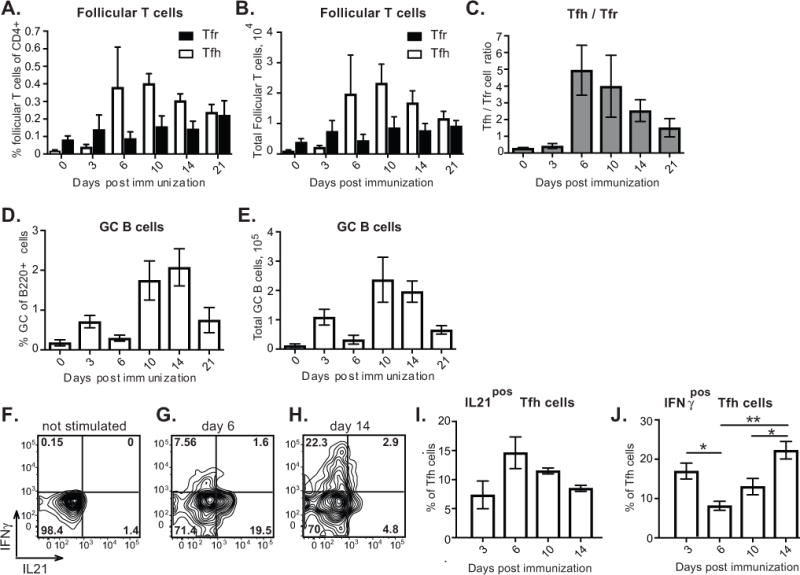
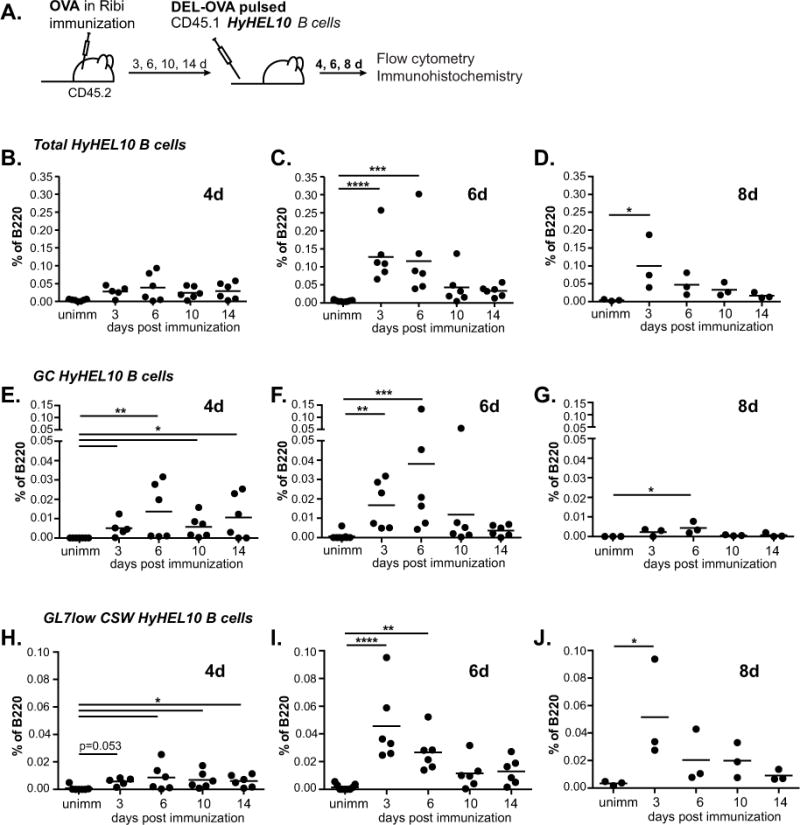
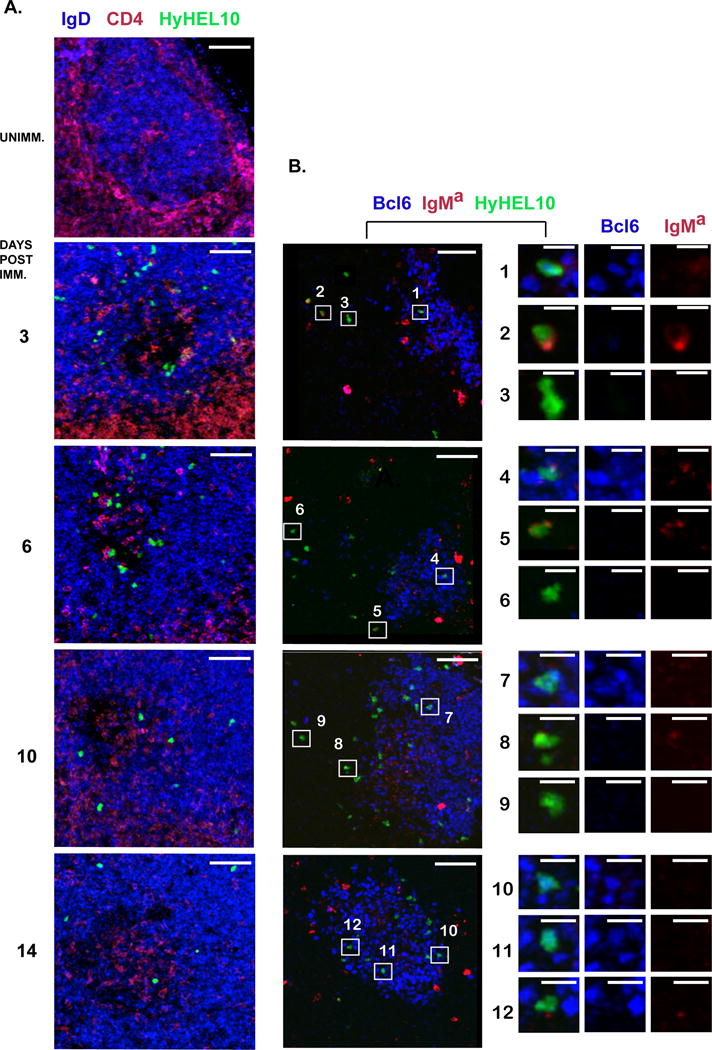
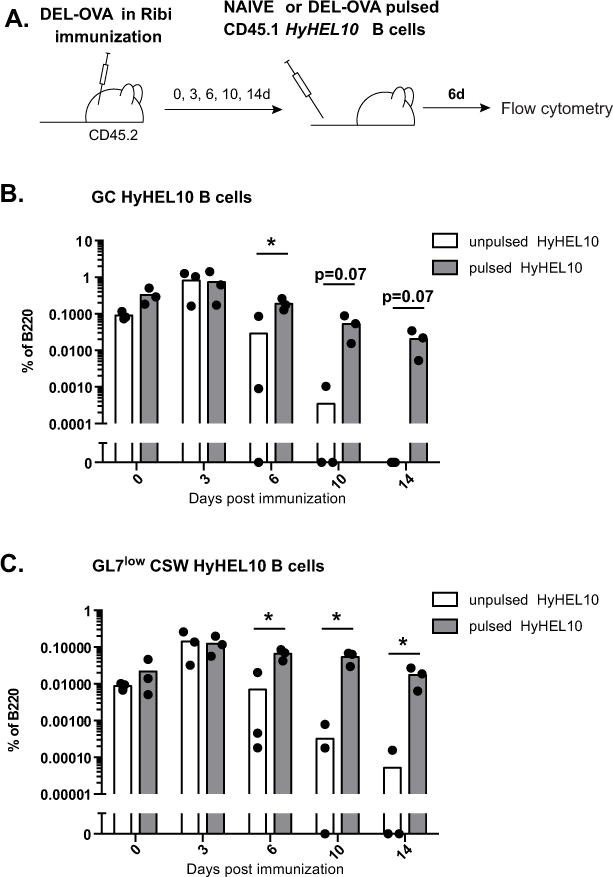
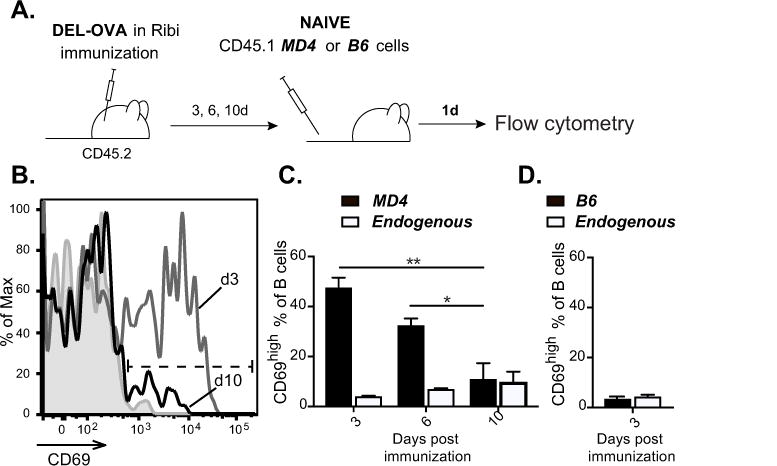
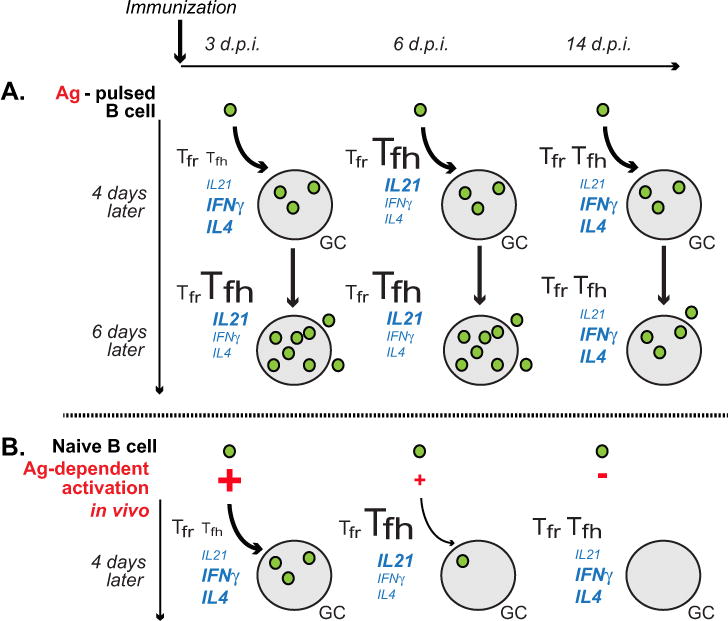
Modern vaccines must be designed to generate long-lasting, high-affinity, and broadly neutralizing Ab responses against pathogens. The diversity of B cell clones recruited into germinal center (GC) responses is likely to be important for the Ag-neutralization potential of the Ab-secreting cells and memory cells generated upon immunization. However, the factors that influence the diversity of B cell clones recruited into GCs are unclear. As recirculating naive Ag-specific B cells arrive in Ag-draining secondary lymphoid organs, they may join the ongoing GC response. However, the factors that limit their entry are not well understood, and it is not known how that depends on the stage of the ongoing follicular T cell and GC B cell response. In this article, we show that, in mice, naive B cells have a limited window of time during which they can undergo Ag-driven activation and join ongoing immunization-induced GC responses. However, preloading naive B cells with even a threshold-activating amount of Ag is sufficient to rescue their entry into the GC response during its initiation, peak, and contraction. Based on these results, we suggest that productive acquisition of Ag may be one of the main factors limiting entry of new B cell clones into ongoing immunization-triggered GC responses.


Figures

Figure 1
Figure 1. Kinetics of immunization-induced follicular T cell and GC B cell response
Flow cytometry analysis of follicular T cells and GC B cells in the inguinal lymph nodes (ILNs) of mice immunized with OVA in Ribi subcutaneously in the flanks and base of tail and into front foot pads. A, B, Follicular helper (white bars) and follicular regulatory (black bars) T cell frequencies of CD4+ B220 CD8 cells (A) and total numbers (B). C, Tfh/Tfr ratios. D, E, GC B cell frequencies of B220+ CD4 CD8 cells (D) and total numbers (E). F–J, Analysis of IL21 and IFNγ production by Tfh cells at various times following immunization. F–H, Representative examples of flow cytometry cytokine staining of FoxP3neg CXCR5highPD1high Tfh cells from ILNs of mice at 6 (F, G) and 14 (H) days post immunization, following their ex vivo stimulation with PMA and ionomycin (G, H) or without ex vivo stimulation (F). I, J, Fraction of Tfh cells that upregulate production of IL21 (I) and IFNγ (J) following ex vivo stimulation. Ordinary one-way ANOVA followed by Tukey’s multiple comparison test. *, p<0.05; **, p<0.01. Data are from 3–4 independent experiments, 1–3 mice per experiment. Data presented as mean ± SEM.
Figure 2
Figure 2. Antigen-exposed HyHEL10 B cells recruitment into B cell response during initiation, peak and resolution of the immunization-induced GC response
A, Experimental scheme. 5×10⁴ HyHEL10 B cells pulsed ex vivo with 0.5 μg/mL DEL-OVA were transferred into unimmunized control mice or mice preimmunized with OVA in Ribi s.c. and f.f.p. for 3, 6, 10 and 14 days. Flow cytometry analysis of ILNs was performed at 4, 6, and 8 days post HyHEL10 B cell transfer. B–J, Frequencies of total HyHEL10 (B–D), GL7high FAShigh IgDlow CD38low HyHEL10 (E–G), and GL7low IgMlow IgDlow HyHEL10 (H–J) B cells of B220+ CD4 CD8 cells at 4d (B, E, H), 6d (C, F, I) and 8d (D, G, J) following the transfer. Data are from 3–5 independent experiments. Each point represents a separate mouse. Kruskal-Wallis test followed by Dunn’s multiple comparisons test to unimmunized control. *, **, ***, **** represent p≤0.05, 0.01, 0.001, 0.0001 correspondingly.
Figure 3
Figure 3. Antigen-exposed HyHEL10 B cells can enter GCs during initiation, peak and resolution of the immunization-induced GC response
A, B, Examples of DEL-OVA pulsed HyHEL10 B cells’ anatomical positioning with respect to GCs. Confocal immunofluorescent analysis of 14–20 μm thick sections from the BLNs of mice which were either unimmunized or preimmunized for 3, 6, 10, or 14 days with OVA in Ribi, received DEL-OVA pulsed HyHEL10 B cells, and were analyzed at 6 days post transfer. Green Fluorescent Protein-expressing HyHEL10 B cells are shown as green. Sections were stained with fluorescently conjugated anti-CD4 (red) and anti-IgD (blue) antibodies in A or IgMa (red) and Bcl6 (blue) in B. Right column is a zoomed in view on the HyHEL10 cells selected in the middle column. Bars: left and middle columns - 50 μm, right column - 10 μm. In A: IgDlow areas outline GCs. In B: Bcl6 positive cells are GC B cells, IgManeg HyHEL10 B cells are class switched. Not associated with GFP-positive HyHEL10 cells red staining is likely due to nonspecific binding of IgMa, presumably to macrophages and FDCs. The data are representative of three independent experiments, 1 mouse per experiment.
Figure 4
Figure 4. Recruitment of naïve and DEL-OVA-pulsed HyHEL10 B cells into B cell response during initiation, peak and resolution of GC response in DEL-OVA immunized mice
A, Experimental scheme. 5×10⁴ HyHEL10 B cells (naïve or pulsed ex vivo with 0.5 μg/mL DEL-OVA) were transferred into mice preimmunized with DEL-OVA in Ribi s.c. for 0, 3, 6, 10 and 14 days. Flow cytometry analysis of ILNs was performed at 6 days post HyHEL10 B cell transfer. B, C, Frequencies of unpulsed (white bars) or DEL-OVA pulsed (gray bars) HyHEL10 GL7high FAShigh IgDlow CD38low (B) and GL7low IgMlow IgDlow HyHEL10 (C) B cells of B220+ CD4 CD8 cells. Data are from 3 independent experiments. Each point represents a separate mouse. *, p< 0.05. Multiple T-tests with Holm-Sidak method of correction for multiple comparisons.
Figure 5
Figure 5. Antigen-dependent activation of B cells at various times post immunization
A–D, Upregulation of CD69 by naïve MD4 or B6 B cells transferred into DEL-OVA preimmunized mice. A, Experimental scheme. 2–10×105 naïve CD45.1 MD4 B cells were transferred into mice preimmunized with DEL-OVA in Ribi s.c. for 3, 6, and 10 days or into control unimmunized mice. Similar number of CD45.1 B6 B cells were transferred into mice preimmunized with DEL-OVA in Ribi s.c. for 3 days. Flow cytometry analysis of ILNs was performed 1 day post B cell transfer. B, Representative flow cytometry analysis of MD4 B cell’s CD69 surface staining after their transfer into unimmunized mice (filled gray) or mice preimmunized for 3 (gray line) and 10 (black line) days. C, Frequencies of CD69high MD4 B cells (B220pos CD4neg CD8 neg CD45.1 pos CD45.2neg, black bars) and endogenous B cells (B220pos CD4neg CD8 neg CD45.1neg CD45.2pos, white bars). Data are from 3 independent experiments, 1 mouse per experiment. Ordinary one-way ANOVA followed by Tukey’s multiple comparison test. *, **, represent p<0.05, 0.01 correspondingly. D, Frequencies of CD69high B220pos CD4neg CD8 neg CD45.1 pos CD45.2 neg B6 B cells that were transferred at 3 days post DEL-OVA immunization (black bars) and CD45.1neg CD45.2pos endogenous B cells (white bars). Data are from 2 independent experiments, 4 recipient mice. Data presented as mean ± SEM.
Figure 6
Figure 6. Model of new B cell entry into GC response at various times after immunization
A, B cells exposed to a threshold activating dose of antigen and cognate T cell help can enter GC response with comparable efficiency at various times after immunization, including the initiation, peak and resolution phases of follicular T cell response. However, their subsequent expansion in GCs and formation of memory cells is reduced during the Tfh/GC resolution phase, possibly due to their decreased exposure to Tfh cell-produced IL21 and/or increased repression from Tfr cells. B, Following immunization, naïve antigen-specific B cells have a limited window of time when they can enter GC response. This window of time is determined by antigen-dependent activation of the naïve B cells entering into antigen-draining LNs. In mice immunized with DEL-OVA in Ribi s.c., antigen-dependent activation and entry into GCs starts to drop at 6 d.p.i.

Similar articles

Cited by

References

    1. Berek C, Berger A, Apel M. Maturation of the immune response in germinal centers. Cell. 1991;67(6):1121–1129. - PubMed
    1. Jacob J, Kelsoe G, Rajewsky K, Weiss U. Intraclonal generation of antibody mutants in germinal centres. Nature. 1991;354(6352):389–392. - PubMed
    1. Mesin L, Ersching J, Victora GD. Germinal Center B Cell Dynamics. Immunity. 2016;45(3):471–482. - PMC - PubMed
    1. Victora GD, Schwickert TA, Fooksman DR, Kamphorst AO, Meyer-Hermann M, Dustin ML, Nussenzweig MC. Germinal center dynamics revealed by multiphoton microscopy with a photoactivatable fluorescent reporter. Cell. 2010;143(4):592–605. - PMC - PubMed
    1. Gitlin AD, Shulman Z, Nussenzweig MC. Clonal selection in the germinal centre by regulated proliferation and hypermutation. Nature. 2014;509(7502):637–640. - PMC - PubMed

Publication types