. 2017 Aug 7;216(8):2443-2461.
doi: 10.1083/jcb.201607074. Epub 2017 Jul 7.

Mutation of the α-tubulin Tuba1a leads to straighter microtubules and perturbs neuronal migration

Affiliations

Mutation of the α-tubulin Tuba1a leads to straighter microtubules and perturbs neuronal migration

Richard Belvindrah et al. J Cell Biol. .

Abstract

Brain development involves extensive migration of neurons. Microtubules (MTs) are key cellular effectors of neuronal displacement that are assembled from α/β-tubulin heterodimers. Mutation of the α-tubulin isotype TUBA1A is associated with cortical malformations in humans. In this study, we provide detailed in vivo and in vitro analyses of Tuba1a mutants. In mice carrying a Tuba1a missense mutation (S140G), neurons accumulate, and glial cells are dispersed along the rostral migratory stream in postnatal and adult brains. Live imaging of Tuba1a-mutant neurons revealed slowed migration and increased neuronal branching, which correlated with directionality alterations and perturbed nucleus-centrosome (N-C) coupling. Tuba1a mutation led to increased straightness of newly polymerized MTs, and structural modeling data suggest a conformational change in the α/β-tubulin heterodimer. We show that Tuba8, another α-tubulin isotype previously associated with cortical malformations, has altered function compared with Tuba1a. Our work shows that Tuba1a plays an essential, noncompensated role in neuronal saltatory migration in vivo and highlights the importance of MT flexibility in N-C coupling and neuronal-branching regulation during neuronal migration.


Figures

Figure 1.
Figure 1.
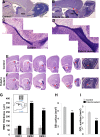
Alteration of the RMS in adult Tuba1a-mutant mice. (A and B) Low-magnification image of sagittal brain sections after Nissl staining in control (A) and mutant (B) brains. Note that the RMS is enlarged in the Tuba1a-mutant brain (red arrowheads). (C and D) Higher magnification of the RMS in the sagittal view is shown in control (C) and Tuba1a-mutant (D) brains, revealing an increase in RMS size in the mutant brain. (E and F) Low-magnification image of coronal brain sections after Nissl staining in control (E) and mutant (F) brains. Note that the RMS is enlarged in the mutant condition (F) at different rostral levels, and OB neurons are reduced. The GCL is outlined with white dashed lines. Arrowheads indicate the RMS. (G) RMS thickness was measured at three different rostrocaudal levels (RMS1, RMS2, and RMS3 according to the schema). Note the increased thickness of mutant RMS2 and RMS3. (H) The overall OB surface was measured in control and Tuba1a-mutant brains. Note the decreased OB size in the mutant. (I) The GCL surface was measured in control and Tuba1a-mutant brains. Note the decreased surface in the mutant. (G–I) **, P < 0.01; ***, P < 0.001. n = 5. Data are represented as mean ± SEM. LV, lateral ventricle. Bars: (A) 437 µm; (C) 87 µm; (E) 650 µm; (E and F, right) 175 µm.
Figure 2.
Figure 2.
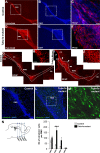
PSA-NCAM+ migrating neuron, GFAP+ glial fiber, and calretinin+ neuron differentiation defects in the mutant RMS. (A–F) Immunostaining of PSA-NCAM on sagittal sections (A and D) and counterstaining with DAPI (B and E) revealed a thin RMS in the control brain (A) compared with an enlarged RMS in the mutant (D). (C and F) Higher magnification of PSA-NCAM and DAPI staining in the regions outlined in B and E, respectively. Note the existence of PSA-NCAM+ neurons migrating in organized chains in the control brain (C), whereas in the region of accumulation of neurons in the mutant, the PSA-NCAM+ cells are more numerous and appear less organized (F). (G and I) Low-magnification images of GFAP immunostaining on sagittal sections in control and mutant brains. The RMS is outlined with dashed lines. A meshwork of GFAP+ fibers associated with the stream was observed in the control RMS (G), whereas in the mutant, the GFAP+ glial fibers cover a larger region where the accumulation of neurons is observed (I). Arrowheads indicate regions of dramatically enlarged GFAP staining. (H and J) Higher magnification of GFAP staining in the regions outlined in G and I, respectively. Note the existence of disorganized glial fibers in the mutant (J) compared with the control (H). (K–N) Calretinin immunostaining counterstained with DAPI in the RMS on sagittal brain sections from control (K) and mutant (L) brains. Note that, in the control brain, few calretinin+ cells were observed, whereas in the mutant brain, numerous calretinin+ cells were present in the RMS2 region. (M) An enlargement of the region outlined in L. Calretinin+ cells present complex morphologies. (N) Calretinin+ cells were quantified at four different levels of the RMS. Note the increase in the number (Nb) of calretinin+ neurons in mutant RMS2. ***, P < 0.001. n = 5. Data are represented as mean ± SEM. CC, corpus callosum; LV, lateral ventricle. Bars: (A) 140 µm; (C) 24 µm; (G) 210 µm; (H) 45 µm; (I) 210 µm; (J) 45 µm; (K) 60 µm; (M) 12 µm.
Figure 3.
Figure 3.
Expression of a Tuba1a S140G-mutant construct by electroporation in P0–P2 mouse pups impairs neuronal migration in the RMS. (A–C) Low-magnification images of GFP staining on sagittal brain sections after electroporation of GFP only (A), control WT Tuba1a (B), or Tuba1a S140G-mutant (C) ires GFP constructs at 5 dpe. (D–F) Higher magnifications of the OB are represented. Note the decreased number of GFP+ neurons in the OB from the brain electroporated with the mutant S140G construct. (G) Description of the three constructs used in this study: GFP only, control Tuba1a, and Tuba1a S140G constructs with GFP separated by an ires. The Dcx promoter controls expression. Schemas of the electroporation as well as the live-imaging system for slices from electroporated brains are shown. (H) Quantification of the percentage of GFP+ neurons per region (SVZ, RMS, and OB, as indicated in the schema) for GFP only, control Tuba1a, and Tuba1a S140G-mutant conditions. No significant differences were observed between GFP only and control Tuba1a conditions. Note the increase in the percentage of GFP+ neurons in the SVZ and the RMS but decrease in the OB for the S140G-mutant construct. *, P < 0.05; **, P < 0.01; ***, P < 0.001. n = 4–5. Data are represented as mean ± SEM. Bars: (A) 248 µm; (C) 64 µm.
Figure 4.
Figure 4.
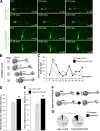
Impaired directionality after electroporation with the Tuba1a S140G-mutant construct. (A and B) Time-lapse video microscopy sequences for control Tuba1a (A) or S140G-mutant (B) constructs. An example of tracking for five different neurons is shown (numbered in color from one to five) within a video frame of 2 h 20 min (every 20 min) for both conditions. Rostrocaudal orientations are indicated in the first image of each sequence. Neurons migrated mainly tangentially along the RMS in the Tuba1a control condition (A), whereas with the Tuba1a S140G-mutant construct, the migration appeared less organized, showing more frequent changes of direction. (C and D) An example of the tracking of 15 neurons is shown in Tuba1a control (C) and Tuba1a S140G-mutant (D) conditions. Neurons migrated less unidirectionally after electroporation with the Tuba1a S140G-mutant construct. Bars: (A and B) 56 µm; (C and D) 26 µm.
Figure 5.
Figure 5.
Speed, directionality, and branching defects after electroporation of the Tuba1a S140G-mutant construct. (A) Time-lapse video films were analyzed from control and S140G-mutant conditions, and mean instantaneous speeds were determined (short red line). Note the decrease in the mean speed of migration at 5 dpe with the mutant S140G construct. n = 140 cells per group from three independent experiments. (B) Quantification of directionality of migration: each cell was plotted according to the angle formed from the location at the beginning to the end of the migratory sequence (from 0 to 360° with 0°/360° being dorsal, 90° caudal, 180° ventral, and 270° rostral). Note the significant decrease in the percentage of neurons migrating tangentially and rostrally toward the OB after electroporation with the Tuba1a mutant S140G construct. n = 90 cells per group from three independent experiments. (C) The density of distribution for control Tuba1a instantaneous speed measurements was determined. The analysis revealed a bimodal distribution validated with Hartigan’s dip test (P < 0.01) and the AIC. n = 140 cells from control condition from three independent experiments. The threshold speed between fast- and slow-migrating neurons was defined mathematically at 75.48 µm/h. (D) Description of the four different categories of branching morphology used for the quantifications in E and F. Each category corresponds to a level of complexity of the migrating neurons with one, two, three, or four processes. (E) Among control Tuba1a neurons, no significant difference in category between fast and slow migration was observed (white and light gray bars). For Tuba1a S140G, less category 1 and more category 2 neurons were observed for both fast and slow migration (dark gray and black bars). Slow migrating mutant neurons (dark gray) showed even less category 1 and more category 2 neurons. n = 90 cells per group. Data are represented as mean ± SEM. (F) For control and mutant Tuba1a non-unidirectional neurons, a strong decrease of category 1 was observed concomitantly with an increase of category 2. For the mutant Tuba1a S140G neurons (salmon and orange bars specifically), the decrease of category 1 non-unidirectional neurons was associated with an increase of category 2, 3, and 4 neurons. Note that increased morphological complexity is associated with lack of directionality in both control and mutant conditions; however, mutant neurons show higher complexities. n = 100 cells per group. Data are represented as mean ± SEM. *, P < 0.05; **, P < 0.01; ***, P < 0.001.
Figure 6.
Figure 6.
Expression of the Tuba1a S140G-mutant construct impairs N–C coupling during neuronal migration. (A) Example of a time-lapse video microscopy sequence with acquisition frames each 5 min showing a GFP-positive neuron expressing PACT-mKO1 (orange fluorescence) located at the centrosome together with either the control (top) or S140G-mutant (bottom) Tuba1a. The corresponding phase of the saltatory cycle step is noted, as also schematized in B. The distance between the edge of the soma and the centrosome was measured in each time frame as indicated with the double arrow and dashed line. Bars, 13 µm. (B) Schematic representation of the forward progression of the centrosome during one saltatory cycle. Note that this distance is minimal at the beginning of a saltatory cycle, becomes maximal when the centrosome moves forward in the swelling, and then returns to minimum when the nucleus rejoins the centrosome. (C) Representative examples of soma edge/centrosome distance oscillations in Tuba1a-GFP and Tuba1a-S140G-GFP neurons. Durations of saltatory cycles and soma edge/centrosome maximum distances were automatically extracted from these oscillations with a Matlab script. n = 93 cells for control and n = 79 cells for mutant from three independent experiments. (D) The mean duration of a cycle of soma edge–centrosome coupling is significantly increased with the Tuba1a S140G-mutant construct. n = 93 cells for control and n = 79 cells for mutant. Data are represented as mean ± SEM. (E) The maximum distance between the soma edge and centrosome was increased with the Tuba1a S140G-mutant construct. n = 93 cells for control and n = 79 cells for mutant from three independent experiments. Data are represented as mean ± SEM. (F) Schematic representation of two examples at the completion of the saltatory cycle: either the nucleus moves forward toward the centrosome (forward class) or the centrosome moves backward toward the nucleus (backward class). (G) Increased percentage of the backward population among the mutant neurons and decreased percentage of forward class. *, P < 0.05; **, P < 0.01. n = 30 cells for control and n = 40 cells for mutant from three independent experiments.
Figure 7.
Figure 7.
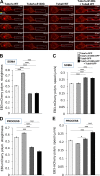
MT dynamic defects after expression of the Tuba1a S140G-mutant construct. (A) Example of a 24-s time-lapse video microscopy sequence of EB3-mCherry tracking in Neuro-2a cells after transfection with control WT Tuba1a, mutant Tuba1a S140G, control WT Tuba8, and combined Tuba1a S140G + Tuba8 WT. The EB3-mCherry spots were tracked every 6 s in two different cellular compartments: in the soma (yellow dots) and in the process (blue dots in the outlined rectangle). Bars, 6.4 µm. (B–E) EB3-mCherry polymerization (polym.) straightness (B and D) is significantly increased in the soma of cells expressing the mutant Tuba1a S140G construct (B, first two bars). EB3-mCherry polymerization speed is not changed with the mutant Tuba1a S140G construct in either the soma or process (C and E). Comparatively, control Tuba8 overexpression decreased EB3-mCherry polymerization straightness both in the soma and the process (B and D) and increased the EB3-mCherry polymerization speed in the soma (C and E). Coexpression of mutant Tuba1a S140G together with Tuba8 did not restore the EB3-mCherry polymerization straightness nor the speed to the control level and gave results similar to Tuba8 alone. *, P < 0.05; ***, P < 0.001. n = 8,253 spots for control Tuba1a; n = 8,933 spots for Tuba1a S140G mutant; n = 8,450 spots for control Tuba8; n = 9,182 for Tuba1a S140G mutant + Tuba8 in the soma; n = 2,185 spots for control Tuba1a; n = 1,450 spots for Tuba1a S140G mutant; n = 2,242 spots for control Tuba8; and n = 3,065 for Tuba1a S140G mutant + Tuba8 in the processes. Data are represented as mean ± SEM.
Figure 8.
Figure 8.
Structural comparisons between Tuba1a, Tuba1a S140G, and Tuba8. (A) Structural superposition of time-averaged tubulin structures from WT (light green) and S140G-mutant (red) simulations. The S140G mutation is shown as well as the GTP binding sites. (B) Time evolution of intradimer angle between α-core helix H7 and β-core helix H7 in WT (green) and S140G mutant (red). The inset shows a lower angle distribution in the mutant than in WT, indicating straighter dimers for the mutant tubulin dimer. ***, P < 0.001. Data are represented as mean ± SEM. A total of 6,250 points was used. (C) The S140G mutant forms an additional salt-bridge triad (SBT) buried at the intradimer interface (highlighted in box). The α-tubulin is colored in blue, and β-tubulin is in green. (D and E) Higher magnification of intradimer interface for WT and S140G-mutant tubulin. The salt-bridge triad in the S140G mutant (highlighted in box) involves α:Asp98 with β:Arg162 and β:Arg251. The α:Asp98–β:Arg251 interaction is absent in WT. (F) Structural model superposition of Tuba1a (brown) and Tuba8 (light blue) revealed slight differences. (G) Electrostatic analysis of Tuba1a and Tuba8. The H1-S2 loop cooperates with the M loop from adjacent protofilaments. Whereas Tuba1a presents cooperative positive charges in the H1-S2 loop, Tuba8 presents a more negative charge distribution.

Comment in

References

    1. Abdollahi M.R., Morrison E., Sirey T., Molnar Z., Hayward B.E., Carr I.M., Springell K., Woods C.G., Ahmed M., Hattingh L., et al. . 2009. Mutation of the variant α-tubulin TUBA8 results in polymicrogyria with optic nerve hypoplasia. Am. J. Hum. Genet. 85:737–744. 10.1016/j.ajhg.2009.10.007 - DOI - PMC - PubMed
    1. Alfonso J., Penkert H., Duman C., Zuccotti A., and Monyer H.. 2015. Downregulation of sphingosine 1-phosphate receptor 1 promotes the switch from tangential to radial migration in the OB. J. Neurosci. 35:13659–13672. 10.1523/JNEUROSCI.1353-15.2015 - DOI - PMC - PubMed
    1. Alushin G.M., Lander G.C., Kellogg E.H., Zhang R., Baker D., and Nogales E.. 2014. High-resolution microtubule structures reveal the structural transitions in αβ-tubulin upon GTP hydrolysis. Cell. 157:1117–1129. 10.1016/j.cell.2014.03.053 - DOI - PMC - PubMed
    1. Bahi-Buisson N., and Cavallin M.. 2016. Tubulinopathies Overview. In GeneReviews. Pagon R.A., Adam M.P., Ardinger H.H., Wallace S.E., Amemiya A., Bean L.J.H., Bird T.D., Ledbetter N., Mefford H.C., Smith R.J.H., and Stephens K., editors. University of Washington, Seattle: Available at: https://www.ncbi.nlm.nih.gov/books/NBK350554/ - PubMed
    1. Bahi-Buisson N., Poirier K., Boddaert N., Saillour Y., Castelnau L., Philip N., Buyse G., Villard L., Joriot S., Marret S., et al. . 2008. Refinement of cortical dysgeneses spectrum associated with TUBA1A mutations. J. Med. Genet. 45:647–653. 10.1136/jmg.2008.058073 - DOI - PubMed

Publication types

MeSH terms

LinkOut - more resources