. 2017 Jul 7;7(1):4897.
doi: 10.1038/s41598-017-05078-6.

Lamin B1 levels modulate differentiation into neurons during embryonic corticogenesis

Affiliations

Lamin B1 levels modulate differentiation into neurons during embryonic corticogenesis

Sameehan Mahajani et al. Sci Rep. .

Abstract

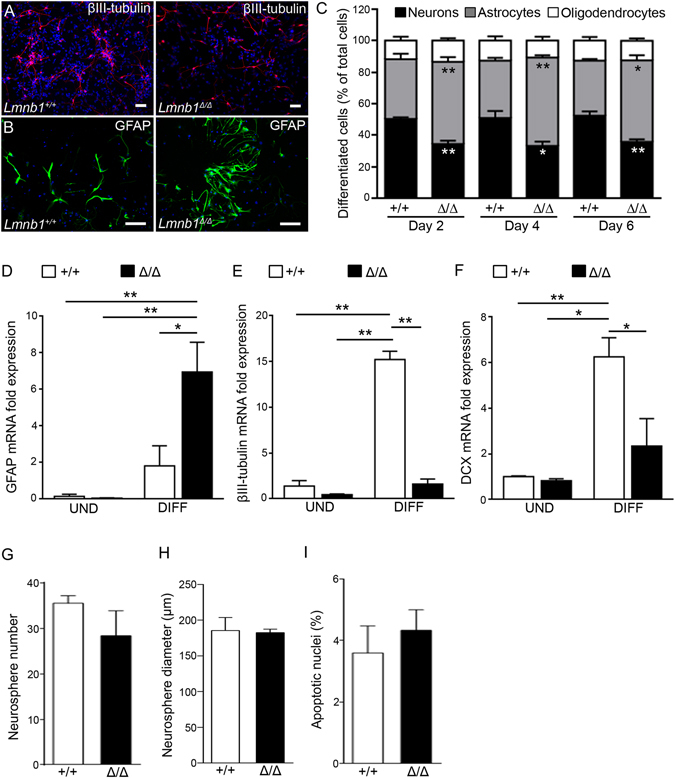
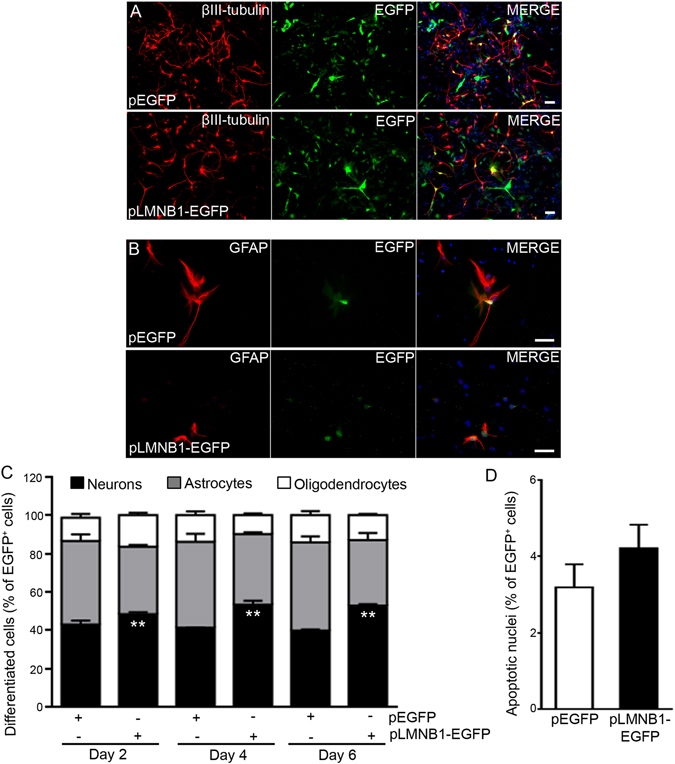
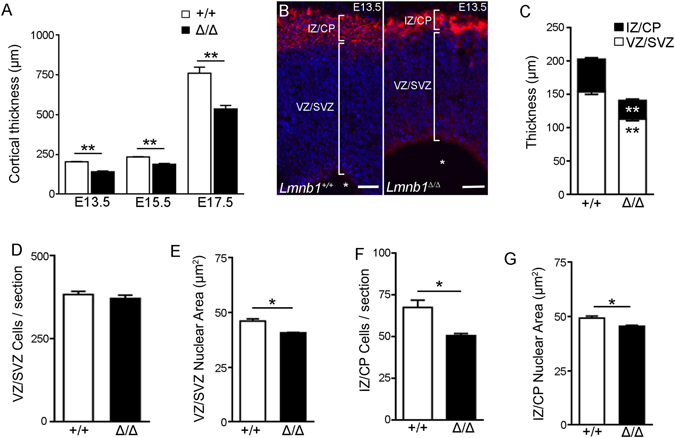
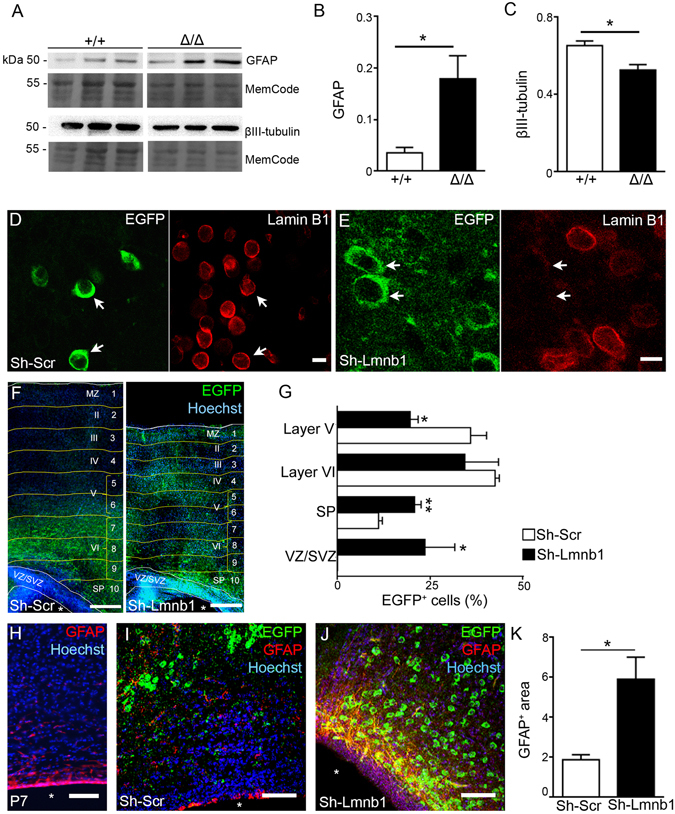
Lamin B1, a key component of the nuclear lamina, plays an important role in brain development. Ablation of endogenous Lamin B1 (Lmnb1) in the mouse strongly impairs embryonic brain development and corticogenesis. However, the mechanisms underlying these neurodevelopmental effects are unknown. Here, we report that Lamin B1 levels modulate the differentiation of murine neural stem cells (NSCs) into neurons and astroglial-like cells. In vitro, endogenous Lmnb1 depletion favors NSC differentiation into glial fibrillar acidic protein (GFAP)-immunoreactive cells over neurons, while overexpression of human Lamin B1 (LMNB1) increases the proportion of neurons. In Lmnb1-null embryos, neurogenesis is reduced, while in vivo Lmnb1 silencing in mouse embryonic brain by in utero electroporation of a specific Lmnb1 sh-RNA results in aberrant cortical positioning of neurons and increased expression of the astrocytic marker GFAP in the cortex of 7-day old pups. Together, these results indicate that finely tuned levels of Lamin B1 are required for NSC differentiation into neurons, proper expression of the astrocytic marker GFAP and corticogenesis.


Conflict of interest statement

The authors declare that they have no competing interests.

Figures

Figure 1
Figure 1
Lmnb1 deficiency alters NSC differentiation into neurons and astrocytes. NSCs were cultured from Lmnb1 +/+ and Lmnb1 Δ/Δ embryos and differentiated for 2, 4 or 6 days. (A,B) Fluorescence images of immunoreactivity for βIII-tubulin (A; red) and GFAP (B; green) in NSCs differentiated for 4 days. Nuclei are counterstained with DAPI (blue). Scale bars: 50 µm. (C) Quantitative analysis of differentiated cells. Data represent the percentage of neurons, astrocytes, and oligodendrocytes out of the total number of cells. *p < 0.05, **p < 0.01 vs Lmnb1+/+ at the respective differentiation time, Student’s t-test. Approximately 1000 cells for each staining condition were quantified in 3 independent experiments. (DF) Quantitative analysis of mRNA expression of cellular markers GFAP (D), βIII-tubulin (E) and DCX (F) in NSCs from Lmnb1 +/+ and Lmnb1 Δ/Δ in an undifferentiated state or after differentiation for 4 days. *p < 0.05, **p < 0.01, two-way ANOVA followed by Bonferroni post hoc test. (G,H) Quantitative analysis of NSC self-renewal. Number (G) and diameter (H) of neurospheres were measured 72 h after seeding single cell suspensions of equal numbers of cells (200 cells/embryo). (I) Quantitative analysis of pyknotic nuclei in Lmnb1 +/+ and Lmnb1 Δ/Δ NSCs. A total of 300 cells were counted. In all graphs, bars represent the average ± SEM from 3 independent experiments.
Figure 2
Figure 2
LMNB1 overexpression increases the proportion of NSC differentiation into neurons. NSCs from C57BL6/J embryos were transfected with pEGFP or pLMNB1-EGFP and differentiated for 2, 4 or 6 days. (AD) Fluorescence images of immunoreactivity for βIII-tubulin (A,B; red), GFAP (C,D; red) and EGFP (AD; green) in NSCs differentiated for 4 days. Nuclei are counterstained with DAPI (blue). Scale bars: 50 µm. (E) Quantitative analysis of differentiated cells. Data represent the percentage of neurons, astrocytes, and oligodendrocytes co-expressing EGFP out of the total number of EGFP+ cells. *p < 0.05, **p < 0.01 vs pEGFP transfected cells at the respective differentiation time, Student’s t-test. Approximately 400 EGFP+ cells were quantified for each staining condition in 3 independent experiments. (F) Quantitative analysis of NSC pyknotic nuclei. 150 cells per condition were counted. In all graphs, bars represent the average ± SEM from 3 independent experiments.
Figure 3
Figure 3
Lmnb1 deficiency significantly impairs corticogenesis and neurogenesis during embryonic development. (A) Quantitative analysis of cortical thickness in brain sections from Lmnb1 +/+ and Lmnb1 Δ/Δ embryos at E13.5, E15.5 and E17.5. (B) Fluorescence images of cortical coronal sections of E13.5 Lmnb1 +/+ and Lmnb1 Δ/Δ brains immunostained for βIII-tubulin (red) and counterstained with Hoechst 33342 (blue). Scale bars: 20 µm. (C) Quantitative analysis of the thickness of the IZ/CP and VZ/SVZ in E13.5 brains. **p < 0.01 vs respective brain area of Lmnb1+/+. (D) Cell counts in the VZ/SVZ in E13.5 brains. (E) Nuclear area of VZ/SVZ cells in E13.5 brains. (F) Cell counts in the IZ/CP in E13.5 brains. (G) Nuclear area of IZ/CP cells in E13.5 brains. In all graphs, bars represent the average ± SEM from 3 independent experiments. *p < 0.05, **p < 0.01, Student’s t-test.
Figure 4
Figure 4
Knockdown of Lmnb1 increases GFAP protein expression in vivo. GFAP protein expression was analyzed in brain homogenates of Lmnb1 Δ/Δ and Lmnb1 +/+ embryos or in brain sections of P7 C57BL6/J pups after Lmnb1 silencing. (A) Western blot analysis of GFAP, βIII-tubulin, Lmnb1 and actin. (B,C) Quantitative analysis of GFAP (A,B) and βIII-tubulin (A,C) in E17.5 Lmnb1 Δ/Δ and Lmnb1 +/+ brain lysates. Data are normalized on MemCode. Graph bars represent the average ± SEM. n = 3/genotype, *p < 0.05; **p < 0.01, Student’s t-test. Cropped blots presented in Fig. 4A and full-length blots are presented in Supplementary Fig. S5. (D,E) Maximal projections of confocal z-stack images of immunoreactivity for Lmnb1 (red) and EGFP (green) in P7 brains after electroporation with sh-Scr (D) and sh-Lmnb1 (E) Arrows indicate corresponding electroporated cells. Scale bars: 5 µm. (F) Fluorescence confocal images of immunoreactivity for EGFP (green) in P7 brains electroporated with sh-Scr and sh-Lmnb1 plasmids. Scale bars: 50 µm. White lines delimit the VZ/SVZ and the cortical superficial boundary. Yellow lines delineate bins (Hevner et al.), which are identified by Arabic numbers. Roman numerals indicate cortical layers I-VI. MZ, marginal zone; SP, sub-plate. Nuclei were counterstained by Hoechst 33342 dye (blue); white asterisks identify the ventricle. (G) Quantitative analysis of EGFP+ cells in P7 brains as a function of their position in the cortex after electroporation with sh-Scr and sh-Lmnb1. Graph bars represent the average percentage of EGFP+ cells/layer ± SEM from 3 independent experiments. *p < 0.05, **p < 0.01 vs respective layer in sh-Scr, Student’s t-test. (H) Fluorescence confocal images of immunoreactivity for GFAP (red) in naïve P7 C57BL6/J brain. (I,J) Maximal projections of confocal z-stack images of immunoreactivity for GFAP (red) and EGFP (green) in P7 C57BL6/J brains electroporated with sh-Scr (I) or sh-Lmnb1 (J). In (HJ), nuclei are counterstained with Hoechst 33342 (blue). White asterisks identify the ventricle. Scale bars: 100 µm. (K) Quantitative analysis of area immunoreactive for GFAP in electroporated brains. GFAP+ area is expressed as percentage of section area. Graph bars represent the average ± SEM, n = 3; *p < 0.05, Student’s t-test.

References

    1. Zastrow MS, Flaherty DB, Benian GM, Wilson KL. Nuclear titin interacts with A- and B-type lamins in vitro and in vivo. J. Cell Sci. 2006;119:239–249. doi: 10.1242/jcs.02728. - DOI - PubMed
    1. Broers JL, et al. A- and B-type lamins are differentially expressed in normal human tissues. Histochem. Cell Biol. 1997;107:505–517. doi: 10.1007/s004180050138. - DOI - PubMed
    1. Tunnah D, Sewry CA, Vaux D, Schirmer EC, Morris GE. The apparent absence of lamin B1 and emerin in many tissue nuclei is due to epitope masking. J. Mol. Histol. 2005;36:337–344. doi: 10.1007/s10735-005-9004-7. - DOI - PubMed
    1. Worman HJ, Lazaridis I, Georgatos SD. Nuclear lamina heterogeneity in mammalian cells. Differential expression of the major lamins and variations in lamin B phosphorylation. J. Biol. Chem. 1988;263:12135–12141. - PubMed
    1. Lin ST, Fu YH. miR-23 regulation of lamin B1 is crucial for oligodendrocyte development and myelination. Dis. Model. Mech. 2009;2:178–188. doi: 10.1242/dmm.001065. - DOI - PMC - PubMed

Publication types

MeSH terms

Substances