

John's Equation-based Consistency Condition and Corrupted Projection Restoration in Circular Trajectory Cone Beam CT
- PMID: 28687756
- PMCID: PMC5501796
- DOI: 10.1038/s41598-017-05249-5
John's Equation-based Consistency Condition and Corrupted Projection Restoration in Circular Trajectory Cone Beam CT
Abstract
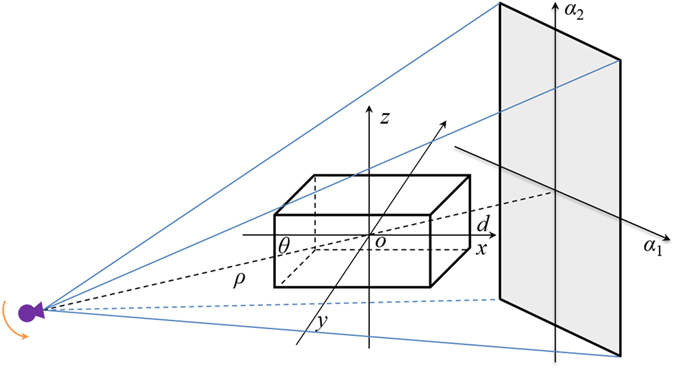
In transmitted X-ray tomography imaging, the acquired projections may be corrupted for various reasons, such as defective detector cells and beam-stop array scatter correction problems. In this study, we derive a consistency condition for cone-beam projections and propose a method to restore lost data in corrupted projections. In particular, the relationship of the geometry parameters in circular trajectory cone-beam computed tomography (CBCT) is utilized to convert an ultra-hyperbolic partial differential equation (PDE) into a second-order PDE. The second-order PDE is then transformed into a first-order ordinary differential equation in the frequency domain. The left side of the equation for the newly derived consistency condition is the projection derivative of the current and adjacent views, whereas the right side is the projection derivative of the geometry parameters. A projection restoration method is established based on the newly derived equation to restore corrupted data in projections in circular trajectory CBCT. The proposed method is tested in beam-stop array scatter correction, metal artifact reduction, and abnormal pixel correction cases to evaluate the performance of the consistency condition and corrupted projection restoration method. Qualitative and quantitative results demonstrate that the present method has considerable potential in restoring lost data in corrupted projections.
Conflict of interest statement
The authors declare that they have no competing interests.
Figures


Similar articles
-
Projection correlation based view interpolation for cone beam CT: primary fluence restoration in scatter measurement with a moving beam stop array.Phys Med Biol. 2010 Nov 7;55(21):6353-75. doi: 10.1088/0031-9155/55/21/002. Epub 2010 Oct 12. Phys Med Biol. 2010. PMID: 20938067
-
Combining scatter reduction and correction to improve image quality in cone-beam computed tomography (CBCT).Med Phys. 2010 Nov;37(11):5634-44. doi: 10.1118/1.3497272. Med Phys. 2010. PMID: 21158275
-
Binary moving-blocker-based scatter correction in cone-beam computed tomography with width-truncated projections: proof of concept.Phys Med Biol. 2017 Mar 21;62(6):2176-2193. doi: 10.1088/1361-6560/aa5913. Epub 2017 Jan 12. Phys Med Biol. 2017. PMID: 28079527
-
Analytic image reconstruction from partial data for a single-scan cone-beam CT with scatter correction.Med Phys. 2015 Nov;42(11):6625-40. doi: 10.1118/1.4933423. Med Phys. 2015. PMID: 26520753
-
A general framework and review of scatter correction methods in x-ray cone-beam computerized tomography. Part 1: Scatter compensation approaches.Med Phys. 2011 Jul;38(7):4296-311. doi: 10.1118/1.3599033. Med Phys. 2011. PMID: 21859031 Review.
Cited by
-
Investigating the missing-wedge problem in small-angle X-ray scattering tensor tomography across real and reciprocal space.J Synchrotron Radiat. 2024 Sep 1;31(Pt 5):1327-1339. doi: 10.1107/S1600577524006702. Epub 2024 Aug 28. J Synchrotron Radiat. 2024. PMID: 39196770 Free PMC article.
References
Publication types
LinkOut - more resources
Full Text Sources
Other Literature Sources
