. 2017 Jul 7;7(1):4845.
doi: 10.1038/s41598-017-04936-7.

Nuclear receptors connect progenitor transcription factors to cell cycle control

Affiliations

Nuclear receptors connect progenitor transcription factors to cell cycle control

Marta Neto et al. Sci Rep. .

Abstract

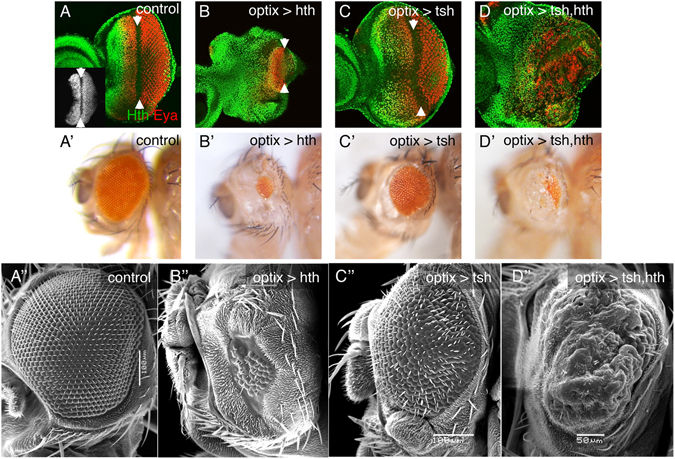
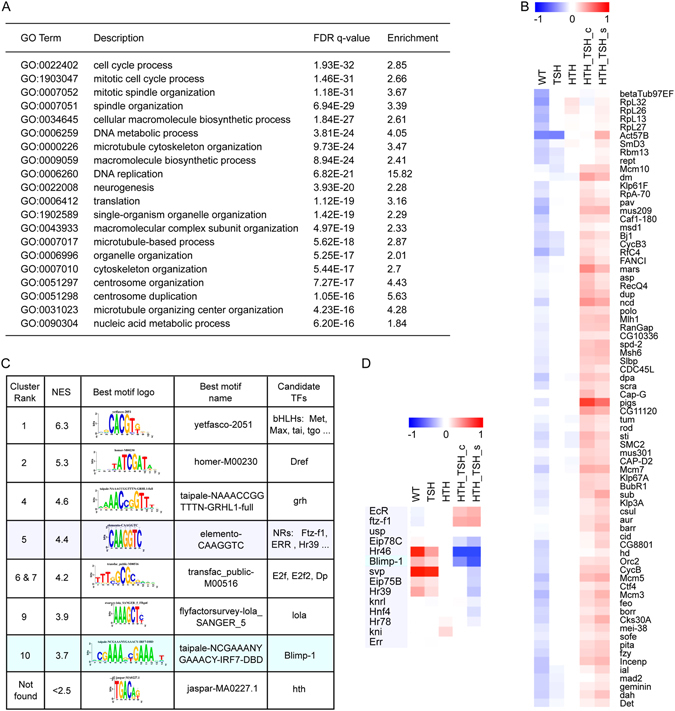
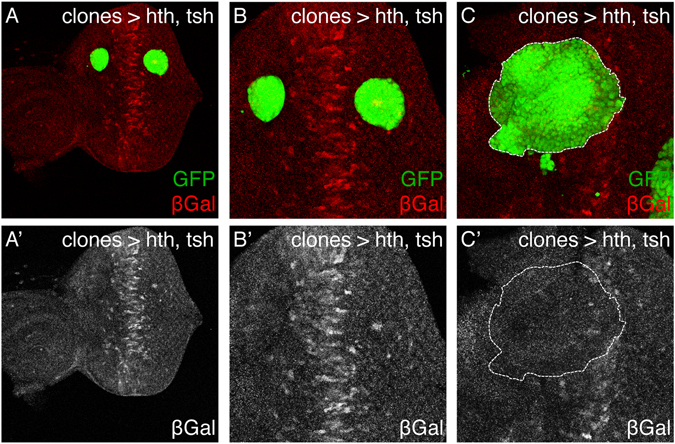
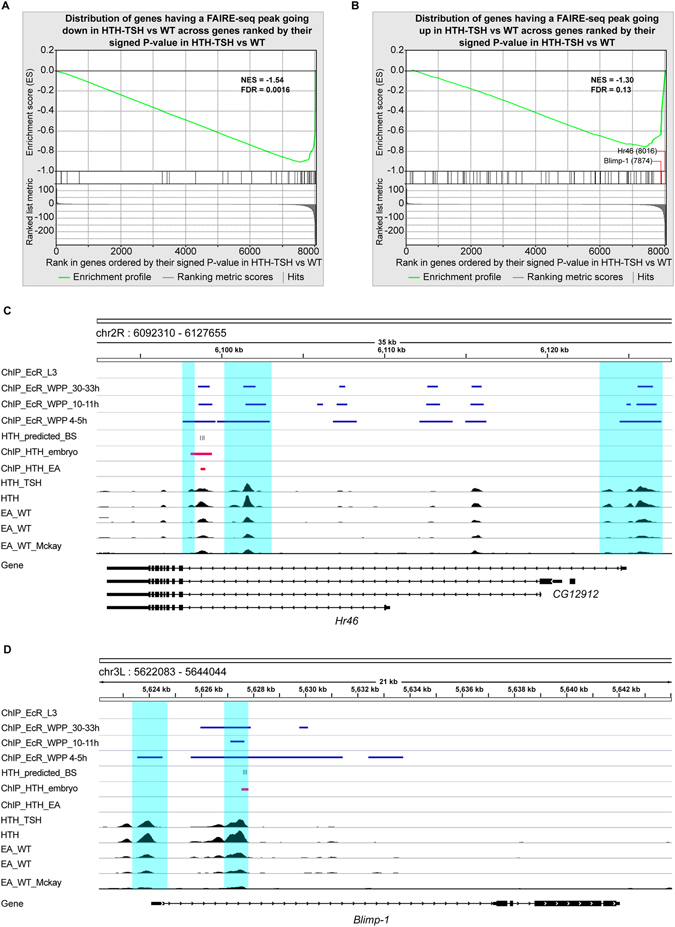
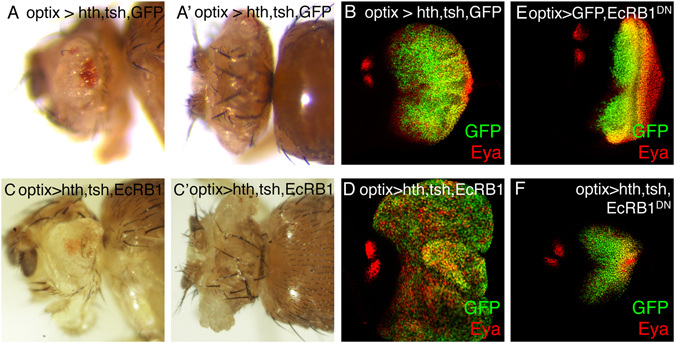
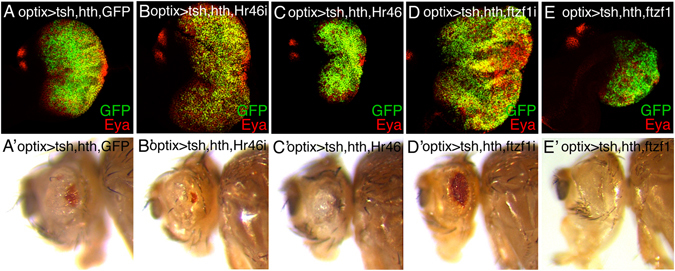
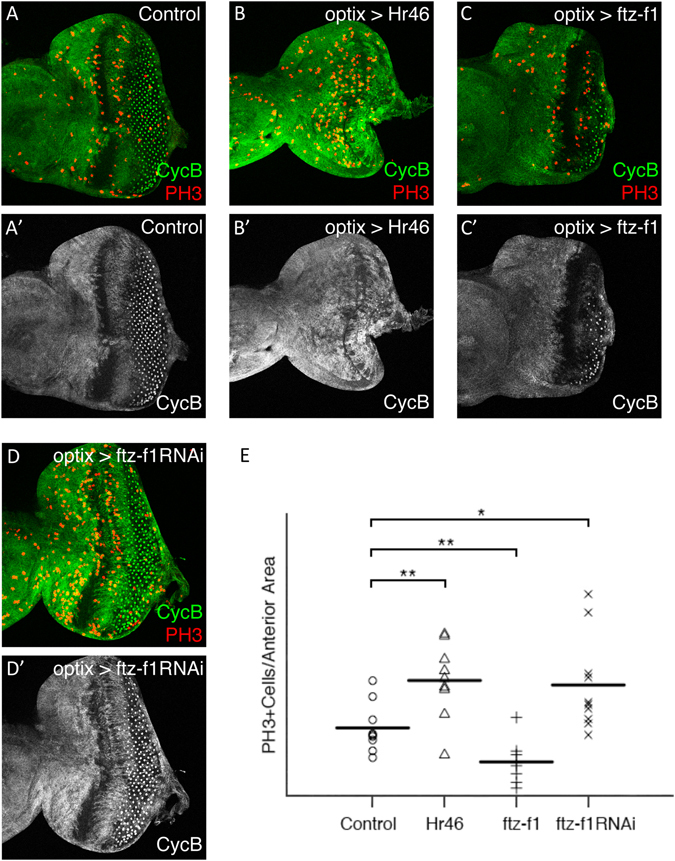
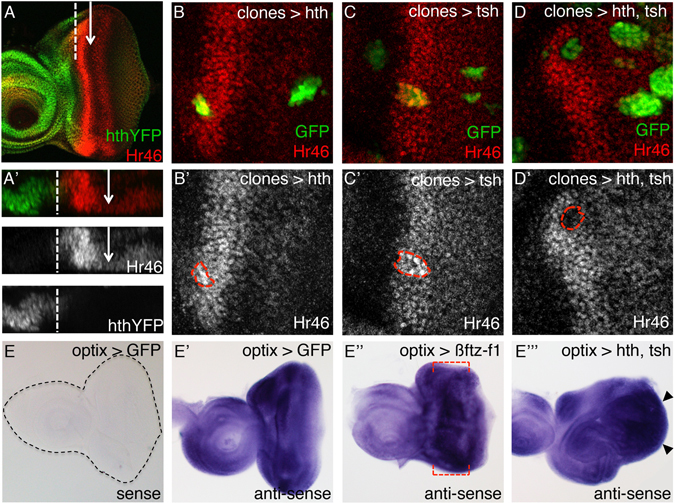
The specification and growth of organs is controlled simultaneously by networks of transcription factors. While the connection between these transcription factors with fate determinants is increasingly clear, how they establish the link with the cell cycle is far less understood. Here we investigate this link in the developing Drosophila eye, where two transcription factors, the MEIS1 homologue hth and the Zn-finger tsh, synergize to stimulate the proliferation of naïve eye progenitors. Experiments combining transcriptomics, open-chromatin profiling, motif analysis and functional assays indicate that these progenitor transcription factors exert a global regulation of the proliferation program. Rather than directly regulating cell cycle genes, they control proliferation through an intermediary layer of nuclear receptors of the ecdysone/estrogen-signaling pathway. This regulatory subnetwork between hth, tsh and nuclear receptors might be conserved from Drosophila to mammals, as we find a significant co-overexpression of their human homologues in specific cancer types.


Conflict of interest statement

The authors declare that they have no competing interests.

Figures

Figure 1
Figure 1
Forced maintenance of hth and tsh expression results in overgrowth and differentiation arrest. Late third instar (L3) eye discs (AD) and adult heads (A’D’ and A”D”) from control (optix > GFP) and hth- (optix > hth), tsh- (optix > tsh) or hth + tsh- (optix > hth + tsh) expressing animals. The GFP expression driven by optix > (optix2/3-GAL4; UAS-GFP) is shown in the inset in (A). Discs are stained with anti-Eya and anti-Hth. Anterior is left, dorsal is up (this orientation will be maintained throughout). (A’D’) Lateral views of adult heads of the same genotypes as above. (A”D”) SEM images of lateral views of adult heads of the corresponding genotypes. Overexpression of hth (optix > hth) results in a reduced eye disc area and smaller adult eye (B,B”). tsh-overexpressing flies (optix > tsh) show almost normal discs and retinal morphology (CC”). However, overexpression of hth and tsh (optix > hth + tsh), results in overgrown eye discs showing abnormal folds. Adult heads develop a small retinal patch and an overgrowth of indistinct cuticle (D,D”).
Figure 2
Figure 2
Transcriptomic profile of of hth + tsh cells. (A) Gene Ontology enrichment of genes up-regulated in hth + tsh compared to control eye discs (EA). Analysis performed by GOrilla on a ranked list of genes sorted by (signed) −log10(p-value). The sign indicates that up-regulated genes are on top (logFC > 0) and down-regulated genes (logFC < 0) are on the bottom of the list. (B) Heatmap with row-normalized expression values of the most significantly up-regulated cell-cycle related genes. (C) Motif enrichment on the up-regulated genes (770 genes, selected as the “leading edge” of the GOrilla analysis for cell cycle enrichment). Enrichment analysis is performed by i-cisTarget and enriched motifs are clustered within i-cisTarget using STAMP. NES = Normalized Enrichment Score (>2.5 is significant). The Hth motif was not found enriched. (D) Heat map of expression profiles of motif related Nuclear Receptor genes and Blimp-1, showing strongest up-regulation of EcR and ftz-f1, and strongest down-regulation of Hr46 and Blimp-1.
Figure 3
Figure 3
Co-expression of hth + tsh downregulate EcR signaling. hth + tsh-expressing clones (marked with GFP) induced in an Ecdysone Response Element-lacZ (EcRE-Z) background analyzed in L3 eye discs. lacZ expression is monitored with an anti-β galactosidase antibody (β gal). EcRE-Z is expressed straddling the morphogenetic furrow (dashed line) exclusively (A,A’). hth + tsh-clones overlapping the EcRE-Z domain repress its expression (B), while clones elsewhere do not (A,A’). (A) is a lower magnification view of the disc shown in (A’) where the whole pattern of EcRE-Z can be seen. The EcRE-Z sinla is shown separately in the lower panels.
Figure 4
Figure 4
FAIRE-seq open chromatin profiling of hth + tsh cells. (A) Gene Set Enrichment Analysis (GSEA, ref. 100) compares gene expression changes with open chromatin changes. In the x-axis are all genes, ranked by the significance p-value of differential expression of control versus hth + tsh samples, with genes down-regulated in hth + tsh on the left, and genes up-regulated on the right. The tested gene sets (shown as black vertical lines) are genes with nearby (in 5 kb upstream and intronic space) FAIRE-seq peaks showing significant decreased accessibility. The correlation between both is highly significant (FDR < 0.001). (B) Similar plot, comparing changes in gene expression with genes showing nearby FAIRE-peaks with increased accessibility. In this case, the correlation is not significant, but the most down-regulated nuclear receptors Hr46 and Blimp-1 (indicated) are among the few genes showing peaks with increased accessibility. (C,D) Genomic view of Hr46 (C) and Blimp-1 (D) showing FAIRE-seq open chromatin profilling data for optix > hth + tsh (“HTH_TSH”), optix > hth (“HTH”) and control eye-antennal discs (EA) (EA_WT: black wiggle plot tracks); Hth ChIP-seq target regions in embryo and EA disc are shown with a red line; HTH-TSH versus WT differentially open chromatin peaks are highlighted with a cyan background; and prediction of binding sites within Hth ChIP peaks are shown as black ticks marked as “HTH_predicted_BS” (Cluster-Buster) motif score >6 using FlyFactorSurvey PWMs). In addition, ModENCODE EcR ChIP data are shown with a blue line, for L3 (modEncode_2640), WPP 4–5 h (modEncode_3398), WPP 10–11 h (modEncode_2641), WPP 30–33 h (modEncode_2642).
Figure 5
Figure 5
EcR functionally interacts with hth + tsh in inducing tissue overgrowth. Adult heads (A,C lateral and A’,C’ dorsal views) and eye discs (B,D) of optix > GFP:hth + tsh + GFP (A,B) and optix > GFP:hth + tsh + EcRB1 (C,D) (note that both genotypes harbor equal number of UAS-transgenes). Co-overexpression of EcRB1 enhances the overgrowth of lateral head cuticle and eye disc tissue. Comparison between eye discs overexpressing a dominant-negative form of the EcRB1 (E: optix > GFP + EcRB1-DN) and the co-overexpression of EcRB1-DN with hth + tsh (F: optix > GFP:hth + tsh + EcRB1-DN). Expression of EcRB1 causes a mild reduction in eye disc size (E). Coexpression of EcRB1-DN suppresses the overgrowth produced by hth + tsh (compare F with B). Discs are stained with anti-GFP (green) and anti-Eya (red) antibodies.
Figure 6
Figure 6
Nuclear receptors Hr46 and ftz-f1 functionally interact with hth + tsh in inducing tissue overgrowth. L3 eye discs, stained for GFP and Eya (upper panel) and lateral views of adult heads (lower panels) of the indicated genotypes (note that all genotypes harbor equal number of UAS-transgenes). RNAi-mediated attenuation (B) or overexpression (C) of Hr46 enhances or suppresses, respectively, the hth + tsh-induced eye disc overgrowth. In adults, however, while Hr46 attenuation enhances the tissue overgrowth/loss of eye (B’), its overexpression reduces the tissue overgrowth, but without rescuing retina differentiation (C’). RNAi-mediated attenuation of ftz-f1 (D) or overexpression (E) enhances or suppresses, respectively, the hth + tsh-induced eye disc overgrowth. In this case, ftz-f1 attenuation partly rescues the eye reduction of hth + tsh individuals (D’). Co-overexpression of ftz-f1 suppresses the lateral cuticle overgrowth, without rescuing retina differentiation (E’).
Figure 7
Figure 7
Altering Hr46 and ftz-f1 expression regulates proliferation of eye progenitors. L3 eye discs of the indicated genotypes (AD) stained for cyclinB (cycB, green) and the mitotic marker PH3 (red). Merged and cycB signals are shown. Control discs are optix>+. PH3-positive cells were counted in the anterior region of the eye disc, where undifferentiated progenitors reside (outlined in white in A). In (A’) the double-headed arrow marks the width of the G1-arrested domain (see text for details). (E) Statistical analysis of the mitotic density (PH3 + cells/anterior area) indicates that overexpression of Hr46 and RNAi-mediated attenuation of ftz-f1 result in increased proliferation. Note that in both genotypes the G1 arrested domain is narrower than in the control (especially for optix > Hr46; B). On the contrary, overexpression of ftz-f1 results in reduced proliferation.
Figure 8
Figure 8
The expression domains of hth and Hr46 are complementary and co-expression of hth + tsh repress Hr46. hth:YFP late L3 disc stained with anti-Hr46 (A) and the corresponding optical cross-section (A’). The arrow marks the morphogenetic furrow (MF) and the dashed line marks the boundary between Hth and Hr46 expression. Clones overexpressing hth (B,B’), tsh (C,C’) or both (D,D’), marked by GFP (and outlined with the red dashed line), were induced in the eye imaginal disc at 48–72 hours after egg laying. Discs are stained with anti-Hr46. (EE”’) in situ hybridization with ftz-f1 anti-sense probe in third-instar eye discs from optix > GFP (E’), optix > ßfyz-f1 (E”) and optix > hth.tsh (E”’) larvae. ftz-f1 sense probe was used as a control in optix > GFP eye discs (black dashed line outlines the disc) (E). ftz-f1 is transcribed in control eye discs in a dynamic pattern, with high expression in the anterior region and lower levels in the most posterior region. Red dashed lines mark the region where ftz-f1 expression is expected to be higher in optix > ßfyz-f1 discs. hth + tsh discs show higher ftz-f1 levels (black arrowheads mark the regions with especially strong ftz-f1 transcription).

Similar articles

Cited by

References

    1. Buckingham M, Rigby PW. Gene regulatory networks and transcriptional mechanisms that control myogenesis. Dev Cell. 2014;28:225–38. doi: 10.1016/j.devcel.2013.12.020. - DOI - PubMed
    1. Gottgens B. Regulatory network control of blood stem cells. Blood. 2015;125:2614–2620. doi: 10.1182/blood-2014-08-570226. - DOI - PubMed
    1. Cvekl A, Ashery-Padan R. The cellular and molecular mechanisms of vertebrate lens development. Development. 2014;141:4432–47. doi: 10.1242/dev.107953. - DOI - PMC - PubMed
    1. Arda HE, Benitez CM, Kim SK. Gene regulatory networks governing pancreas development. Dev Cell. 2013;25:5–13. doi: 10.1016/j.devcel.2013.03.016. - DOI - PMC - PubMed
    1. Peter IS, Davidson EH. A gene regulatory network controlling the embryonic specification of endoderm. Nature. 2011;474:635–9. doi: 10.1038/nature10100. - DOI - PMC - PubMed

Publication types