

Transcriptomic analysis identifies a role of PI3K-Akt signalling in the responses of skeletal muscle to acute hypoxia in vivo
- PMID: 28688178
- PMCID: PMC5577531
- DOI: 10.1113/JP274556
Transcriptomic analysis identifies a role of PI3K-Akt signalling in the responses of skeletal muscle to acute hypoxia in vivo
Abstract
Key points: Changes in gene expression that occur within hours of exposure to hypoxia in in vivo skeletal muscles remain unexplored. Two hours of hypoxia caused significant down-regulation of extracellular matrix genes followed by a shift at 6 h to altered expression of genes associated with the nuclear lumen while respiratory and blood gases were stabilized. Enrichment analysis of mRNAs classified by stability rates suggests an attenuation of post-transcriptional regulation within hours of hypoxic exposure, where PI3K-Akt signalling was suggested to have a nodal role by pathway analysis. Experimental measurements and bioinformatic analyses suggested that the dephosphorylation of Akt after 2 h of hypoxic exposure might deactivate RNA-binding protein BRF1, hence resulting in the selective degradation of mRNAs.
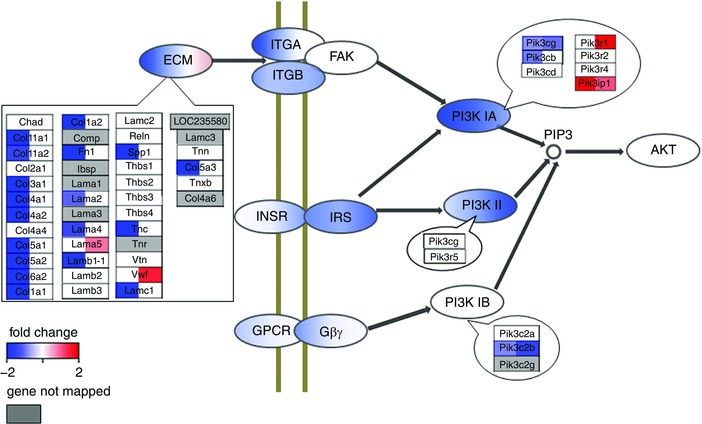
Abstract: The effects of acute hypoxia have been widely studied, but there are few studies of transcriptional responses to hours of hypoxia in vivo, especially in hypoxia-tolerant tissues like skeletal muscles. We used RNA-seq to analyse gene expression in plantaris muscles while monitoring respiration, arterial blood gases, and blood glucose in mice exposed to 8% O2 for 2 or 6 h. Rapid decreases in blood gases and a slower reduction in blood glucose suggest stress, which was accompanied by widespread changes in gene expression. Early down-regulation of genes associated with the extracellular matrix was followed by a shift to genes associated with the nuclear lumen. Most of the early down-regulated genes had mRNA half-lives longer than 2 h, suggesting a role for post-transcriptional regulation. These transcriptional changes were enriched in signalling pathways in which the PI3K-Akt signalling pathway was identified as a hub. Our analyses indicated that gene targets of PI3K-Akt but not HIF were enriched in early transcriptional responses to hypoxia. Among the PI3K-Akt targets, 75% could be explained by a deactivation of adenylate-uridylate-rich element (ARE)-binding protein BRF1, a target of PI3K-Akt. Consistent decreases in the phosphorylation of Akt and BRF1 were experimentally confirmed following 2 h of hypoxia. These results suggest that the PI3K-Akt signalling pathway might play a role in responses induced by acute hypoxia in skeletal muscles, partially through the dephosphorylation of ARE-binding protein BRF1.
Keywords: gene expression; hypoxia; skeletal Muscle.
© 2017 The Authors. The Journal of Physiology © 2017 The Physiological Society.
Figures


Similar articles
-
Early activation of mTORC1 signalling in response to mechanical overload is independent of phosphoinositide 3-kinase/Akt signalling.J Physiol. 2011 Apr 1;589(Pt 7):1831-46. doi: 10.1113/jphysiol.2011.205658. Epub 2011 Feb 7. J Physiol. 2011. PMID: 21300751 Free PMC article.
-
Hypoxia up-regulates hypoxia-inducible factor-1alpha transcription by involving phosphatidylinositol 3-kinase and nuclear factor kappaB in pulmonary artery smooth muscle cells.Mol Biol Cell. 2007 Dec;18(12):4691-7. doi: 10.1091/mbc.e07-04-0391. Epub 2007 Sep 26. Mol Biol Cell. 2007. PMID: 17898080 Free PMC article.
-
PI3K/Akt contributes to increased expression of Toll-like receptor 4 in macrophages exposed to hypoxic stress.Biochem Biophys Res Commun. 2012 Mar 16;419(3):466-71. doi: 10.1016/j.bbrc.2012.02.015. Biochem Biophys Res Commun. 2012. PMID: 22424098
-
Regulation of hypoxia-inducible factor-1alpha protein level during hypoxic conditions by the phosphatidylinositol 3-kinase/Akt/glycogen synthase kinase 3beta pathway in HepG2 cells.J Biol Chem. 2003 Aug 15;278(33):31277-85. doi: 10.1074/jbc.M300763200. Epub 2003 May 22. J Biol Chem. 2003. PMID: 12764143
-
PI3K/Akt signaling transduction pathway, erythropoiesis and glycolysis in hypoxia (Review).Mol Med Rep. 2019 Feb;19(2):783-791. doi: 10.3892/mmr.2018.9713. Epub 2018 Dec 3. Mol Med Rep. 2019. PMID: 30535469 Free PMC article. Review.
Cited by
-
Hypoxia regulates human mast cell adhesion to fibronectin via the PI3K/AKT signaling pathway.Cell Adh Migr. 2020 Dec;14(1):106-117. doi: 10.1080/19336918.2020.1764690. Cell Adh Migr. 2020. PMID: 32427041 Free PMC article.
-
Genetic variation in PTPN1 contributes to metabolic adaptation to high-altitude hypoxia in Tibetan migratory locusts.Nat Commun. 2018 Nov 26;9(1):4991. doi: 10.1038/s41467-018-07529-8. Nat Commun. 2018. PMID: 30478313 Free PMC article.
-
Normobaric hypoxia shows enhanced FOXO1 signaling in obese mouse gastrocnemius muscle linked to metabolism and muscle structure and neuromuscular innervation.Pflugers Arch. 2023 Nov;475(11):1265-1281. doi: 10.1007/s00424-023-02854-4. Epub 2023 Sep 1. Pflugers Arch. 2023. PMID: 37656229 Free PMC article.
-
Yap/Taz activity is associated with increased expression of phosphoglycerate dehydrogenase that supports myoblast proliferation.Cell Tissue Res. 2024 Mar;395(3):271-283. doi: 10.1007/s00441-023-03851-w. Epub 2024 Jan 6. Cell Tissue Res. 2024. PMID: 38183459 Free PMC article.
References
-
- Alvarez‐Tejado M, Naranjo‐Suarez S, Jimenez C, Carrera AC, Landazuri MO & del Peso L (2001). Hypoxia induces the activation of the phosphatidylinositol 3‐kinase/Akt cell survival pathway in PC12 cells: protective role in apoptosis. J Biol Chem 276, 22368–22374. - PubMed
-
- Arshi M, Cardinal J, Hill RJ, Davies PS & Wainwright C (2010). Asthma and insulin resistance in children. Respirology 15, 779–784. - PubMed
Publication types
MeSH terms
Substances
Grants and funding
LinkOut - more resources
Full Text Sources
Other Literature Sources
Molecular Biology Databases