

Clinical role of electrocochleography in children with auditory neuropathy spectrum disorder
- PMID: 28688553
- PMCID: PMC5538887
- DOI: 10.1016/j.ijporl.2017.05.026
Clinical role of electrocochleography in children with auditory neuropathy spectrum disorder
Abstract
Objectives: To assess electrocochleography (ECochG) to tones as an instrument to account for CI speech perception outcomes in children with auditory neuropathy spectrum disorder (ANSD).
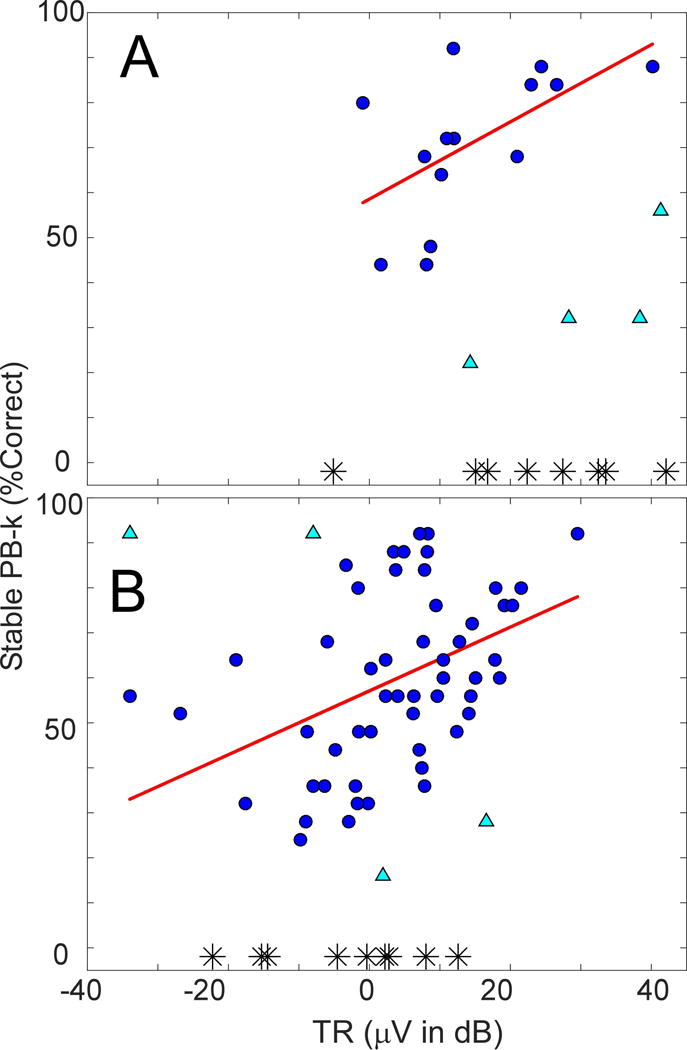
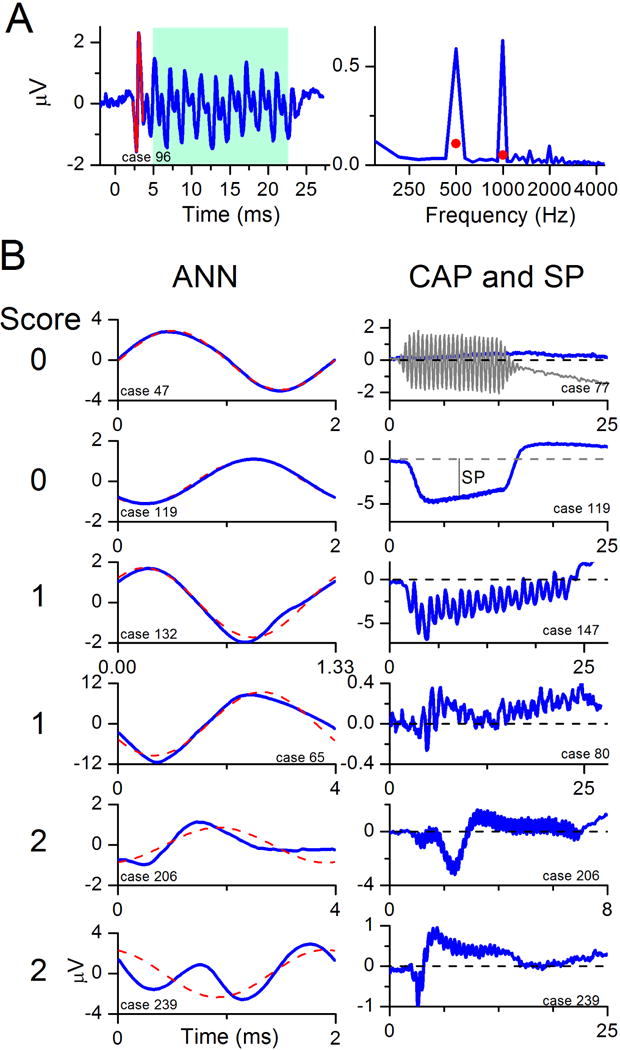
Materials & methods: Children (<18 years) receiving CIs for ANSD (n = 30) and non-ANSD (n = 74) etiologies of hearing loss were evaluated with ECochG using tone bursts (0.25-4 kHz). The total response (TR) is the sum of spectral peaks of responses across frequencies. The compound action potential (CAP) and the auditory nerve neurophonic (ANN) in ECochG waveforms were used to estimate nerve activity and calculate nerve score. Performance on open-set monosyllabic word tests was the outcome measure. Standard statistical methods were applied.
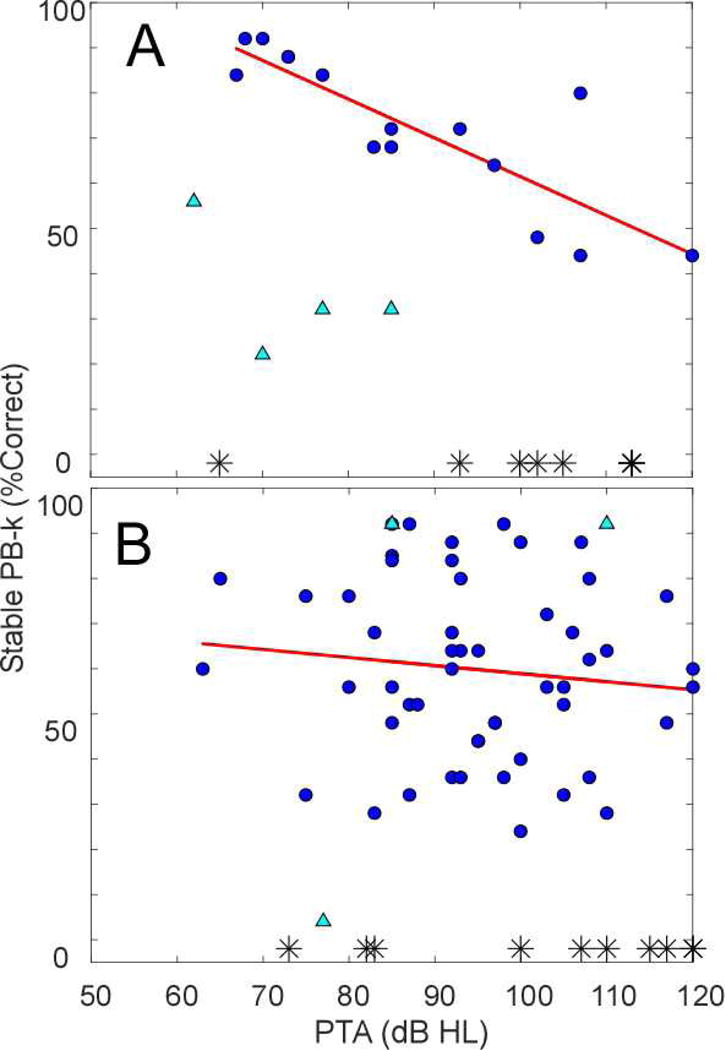
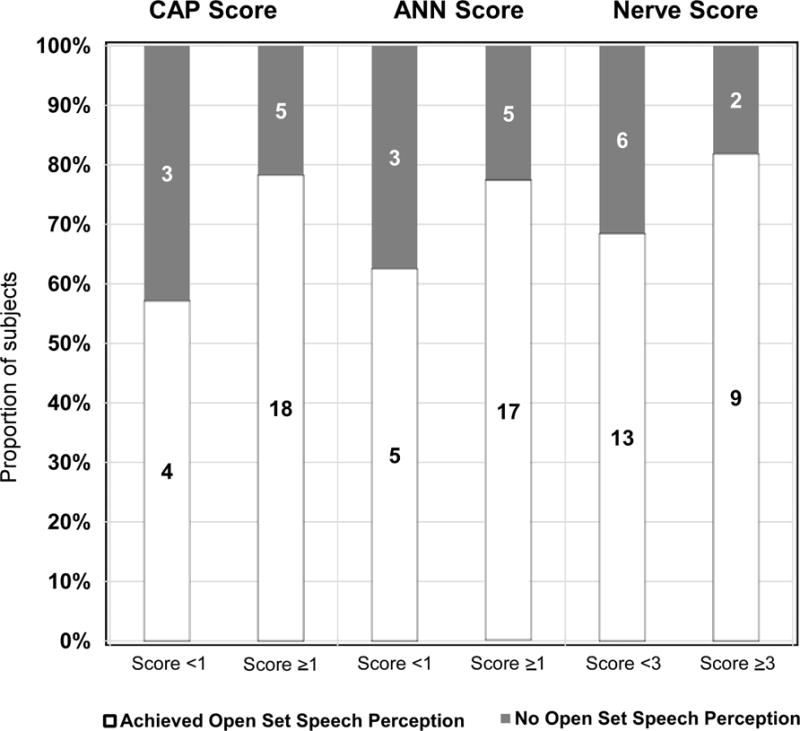
Results: On average, TR was larger in ANSD than in non-ANSD subjects. Most ANSD (73.3%) and non-ANSD (87.8%) subjects achieved open-set speech perception; TR accounted for 33% and 20% of variability in the outcomes, respectively. In the ANSD group, the PTA accounted for 69.3% of the variability, but there was no relationship with outcomes in the non-ANSD group. In both populations, nerve score was sensitive in identifying subjects at risk for not acquiring open-set speech perception, while the CAP and the ANN were more specific.
Conclusion: In both subject groups, the TRs correlated with outcomes but these measures were notably larger in the ANSD group. There was also strong correlation between PTA and speech perception outcome in ANSD group. In both subject populations, weaker evidence of neural activity was related to failure to achieve open-set speech perception.
Keywords: Auditory nerve neurophonic; Auditory neuropathy spectrum disorder; Cochlear implants; Compound action potential; Electrocochleography.
Copyright © 2017 Elsevier B.V. All rights reserved.
Conflict of interest statement
The remaining authors have no conflict of interest to disclose.
Figures
References
-
- Santarelli R, Starr A, Michalewski HJ, Arslan E. Clin Neurophysiol 2008. 2008;119:1028–1041. - PubMed
-
- Rance G, Starr A. Brain 2015. 2015;138:3141–3158. - PubMed
-
- Zeng FG, Oba S, Garde S, Sininger Y, Starr A. Neuroreport 1999. 1999;10:3429–3435. - PubMed
-
- Zeng FG, Kong YY, Michalewski HJ, Starr A. J Neurophysiol 2005. 2005;93:3050–3063. - PubMed
-
- Starr A, Picton TW, Sininger Y, Hood LJ, Berlin CI. Brain 1996. 1996;119(Pt 3):741–753. - PubMed
Publication types
MeSH terms
Supplementary concepts
Grants and funding
LinkOut - more resources
Full Text Sources
Other Literature Sources
Miscellaneous
