. 2017 Oct;96(7):705-714.
doi: 10.1016/j.ejcb.2017.06.007. Epub 2017 Jun 23.

VAMP8-mediated NOX2 recruitment to endosomes is necessary for antigen release

Affiliations

VAMP8-mediated NOX2 recruitment to endosomes is necessary for antigen release

Ilse Dingjan et al. Eur J Cell Biol. 2017 Oct.

Abstract

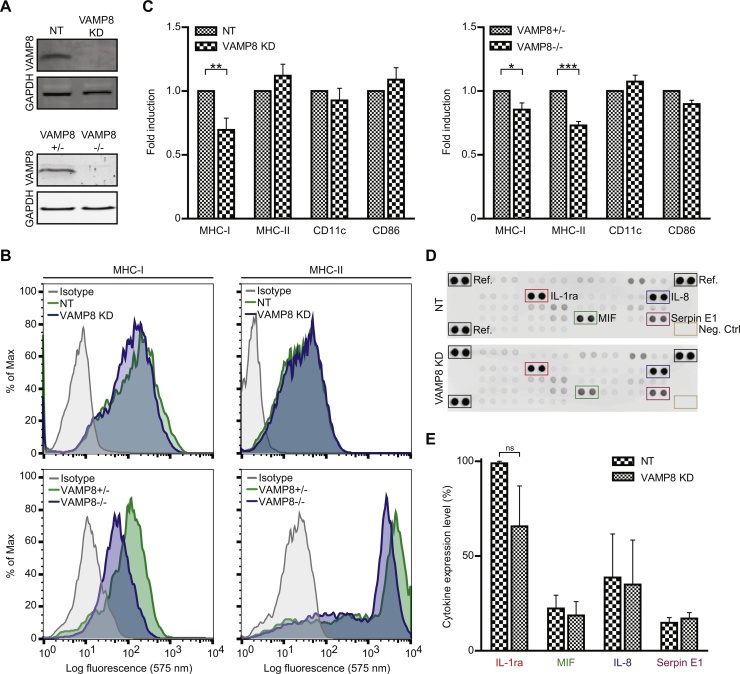
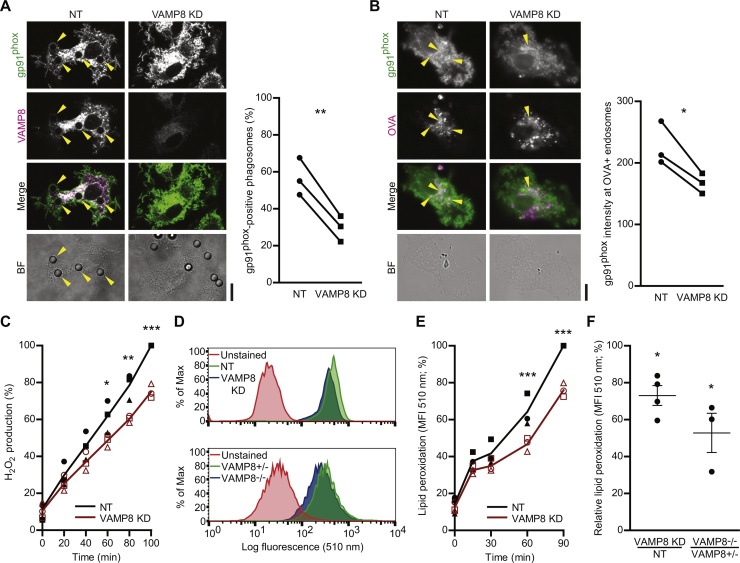
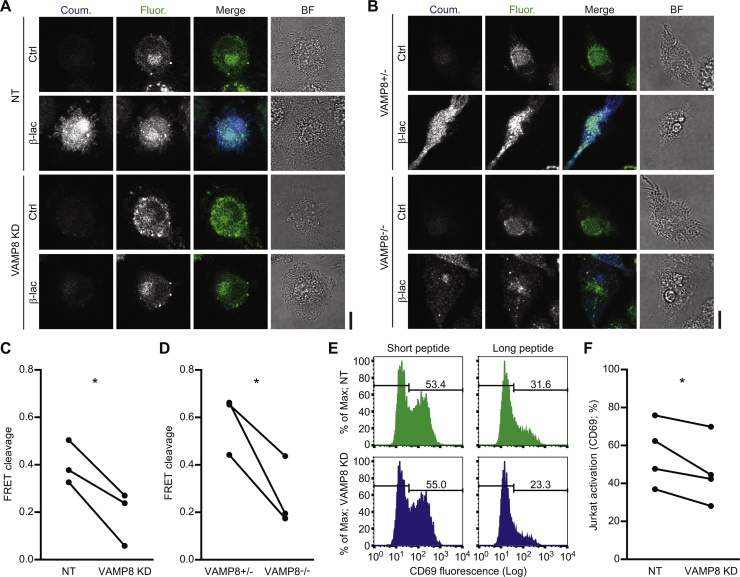
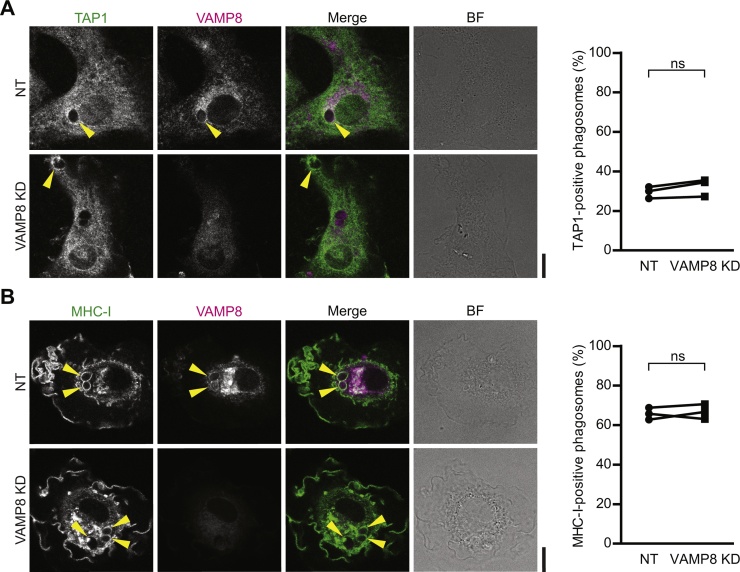
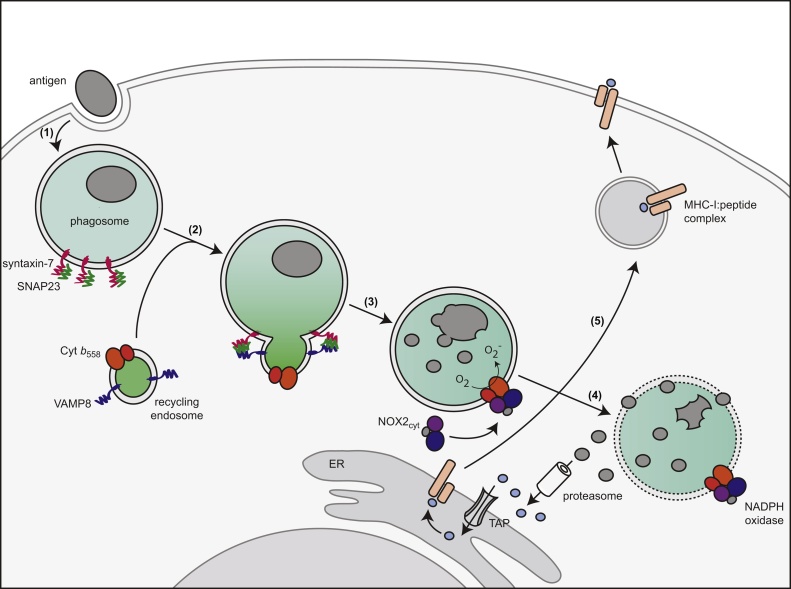
Cross-presentation of foreign antigen in major histocompatibility complex (MHC) class I by dendritic cells (DCs) requires activation of the NADPH-oxidase NOX2 complex. We recently showed that NOX2 is recruited to phagosomes by the SNARE protein VAMP8 where NOX2-produced reactive oxygen species (ROS) cause lipid oxidation and membrane disruption, promoting antigen translocation into the cytosol for cross-presentation. In this study, we extend these findings by showing that VAMP8 is also involved in NOX2 trafficking to endosomes. Moreover, we demonstrate in both human and mouse DCs that absence of VAMP8 leads to decreased ROS production, lipid peroxidation and antigen translocation, and that this impairs cross-presentation. In contrast, knockdown of VAMP8 did not affect recruitment of MHC class I and the transporter associated with antigen processing 1 (TAP1) to phagosomes, although surface levels of MHC class I were reduced. Thus, in addition to a secretory role, VAMP8-mediates trafficking of NOX2 to endosomes and phagosomes and this promotes induction of cytolytic T cell immune responses.

Keywords: Cross-presentation; Dendritic cells; Lipid peroxidation; NOX2; VAMP8.


Figures

Fig. 1
Fig. 1
Loss of VAMP8 results in decreased surface-levels of MHC class I. (A) siRNA knockdown for VAMP8 in human DCs (VAMP8 KD; NT: non-targeting siRNA; see reference (Dingjan et al., 2016) for quantification) and VAMP8 expression in BMDCs from VAMP8± and −/− mice by Western blot. GAPDH: loading control. (B) Representative flow cytometry histograms of surface staining of MHC class I and II molecules in VAMP8 KD (blue) and NT (green) human DCs (upper graphs) and for VAMP8−/− (blue) and VAMP8± (green) mouse BMDCs (lower graphs). The grey curves show the mean fluorescence intensities of the isotype controls. (C) Expression levels of HLA-A2 molecules (MHC-I), HLA-DR molecules (MHC-II), CD11c or CD86 on the surface of VAMP8 KD human DCs (left) or VAMP8-/- mouse BMDCs (right) normalized to control cells. (D) Representative dot blot cytokine array blots for NT and VAMP8 KD human DCs. The grey values are proportional to the levels of secreted cytokines. The 4 most abundant cytokines are indicated: IL-1ra; macrophage migration inhibitory factor (MIF); interleukin-8 (IL-8); Serpin E1. (E) Quantification of the cytokine secretion levels from panel D normalized to the highest intensities. Results are from at least three donors and plotted as mean ± s.e.m. (For interpretation of the references to colour in this figure legend, the reader is referred to the web version of this article.)
Fig. 2
Fig. 2
VAMP8 is responsible for NOX2 recruitment to endosomes and phagosomes. (A) Representative confocal micrographs showing the recruitment of gp91phox (green in merge) to phagosomes containing latex beads by immunofluorescence in VAMP8 KD DCs and control DCs (non-targeting siRNA; NT). Magenta: immunolabeling for VAMP8. Arrow heads indicate phagosomes positive for gp91phox. The graph shows the quantification by manual counting of gp91phox-positive phagosomes of DCs from 3 individual donors (linked by solid lines; p = 0.0067). (B) Same as panel A, but now for ovalbumin-containing endosomes (OVA; magenta; p = 0.0391). Recruitment was quantified from the gp91phox signal at OVA-positive compartments relative to the total imaged cell area. (C) H2O2 production by VAMP8 KD DCs (red curve) compared to NT control DCs (black) measured with the Amplex Red assay. The symbols show the individual donors. (D) Representative flow cytometry histograms of lipid peroxidation sensor BODIPY581/591-C11 for VAMP8 KD (blue) and NT (green) human DCs (upper graph) and for VAMP8−/− (blue) and VAMP8± (green) mouse BMDCs (lower graph) after 60 min incubation with LPS and OVA. The red curves show the background fluorescence distribution from cells without BODIPY581/591-C11. (E) Percentage of lipid peroxidation over time in VAMP8 KD (red curve) and NT (black) human DCs. The symbols show the individual donors. (F) Quantification of panel D. Relative lipid peroxidation: mean fluorescence intensities of VAMP8 KD DCs (4 donors; p = 0.0154) and VAMP8-/- BMDCs (3 mice; p = 0.0474) relative to the NT and VAMP8± controls. Scale bars, 10 μm. (For interpretation of the references to colour in this figure legend, the reader is referred to the web version of this article.)
Fig. 3
Fig. 3
Antigen cross-presentation depends on VAMP8-mediated trafficking of NOX2. (A) Representative confocal microscope images of the CCF4 endosomal leakage assay for VAMP8 siRNA knockdown (VAMP8 KD) and non-targeting siRNA (NT) human DCs. The cytosolic FRET probe CCF4 was cleaved by exogenous β-lactamase (β-lac) resulting in a decreased ratio of fluorescein (acceptor fluorophore; green in merge) over coumarin (donor; blue) fluorescence. (B) Representative confocal microscope images as in panel A, but now for VAMP8-/- and VAMP8± mouse BMDCs. (C) Quantification of panel A. The graph shows the CCF4 cleavage efficiencies (see reference (Dingjan et al., 2016)) of DCs from 3 donors (linked by solid lines; p = 0.0312). (D) Same as panel C, but now for VAMP8-/- and VAMP8± mouse BMDCs (panel B; p = 0.0457). (E) Representative flow cytometry histograms of CD69 expression by Jurkat cells carrying a gp100-specific T cell receptor. The jurkat T cells were co-cultured with VAMP8 KD (blue) and NT (green) DCs that were loaded with short (residues 280–288; left-hand graphs) or long (residues 272–300; right) gp100 peptide. The percentages CD69-positive T cells are indicated in the graphs. (F) Quantification of T cell activation from panel E for 4 donors (p = 0.0461). Scale bars, 10 μm. (For interpretation of the references to colour in this figure legend, the reader is referred to the web version of this article.)
Fig. 4
Fig. 4
Recruitment of TAP1 and MHC class I molecules to phagosomes is VAMP8-independent. (A) Representative confocal micrographs showing the recruitment of TAP1 (green in merge) and VAMP8 (magenta) to zymosan-containing phagosomes by immunofluorescence in VAMP8 KD and NT human DCs. Arrow heads indicate phagosomes positive for TAP1. The graph shows the quantification by manual counting of TAP1-positive phagosomes of DCs from 3 individual donors. (B) Same as panel A, but now for MHC class I (MHC-I; green in merge). Scale bars, 10 μm; ns: not significant. (For interpretation of the references to colour in this figure legend, the reader is referred to the web version of this article.)
Fig. 5
Fig. 5
Model of VAMP8-mediated antigen cross-presentation. (step 1) Uptake of antigen via endocytosis or phagocytosis. (2) Recruitment of cytochrome b558 (Cyt b558) to the antigen-containing compartment by VAMP8, SNAP23 and syntaxin-7. (3) The cytosolic subunits of NOX2 (NOX2cyt; consisting of p40phox, p47phox and p67phox) and the small GTPase Rac are recruited to cytochrome b558. Fully assembled NOX2 on the phagosome produces ROS in the organellar lumen. (4) ROS lead to disruption of the phagosomal membrane allowing translocation of antigen into the cytosol. In the cytosol, the antigen becomes accessible for degradation by the proteasome. The proteasome-derived peptide fragments are imported in the endoplasmatic reticulum (ER) by the transporter associated with antigen processing (TAP) for loading onto MHC class I molecules (MHC-I). (5) The MHC:peptide complex is transported to the cell surface to cross-present the antigen to naive cytolytic T cells.

References

    1. Allan E.R.O., Tailor P., Balce D.R., Pirzadeh P., McKenna N.T., Renaux B., Warren A.L., Jirik F.R., Yates R.M. NADPH oxidase modifies patterns of MHC class II-restricted epitopic repertoires through redox control of antigen processing. J. Immunol. 2014;192:4989–5001. - PubMed
    1. Antonin W., Holroyd C., Tikkanen R., Höning S., Jahn R. The R-SNARE endobrevin/VAMP-8 mediates homotypic fusion of early endosomes and late endosomes. Mol. Biol. Cell. 2000;11:3289–3298. - PMC - PubMed
    1. Arango Duque G., Fukuda M., Descoteaux A. Synaptotagmin XI regulates phagocytosis and cytokine secretion in macrophages. J. Immunol. 2013;190:1737–1745. - PubMed
    1. Baranov M.V., Ter Beest M., Reinieren-Beeren I., Cambi A., Figdor C.G., van den Bogaart G. Podosomes of dendritic cells facilitate antigen sampling. J. Cell Sci. 2014;127:1052–1064. - PMC - PubMed
    1. Baranov M.V., Revelo N.H., Dingjan I., Maraspini R., Ter Beest M., Honigmann A., van den Bogaart G. SWAP70 organizes the actin cytoskeleton and is essential for phagocytosis. Cell Rep. 2016;17:1518–1531. - PMC - PubMed

MeSH terms

Substances