. 2017 Aug;111(3-4):309-334.
doi: 10.1007/s00422-017-0722-1. Epub 2017 Jul 8.

Synapse fits neuron: joint reduction by model inversion

Affiliations

Synapse fits neuron: joint reduction by model inversion

H T van der Scheer et al. Biol Cybern. 2017 Aug.

Abstract

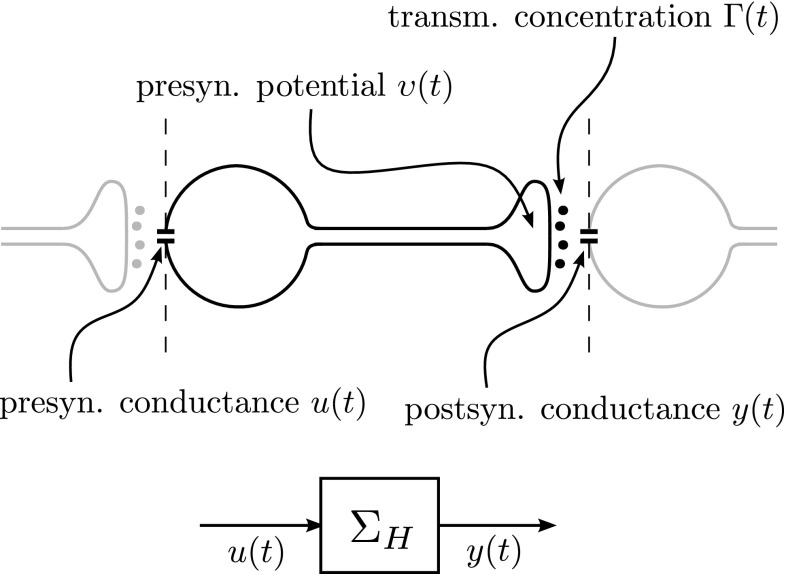
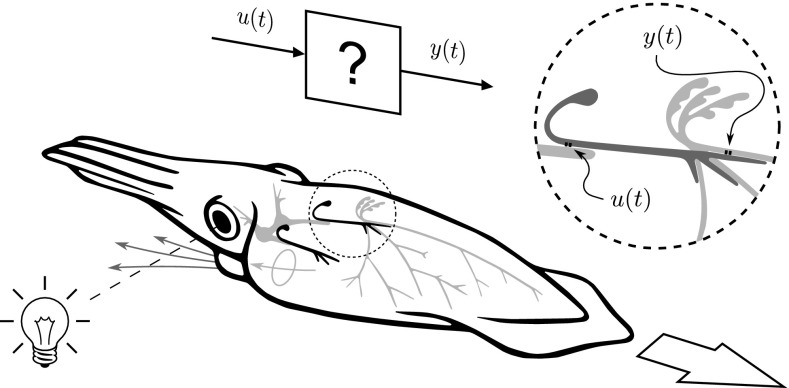
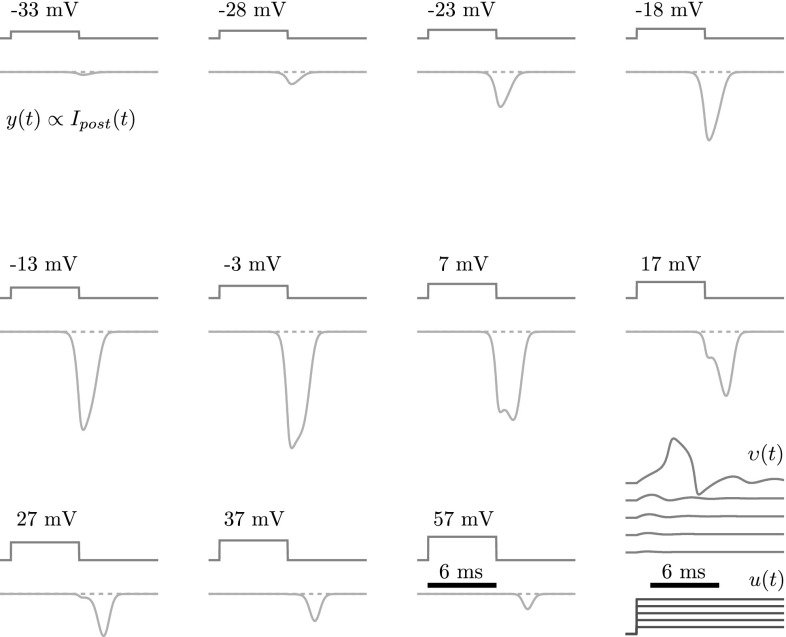
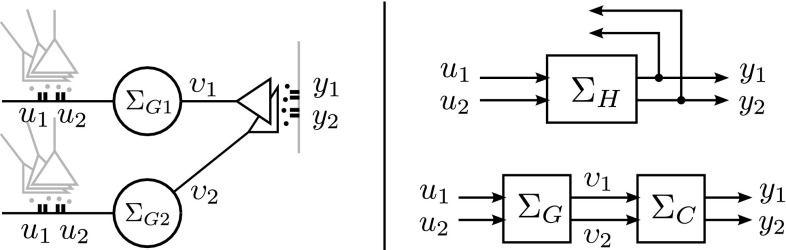
In this paper, we introduce a novel simplification method for dealing with physical systems that can be thought to consist of two subsystems connected in series, such as a neuron and a synapse. The aim of our method is to help find a simple, yet convincing model of the full cascade-connected system, assuming that a satisfactory model of one of the subsystems, e.g., the neuron, is already given. Our method allows us to validate a candidate model of the full cascade against data at a finer scale. In our main example, we apply our method to part of the squid's giant fiber system. We first postulate a simple, hypothetical model of cell-to-cell signaling based on the squid's escape response. Then, given a FitzHugh-type neuron model, we derive the verifiable model of the squid giant synapse that this hypothesis implies. We show that the derived synapse model accurately reproduces synaptic recordings, hence lending support to the postulated, simple model of cell-to-cell signaling, which thus, in turn, can be used as a basic building block for network models.

Keywords: Conductance-based models; Inverse systems; State-space realizations; Synaptic transmission.


Figures

Fig. 1
Fig. 1
Top a schematic representation of a complete signal path from presynaptic conductance u(t) to postsynaptic conductance y(t). Two intermediate quantities are indicated along the way: the presynaptic potential υ(t), and the transmitter concentration Γ(t). Bottom a ‘building block’ representation of the path from a functional input–output point of view
Fig. 2
Fig. 2
A schematic representation of a physical ‘input–output’ system that can be thought to consist of two subsystems connected in series. Our goal is to establish a simple, high-level model ΣH, describing the behavior of the full system from a functional, input–output point of view. We assume that a model ΣG of the first subsystem is given, describing in more detail how part of the system is realized. What is thus still required, in order to complete the cascade, is a matching, complementary model ΣC of the second subsystem
Fig. 3
Fig. 3
A schematic representation of a physical ‘input–output’ system that, as in Fig. 2, can be thought to consist of two subsystems connected in series. Again, our goal is to establish a simple, high-level model ΣH, describing the behavior of the full system from a functional, input–output point of view, except now we assume that a model ΣG of the second subsystem is given, and we require a matching, complementary model ΣC of the first subsystem, in order to complete the cascade
Fig. 4
Fig. 4
Simplified schematic representation of the squid giant fiber system in a single-jet, flash-evoked escape response: from the fused first-order giants (gray), to the paired second-order giants (black) via the stellate ganglion to the paired third-order giants (gray, only one side shown). One second-order giant is shown enlarged to indicate the complete path from presynaptic conductance u(t) to postsynaptic conductance y(t) that we seek to capture with a simple, yet valid, high-level model, in order to illustrate our method. (Based on various sources)
Fig. 5
Fig. 5
A pictographic summary of our method as applied to cell-to-cell signaling in the squid giant fiber system (cf. also Figs.  4, 7, and 8). Given a model ΣG of a squid neuron, it is possible to derive a complementary model ΣC of the squid giant synapse, by postulating a simple, high-level model ΣH, describing what the giant fiber system does from a functional, input–output point of view. Left voltage responses υ(t) to step input conductances u(t) as produced by the FitzHugh-type neuron model ΣG given by (20). Middle the objective, a simple, high-level model ΣH of cell-to-cell signaling, represented here by a complete signal path mapping a presynaptic conductance input u(t) to a postsynaptic conductance output y(t). This is the system for which we postulate a hypothetical model (23). Right superimposed postsynaptic conductance responses y(t) to depolarizing presynaptic potentials υ(t) as produced by the derived, complementary synapse model ΣC given by (28), next to experimental data faithfully traced from Augustine et al. (1985). Positive conductances are plotted downwards
Fig. 6
Fig. 6
Several reconstructions y(t) of the step input conductance u(t) from the voltage response υ(t) of a neuron model. The realizable complementary model used for these reconstructions is based on the approximate ‘identity’ (6), which is of the form (12) with h(ζ)=f(ζ)=ζ. Each reconstruction y(t) corresponds to a different value of the parameter ε in this approximate identity. Note that we can get arbitrarily close to the original input provided that we choose the parameter ε sufficiently small
Fig. 7
Fig. 7
Recordings from the squid giant synapse: post synaptic currents (lower traces) in response to presynaptic depolarizing, 6 ms pulses (upper traces) from a holding potential of -70 mV. Faithfully traced from Augustine et al. (1985)
Fig. 8
Fig. 8
An approximate reproduction of the measurements in Augustine et al. (1985) by our theoretically derived model ΣC:υy, where the postsynaptic conductance y(t) is taken to be proportional to the postsynaptic current Ipost(t) in the original figure, cf. Eq. (29). Presynaptic depolarizing pulses υ(t) are as in the original figure except that the parameters below are for equivalent decivolts. Also shown in the lower right corner are voltage responses υ(t) of the neuron model ΣG to step input conductances u(t), in 0.021 increments from zero, for the same parameters and timescale. The voltage responses for the more traditional step input currents (not shown) are very similar. Parameters of the FitzHugh-type neuron model ΣG and its inverse: C=1, κ=-1.38, υr=-0.69, υt=-0.52, υp=2.42, υs=4.7, τη=1, λ=3.44. Parameters of the hypothesis ΣH: τζ=τη, μ=130, ρ=0.201. Initial conditions: ζ1(0)=ζ2(0)=ζ3(0)=η(0)=u(0)=0 and ξ(0)=υr. (Note that the timescale of processing τζ=τη at the desired network level agrees with that of the ‘slow’ recovery dynamics (20b) of the neuron, not that of the ‘fast’ membrane dynamics)
Fig. 9
Fig. 9
Left a schematic representation of a (minimal) conductance-to-conductance network with feedback connections. Right models of complete signal paths can be used as building blocks in the construction of network models with feedback connections. In the high-level network model, some details no longer appear, in this case the intermediate voltage responses and transmitter concentrations. Only the input–output essentials are retained
Fig. 10
Fig. 10
Left a simplified schematic representation of synaptic transmission. Fluctuations in presynaptic membrane potential υ(t) can bring about the release of neurotransmitter into the synaptic cleft, effecting the transmitter concentration Γ(t) in the cleft. The transmitter may bind to receptors or receptor channels in the postsynaptic membrane. This can lead to the opening or closing of ion channels, which in turn will alter the membrane conductance y(t) of the postsynaptic neuron. Right synaptic transmission viewed as a cascade of subsystems: voltage-dependent release ΣC and transmitter-dependent conductance ΣG
Fig. 11
Fig. 11
Left a schematic representation of a minimal canonical circuit with input conductances u(t) and output conductances y(t). Each neuron ‘receives’ two distinct input conductances u1 and u2 from other neurons or receptors, and their distinct output conductances y1 and y2 contribute to the total specific input conductances of other cells. Right the circuit represented as a cascade of subsystems together with its high-level representation. Such high-level models can be used as building blocks in the construction of networks with feedback connections
Fig. 12
Fig. 12
Left a schematic representation of a minimal canonical circuit with input potentials u(t) and output potentials υ(t). Each neuron ‘receives’ two distinct input conductances γ1 and γ2 from an arbitrary number of neurons. Right the circuit represented as a cascade of subsystems together with its high-level representation. Such high-level models can be used as building blocks in the construction of networks with feedback connections

Similar articles

References

    1. Abbott LF. Decoding neuronal firing and modeling neural networks. Q Rev Biophys. 1994;27:291–331. doi: 10.1017/S0033583500003024. - DOI - PubMed
    1. Augustine GJ, Charlton MP, Smith SJ. Calcium entry and transmitter release at voltage-clamped nerve terminals of squid. J Physiol. 1985;367:163–181. doi: 10.1113/jphysiol.1985.sp015819. - DOI - PMC - PubMed
    1. Chapeau-Blondeau F, Chambet N. Synapse models for neural networks: from ion channel kinetics to multiplicative coefficient wij. Neural Computation. 1995;7:713–734. doi: 10.1162/neco.1995.7.4.713. - DOI - PubMed
    1. Clay JR. Excitability of the squid giant axon revisited. J Neurophysiol. 1998;80:903–913. - PubMed
    1. Dayan P, Abbott LF. Theoretical neuroscience: computational and mathematical modeling of neural systems. Cambridge: The MIT Press; 2001.

LinkOut - more resources