. 2017 Jan;24(1):69-86.
doi: 10.1177/0969776415596449. Epub 2016 Jul 26.

The energy divide: Integrating energy transitions, regional inequalities and poverty trends in the European Union

Affiliations

The energy divide: Integrating energy transitions, regional inequalities and poverty trends in the European Union

Stefan Bouzarovski et al. Eur Urban Reg Stud. 2017 Jan.

Abstract

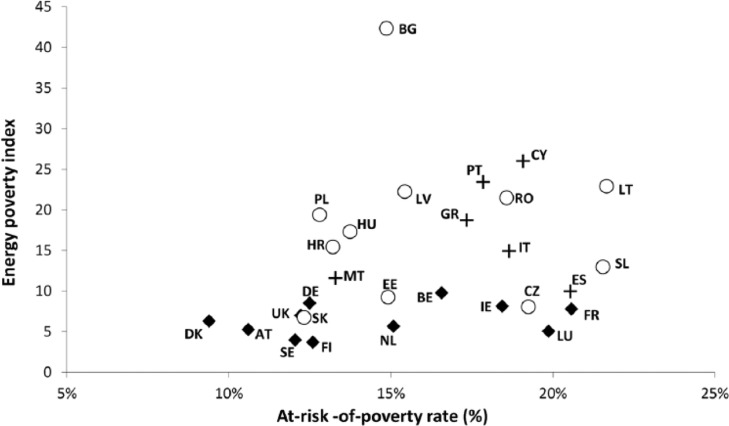
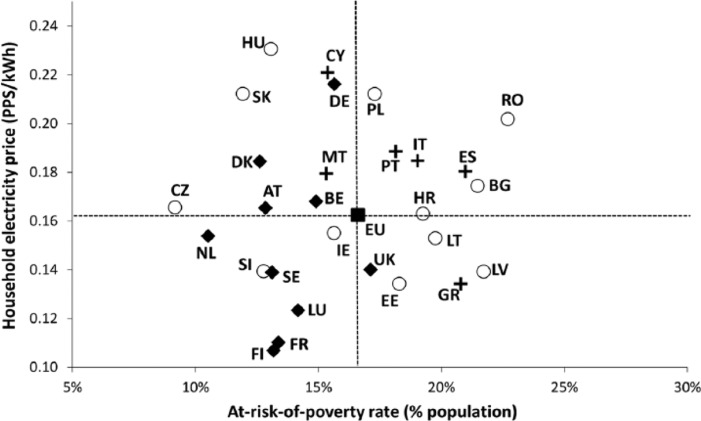
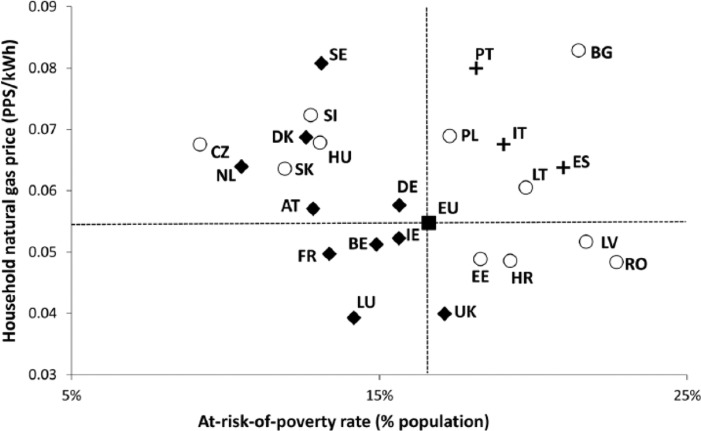
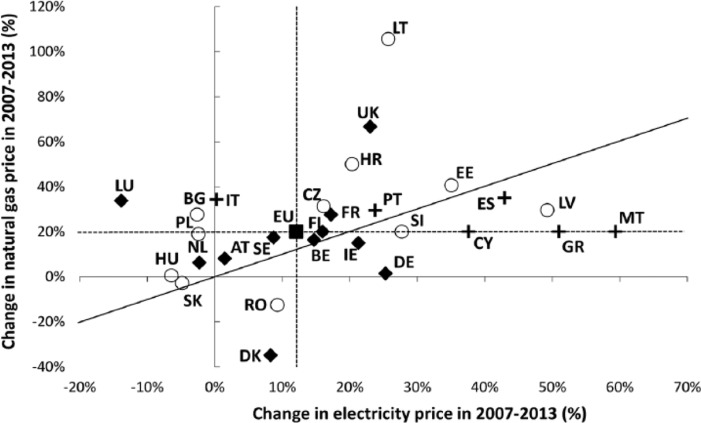
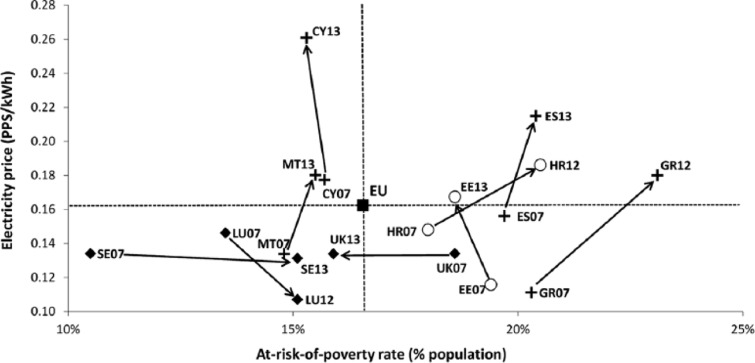
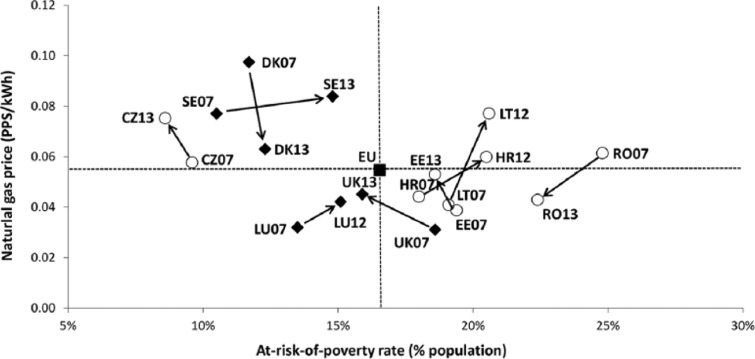
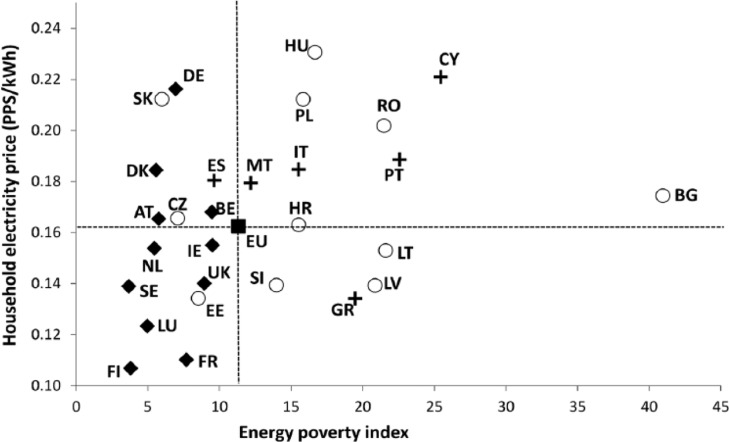
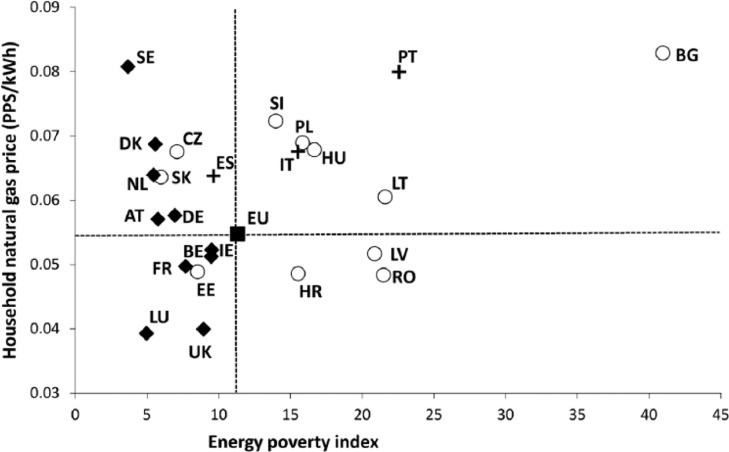
Energy poverty can be understood as the inability of a household to secure a socially and materially necessitated level of energy services in the home. While the condition is widespread across Europe, its spatial and social distribution is highly uneven. In this paper, the existence of a geographical energy poverty divide in the European Union (EU) provides a starting point for conceptualizing and exploring the relationship between energy transitions - commonly described as wide-ranging processes of socio-technical change - and existing patterns of regional economic inequality. We have undertaken a comprehensive analysis of spatial and temporal trends in the national-scale patterns of energy poverty, as well as gas and electricity prices. The results of our work indicate that the classic economic development distinction between the core and periphery also holds true in the case of energy poverty, as the incidence of this phenomenon is significantly higher in Southern and Eastern European EU Member States. The paper thus aims to provide the building blocks for a novel theoretical integration of questions of path-dependency, uneven development and material deprivation in existing interpretations of energy transitions.

Keywords: Energy poverty; European Union; energy transition; prices; regional inequalities.


Figures

Figure 1.
Figure 1.
Percentage of people at risk of poverty versus the energy poverty index. Average for European Union member states for 2003–2013 for both variables.
Figure 2.
Figure 2.
Household electricity prices (in Purchasing Power Units (PPS) as of the year 2007) versus at-risk-of-poverty rate, average for the period 2007–2013 (with a few exceptions for the poverty indicator).
Figure 3.
Figure 3.
Household natural gas prices (in Purchasing Power Units (PPS) as of the year 2007) versus at-risk-of-poverty rate, average for the period 2007–2013 (with a few exceptions for the poverty indicator). Note: Cyprus, Finland, Greece and Malta missing (no data for natural gas prices).
Figure 4.
Figure 4.
Change in household natural gas prices versus change in household electricity prices (accumulated percentage, calculated on real prices denominated in national currency) of member states, that occurred between the years 2007 and 2013. Note: (1) no household natural gas prices data is available for Greece, Finland, Malta and Cyprus; for comparative purposes, they are displayed distinctly along the line representing the average natural gas price of the European Union; (2) the diagonal line indicates a theoretical line along which natural gas and electricity prices increase at the same rate.
Figure 5.
Figure 5.
Evolution of relative positions according to electricity price (in Purchasing Power Units (PPS) as of the year 2007, per kWh) versus percentage population at risk of poverty, for selected member states between 2007 and 2013. Note: the reference European Union electricity price and poverty rate has been calculated as an average for the period 2007–2013.
Figure 6.
Figure 6.
Evolution of relative positions according to natural gas price (in Purchasing Power Units (PPS) as of the year 2007, per kWh) versus percentage population at risk of poverty, for selected member states between 2007 and 2013. Note: the reference European Union electricity price and poverty rate has been calculated as an average for the period 2007–2013.
Figure 7.
Figure 7.
Household electricity prices (in Purchasing Power Units (PPS) as of the year 2007) versus at-risk-of-poverty rate, average for the period 2007–2013 (with a few exceptions for the poverty indicator).
Figure 8.
Figure 8.
Household natural gas prices (in Purchasing Power Units (PPS) as of the year 2007) versus at-risk-of-poverty rate, average for the period 2007–2013 (with a few exceptions for the poverty indicator). Note: Cyprus, Finland, Greece and Malta missing (no data for natural gas prices).

References

    1. Aatola P, Ollikainen M, Toppinen A. (2013) Impact of the carbon price on the integrating European electricity market. Energy Policy 61: 1236–1251.
    1. Amin S. (1974) Accumulation and development: a theoretical model. Review of African Political Economy 1(1): 9–26.
    1. Bilbao SN, Castro MA. (2013) Pobreza energética. Cruz Roja ayuda a combatir la pobreza energética en España. Energía de hoy.com 1(2): 80–83.
    1. Billen G. (2008) Energie-Sozialtarife: antwort auf drohende Energiearmut? Wirtschaftsdienst 88(8): 489–490.
    1. Boardman B. (2009) Fixing Fuel Poverty: Challenges and Solutions. London; Sterling, VA: Routledge.

LinkOut - more resources