. 2017 Jun 21;3(6):e1700488.
doi: 10.1126/sciadv.1700488. eCollection 2017 Jun.

Selective targeting of primary and secondary nucleation pathways in Aβ42 aggregation using a rational antibody scanning method

Affiliations

Selective targeting of primary and secondary nucleation pathways in Aβ42 aggregation using a rational antibody scanning method

Francesco A Aprile et al. Sci Adv. .

Abstract

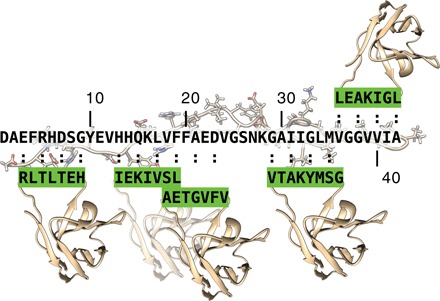
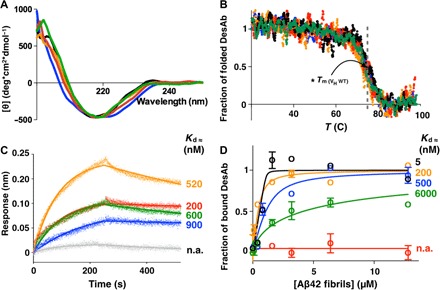
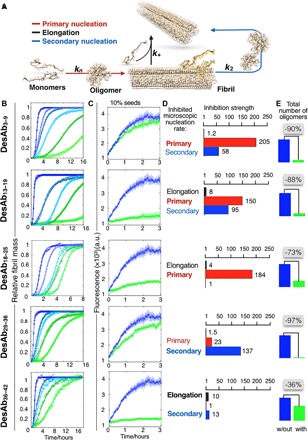
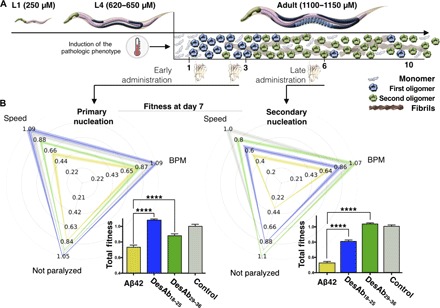
Antibodies targeting Aβ42 are under intense scrutiny because of their therapeutic potential for Alzheimer's disease. To enable systematic searches, we present an "antibody scanning" strategy for the generation of a panel of antibodies against Aβ42. Each antibody in the panel is rationally designed to target a specific linear epitope, with the selected epitopes scanning the Aβ42 sequence. By screening in vitro the panel to identify the specific microscopic steps in the Aβ42 aggregation process influenced by each antibody, we identify two antibodies that target specifically the primary and the secondary nucleation steps, which are key for the production of Aβ42 oligomers. These two antibodies act, respectively, to delay the onset of aggregation and to block the proliferation of aggregates, and correspondingly reduce the toxicity in a Caenorhabditis elegans model overexpressing Aβ42. These results illustrate how the antibody scanning method described here can be used to readily obtain very small antibody libraries with extensive coverage of the sequences of target proteins.

Keywords: Alzheimer’s disease; Chemical Kinetics; Protein aggregation.


Figures

Fig. 1
Fig. 1. Schematic representation of the DesAb panel against Aβ42 generated using the antibody scanning method described in this work.
The five target epitopes, which scan the Aβ42 sequence, are shown as green-framed rectangular boxes, whereas the corresponding designed complementary peptides grafted into the CD3 loop of the single-domain human antibody scaffold are highlighted in green.
Fig. 2
Fig. 2. Structural and functional characterization of the DesAbs.
CD spectra (A) and CD thermal denaturation (B) of the DesAbs used in this work. WT, wild type. (B) Denaturation data are reported as fraction of the folded protein (see Materials and Methods). (C) BLI measurements of the binding of the DesAbs to SA sensor chip coated with monomeric biotinylated Aβ42. Each curve was subtracted from a curve of binding of the corresponding DesAb to an uncoated sensor chip; the Kd values of binding to monomeric Aβ42 are reported. Given the proximity of the target peptide of DesAb3–9 to the biosensor surface, the affinity of DesAb3–9 for monomeric Aβ42 was determined with biotin-mediated affinity measurements (fig. S3). n.a., not applicable. (D) Fibril binding experiments of the DesAbs; the Kd values of binding to fibrillar Aβ42 are reported. DesAb3–9, black; DesAb13–19, orange; DesAb18–25, blue; DesAb29–36, green; DesAb36–42, red; DesAb-F (a DesAb that targets α-synuclein), gray. The gray dashed line in (B) indicates the Tm (≈73°C) of the original scaffold as reported in the literature (48).
Fig. 3
Fig. 3. The antibody scanning method produces antibodies that affect different microscopic steps in Aβ42 aggregation.
(A) Model of aggregation of Aβ42 showing the primary (red arrow) and the secondary (blue arrow) nucleation of the oligomers and the elongation of the fibrils (black arrow). (B) Solutions containing 2 μM Aβ42 were incubated in the presence of increasing (blue to green) Aβ42 monomer equivalents of the DesAbs (serial dilutions starting from 1 μM DesAb concentration; see fig. S5); each antibody targets a specific epitope within the sequence of Aβ42 (Fig. 1) and inhibits the aggregation of the peptide in a characteristic manner. Continuous lines represent the fits of the data using the integrated rate law for Aβ42 aggregation (see Materials and Methods). (C) Seeded aggregation of Aβ42 in the presence of 10% preformed fibrils with a 0:1 (blue) or 1:1 (green) antibody–to–Aβ42 monomer ratio. a.u., arbitrary units. (D) Bar plot showing the inhibition strength of the DesAbs (which is defined as kAβ42/kAβ42+DesAb) on k+ (black), kn (red), and k2 (blue) rate constants, derived from (B), (C), and fig. S5. The fold change in the presence of the antibodies of each of the rate constants is indicated on the top of the corresponding bar. (E) Relative number of oligomers generated during the aggregation reaction with or without a 1:2 antibody–to–Aβ42 monomer ratio.
Fig. 4
Fig. 4. Effects of DesAb18–25 and DesAb29–36 in a C. elegans model of Aβ42-mediated toxicity.
(A) Experimental design for the investigation of the effects of the two selected DesAbs in the C. elegans strain GMC101 (the Aβ42 worm model) compared with strain N2 (the control worm model). The pathological phenotype is induced in the worms by increasing their temperature of incubation from 20° to 24°C, which induces Aβ42 aggregation. A pictorial representation of the populations of monomers (light blue), oligomers formed by primary (blue) and secondary (green) nucleations, and fibrils (maroon) at the different stages (in days) of adulthood of the worms is given to illustrate the aggregation process. (B) Phenotypic fingerprints, which consider speed, body bends per minute (BPM), and fraction not paralyzed or the worms, of Aβ42 worms (C. elegans GMC101; yellow) and control worms (C. elegans N2, WT; gray) treated with empty lipid vesicles and after the administration of DesAb29–36 (green) and DesAb18–25 (blue), screened at day 7 of adulthood. DesAbs were administered starting from a 20 μM concentration (see Materials and Methods) at days 1 and 3 (left) or at day 6 (right). The fingerprints show one representative of three biological replicates that showed similar results. The thickness of the lines represents SEM. The bar plots report the total fitness (see Materials and Methods). *P ≤ 0.05, **P ≤ 0.01, ***P ≤ 0.001, and ****P ≤ 0.0001 (relative to untreated worms).

References

    1. Hardy J., Selkoe D. J., The amyloid hypothesis of Alzheimer’s disease: Progress and problems on the road to therapeutics. Science 297, 353–356 (2002). - PubMed
    1. Aguzzi A., O’Connor T., Protein aggregation diseases: Pathogenicity and therapeutic perspectives. Nat. Rev. Drug Discov. 9, 237–248 (2010). - PubMed
    1. Selkoe D. J., Hardy J., The amyloid hypothesis of Alzheimer’s disease at 25 years. EMBO Mol. Med. 8, 595–608 (2016). - PMC - PubMed
    1. Sala Frigerio C., De Strooper B., Alzheimer’s disease mechanisms and emerging roads to novel therapeutics. Annu. Rev. Neurosci. 39, 57–79 (2016). - PubMed
    1. Knowles T. P. J., Vendruscolo M., Dobson C. M., The amyloid state and its association with protein misfolding diseases. Nat. Rev. Mol. Cell Biol. 15, 384–396 (2014). - PubMed

Publication types