. 2017 Jul 10:8:16018.
doi: 10.1038/ncomms16018.

The self-inhibitory nature of metabolic networks and its alleviation through compartmentalization

Affiliations

The self-inhibitory nature of metabolic networks and its alleviation through compartmentalization

Mohammad Tauqeer Alam et al. Nat Commun. .

Abstract

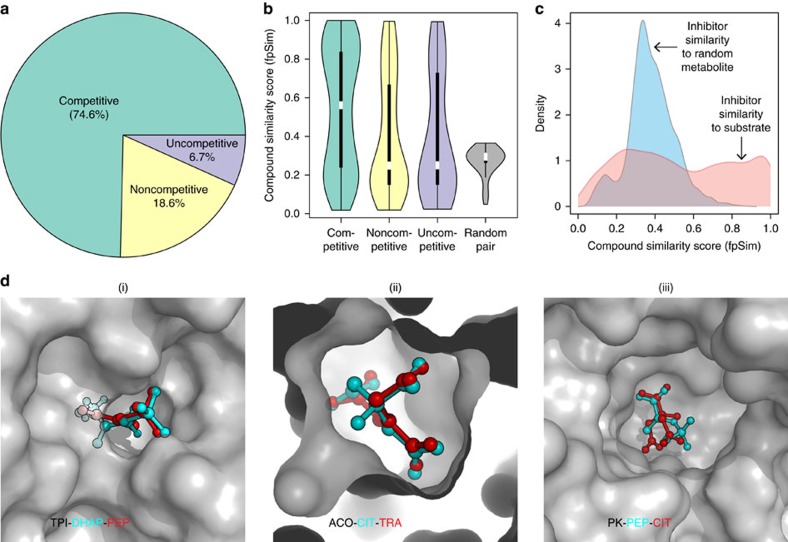
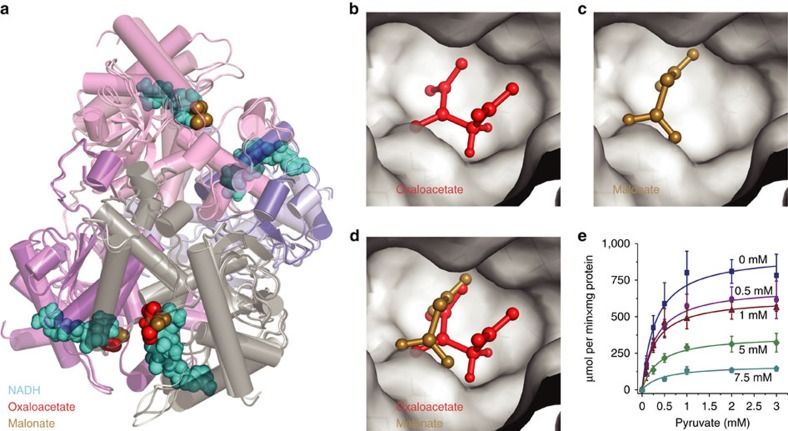
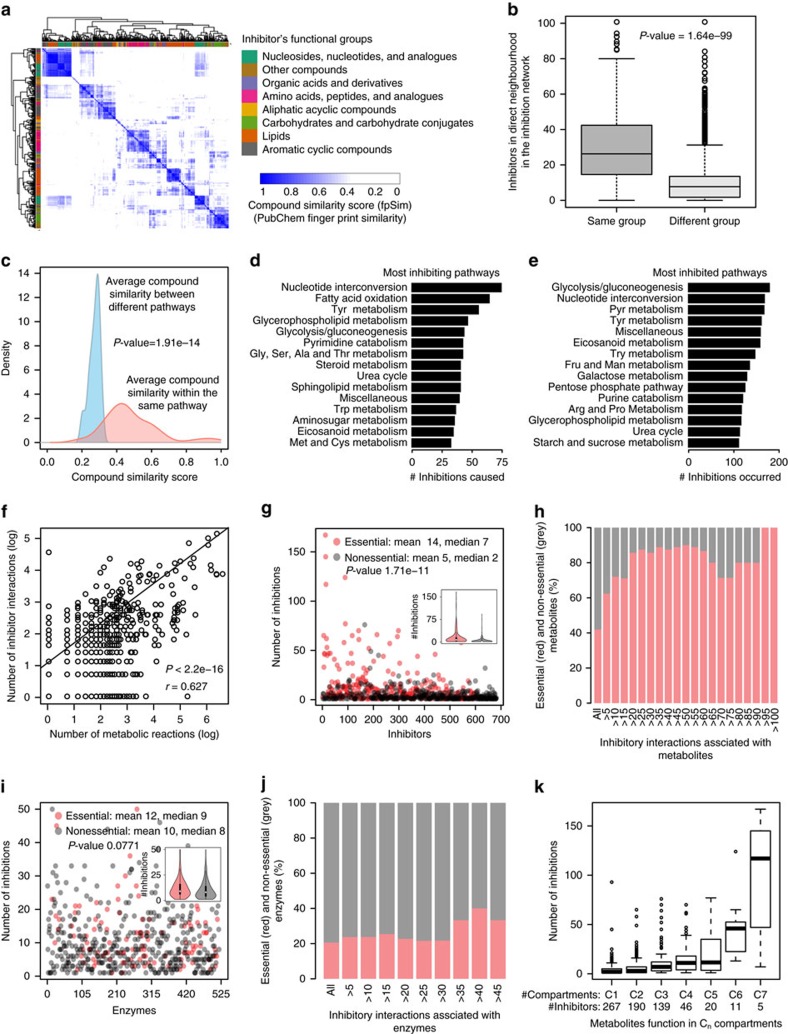
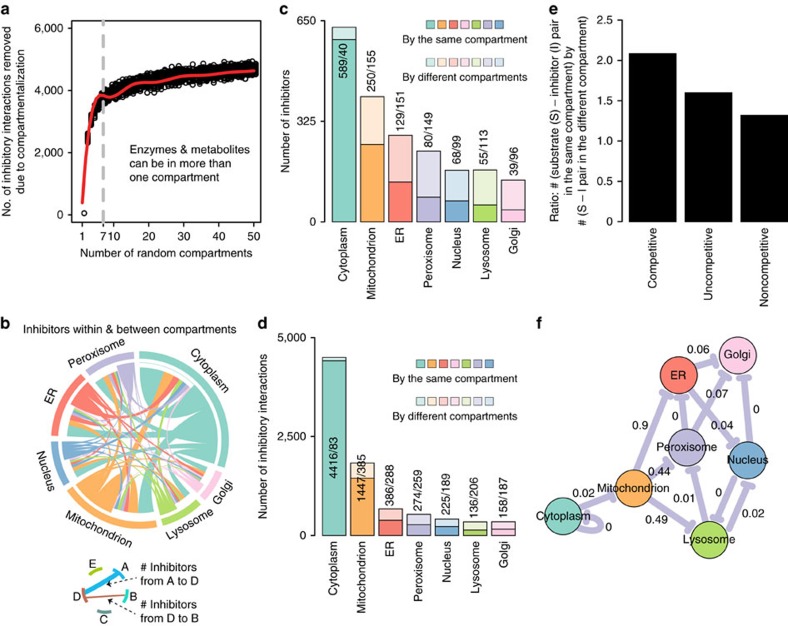
Metabolites can inhibit the enzymes that generate them. To explore the general nature of metabolic self-inhibition, we surveyed enzymological data accrued from a century of experimentation and generated a genome-scale enzyme-inhibition network. Enzyme inhibition is often driven by essential metabolites, affects the majority of biochemical processes, and is executed by a structured network whose topological organization is reflecting chemical similarities that exist between metabolites. Most inhibitory interactions are competitive, emerge in the close neighbourhood of the inhibited enzymes, and result from structural similarities between substrate and inhibitors. Structural constraints also explain one-third of allosteric inhibitors, a finding rationalized by crystallographic analysis of allosterically inhibited L-lactate dehydrogenase. Our findings suggest that the primary cause of metabolic enzyme inhibition is not the evolution of regulatory metabolite-enzyme interactions, but a finite structural diversity prevalent within the metabolome. In eukaryotes, compartmentalization minimizes inevitable enzyme inhibition and alleviates constraints that self-inhibition places on metabolism.


Conflict of interest statement

The authors declare no competing financial interests.

Figures

Figure 1
Figure 1. A genome-scale network of enzyme inhibition.
(a) construction of a genomic-scale enzyme-inhibition network by mapping inhibitor information curated from the BRENDA database, to the human metabolic reconstruction (Recon2 (ref. 17)). (b) enzyme-inhibition network (non-directional illustration), in which 82% of enzymatic reactions are inhibited by 26% of Recon2 metabolites. Enzymes are coloured and grouped according to enzyme commission (EC) category, inhibitors according to their HMDB chemical classification, node size is scaled numerically. (c) The enzyme-inhibition network is scale-free, and follows a power-law and a log-normal distribution (P value for comparing power-law distribution with log-normal, Poisson and exponential are 0.36, 8.7e-05, 0.077 respectively), in comparison to a random network of the same size which is not scale-free (P value for comparing power-law distribution with log-normal, Poisson and exponential are 0.42, 0.78, 0.44, respectively). Ninety per cent of enzymes and metabolites have 20 or less connections (blue line). (d) Top: Enzyme classes (EC classifications) according to their occurrence in the genome, in relation to their representation in the inhibition network. Bottom: Metabolites categorized according to HMDB superclass, and the percentage, and to which extent they are inhibitors in b. (e) Fifty most frequently inhibiting metabolites illustrated as word-cloud, scaled to the number of inhibitory interactions annotated for each inhibitor. (f) Enzyme classes are inhibited dependent on the metabolite’s chemistry. Size of the nodes is scaled according the number of inhibitor/enzymes within each class. The edge thickness is scaled according to the occurrence of significant inhibitory interactions between the inhibitor’s superclass, and enzyme class. Nodes are connected if P value<0.05. FDR values are highlighted over edges. Abbreviations refer to HMDB categories: Amino acids, Amino Acids, Peptides and Analogues; Aliphatic comp., Aliphatic Acyclic Compounds; Aromatic comp., Aromatic Cyclic Compounds; Carbohydrates, Carbohydrates and Carbohydrate Conjugates; Organic acids, Organic Acids and Derivatives; Nucleotides, Nucleosides, Nucleotides and Analogues.
Figure 2
Figure 2. Enzyme inhibition across the metabolic landscape is driven by structural similarity between metabolites.
(a) Gold-standard set: Competitive inhibition is the most common type of inhibition (74.6%) followed by noncompetitive (18.6%) and then by uncompetitive inhibition (6.7%), across 462 examples determined in individual enzymological experiments (Supplementary Data 1). (b) Pairwise compound similarity (fpSim) between inhibitor and substrate reveals significant structural similarity (0=non-similar, 1=maximum possible structural similarity). The median similarity for allosteric inhibitors is not significantly different to that of a random inhibitor; however, the spread is much higher, with a about 1/3rd of allosteric inhibitors being as similar enzyme’s metabolic substrates as competitive inhibitors. (c) The genome-scale set of enzymatic inhibitors have a wide range of similarities including highly similar metabolite–inhibitor relationships (ranging from 0.2–1), compared to random substrates, which are not structurally similar (0.2–0.4). (d) Three selected examples (protein/metabolite structure determined by X-ray crystallography) revealing the extent of structural similarity between competitive inhibitor and substrate in the active site of key enzymes. (i) Triosephosphate isomerase (TPI: 1NEY, inhibitor: 4OWG (ref. 5)); Substrate: Dihydroxyacetone phosphate (DHAP); Inhibitor: phosphoenolpyruvate (PEP), (ii) Enzyme: Aconitase (ACO: 1C96 (ref. 28), inhibitor: 1ACO (ref. 29)); Substrate: Citrate (CIT); Inhibitor: Trans-aconitate (TRA), (iii) Enzyme: Pyruvate Kinase (PK: 4HYV (ref. 26), inhibitor: 4IP7 (ref. 27)); Substrate: phosphoenolpyruvate (PEP); Inhibitor: Citrate (CIT).
Figure 3
Figure 3. Structural similarity to pyruvate renders malonate and oxaloacetate allosteric inhibitors of L-lactate dehydrogenase.
(a) Alignment of the X-ray crystallographic structures generated for rabbit muscle L-LDH co-crystallized with oxaloacetate (red) and NADH (cyan); or with malonate (gold). Active site of L-LDH with (b) oxaloacetate (OAA), or with (c) malonate. (d) These inhibitors are structural analogues of pyruvate and are found to bind all to the same non-competitive site. (e) Oxaloacetate is a non-competitive inhibitor of L-LDH with respect to pyruvate. Enzyme kinetics were determined spectrophotometrically (n=3) and fit according to a non-competitive model (R2=0.93). Error bars=mean±s.d.
Figure 4
Figure 4. Inhibitors emerge in the metabolic neighbourhood of enzymes and are often the essential and most central metabolites.
(a) Human metabolites grouped according to the HMDB superclass upon pairwise compound structural comparisons by fingerprint similarity (fpSim). (b) Inhibitors neighbour other inhibitors of the same HMDB group in the inhibition network. (c) Metabolites of the same metabolic pathway as the enzyme’s substrates possess significant structural similarity, rendering them the most likely inhibitors. (d) Fifteen top most inhibiting pathways in the inhibitor network. (e) Fifteen top most inhibited pathways (full list in Supplementary Data 1). (f) The number of inhibitory interactions and number of metabolic reactions per metabolite correlate across the metabolic network. (g) Metabolites participating in an essential biochemical reaction significantly inhibit more enzymes. (h) Vice versa, essentiality increases with degree of inhibition, and all of the most frequent inhibitors are essential metabolites. (i) The same is not the case for enzymes; essential and nonessential enyzmes are similarly frequently inhibited; (j), and enzyme essentiality remained constant with the increase in degree of inhibition. (k) Metabolites that function in multiple organelles (that is: Cn: metabolite participates in enzymatic reactions in n compartments) inhibit more reactions. P values were calculated using Welch two sample t-test (b,c,g,i) or Pearson’s product–moment correlation (f).
Figure 5
Figure 5. Compartmentalization considerably reduces metabolic self-inhibition.
(a) Computational simulation by randomly placing inhibitors and enzymes in random compartments, maintaining a metabolic network organization. red line: bs spline fitting; grey line: seven organellar compartments as in the humans. (b) Human network: compartmentalization globally reduces inhibitor–enzyme interactions. (c,d) Compartmentalization protects organellar metabolic reactions from enzyme inhibition (in c expressed as the number of inhibitors, in d as the number of inhibitory interactions). (e) Compartmentalization is more effective in preventing allosteric inhibition, as on preventing competitive inhibition. (f) Compartment–compartment specific inhibition network in which nodes represent the seven subcellular compartments. Edges are drawn if the number of inhibitor compounds between a pair of compartments is significantly enriched (P value<0.05). FDR values are highlighted over edges. Metabolic self-inhibition is enriched in the cytoplasm as expected (Figs 1), but not within the organelles. Instead, organellar metabolites would significantly enrich inhibition if localized to other organelles (P value<0.05).

References

    1. Lindsley J. E. & Rutter J. Whence cometh the allosterome? Proc. Natl Acad. Sci. USA. 103, 10533–10535 (2006). - PMC - PubMed
    1. Li X., Gianoulis T. A., Yip K. Y., Gerstein M. & Snyder M. Extensive in vivo metabolite–protein interactions revealed by large-scale systematic analyses. Cell 143, 639–650 (2010). - PMC - PubMed
    1. Kochanowski K. et al.. Functioning of a metabolic flux sensor in Escherichia coli. Proc. Natl Acad. Sci. USA 110, 1130–1135 (2013). - PMC - PubMed
    1. Gerosa L. & Sauer U. Regulation and control of metabolic fluxes in microbes. Curr. Opin. Biotechnol. 22, 566–575 (2011). - PubMed
    1. Grüning N.-M., Du D., Keller M. A., Luisi B. F. & Ralser M. Inhibition of triosephosphate isomerase by phosphoenolpyruvate in the feedback-regulation of glycolysis. Open Biol. 4, 130232 (2014). - PMC - PubMed

Publication types

LinkOut - more resources