

Human neonatal thymectomy induces altered B-cell responses and autoreactivity
- PMID: 28691750
- PMCID: PMC5697610
- DOI: 10.1002/eji.201746971
Human neonatal thymectomy induces altered B-cell responses and autoreactivity
Abstract
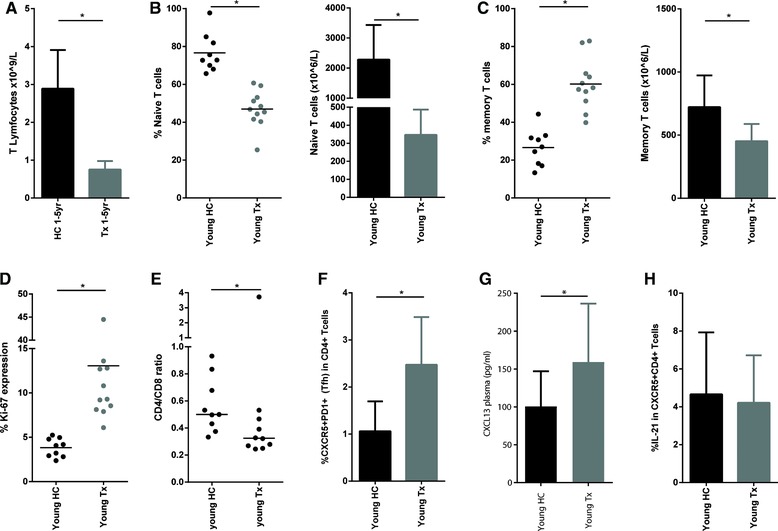
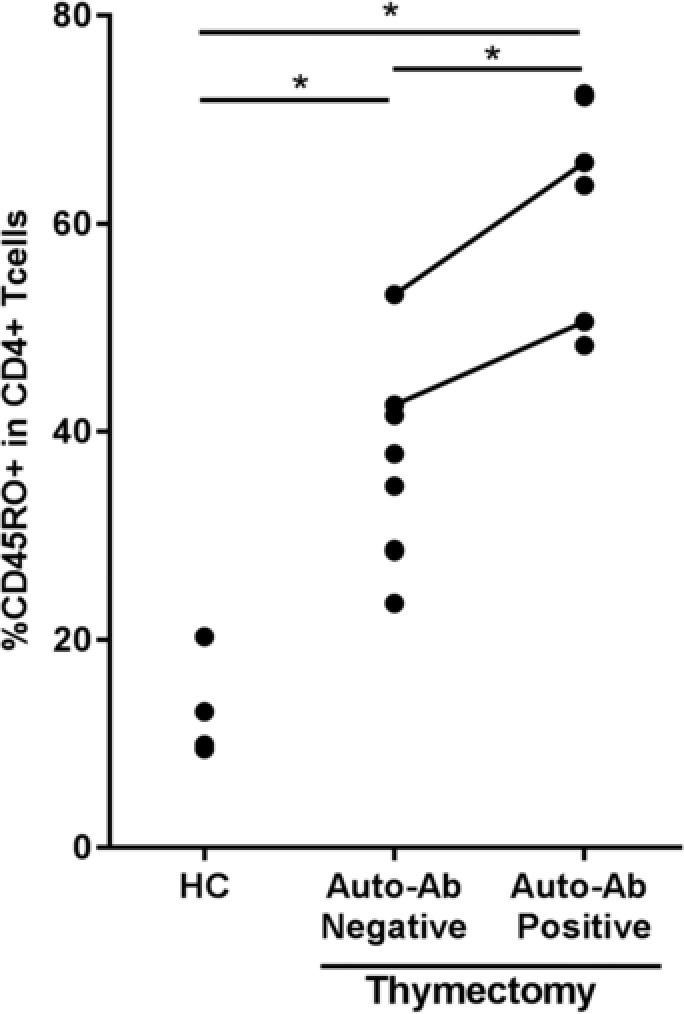
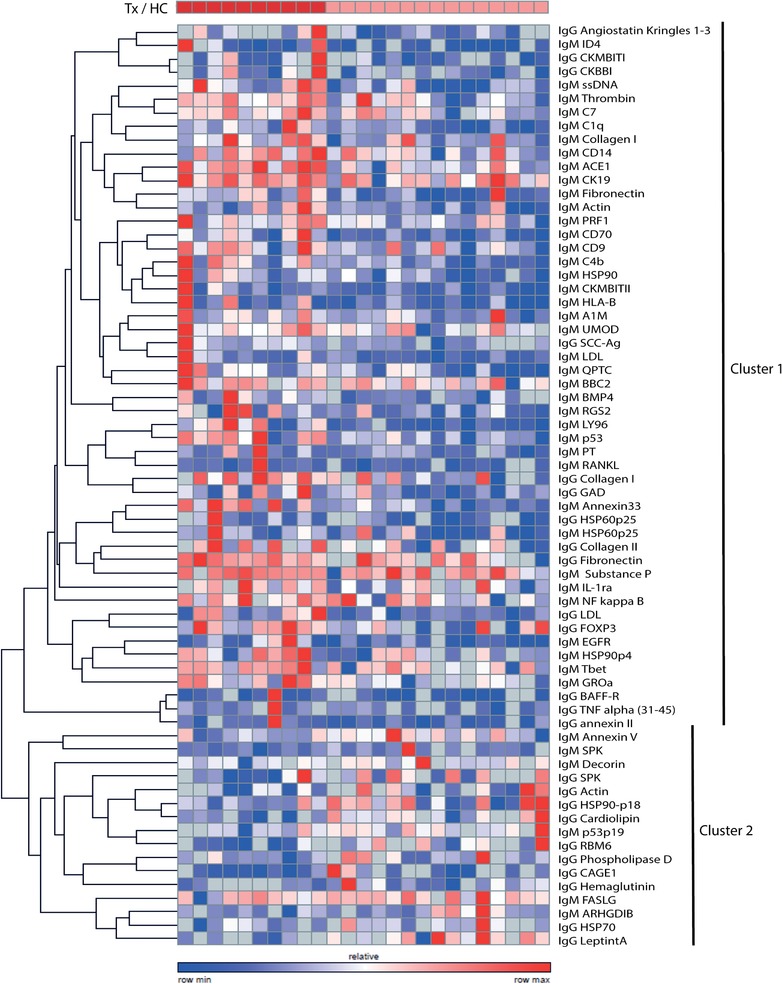
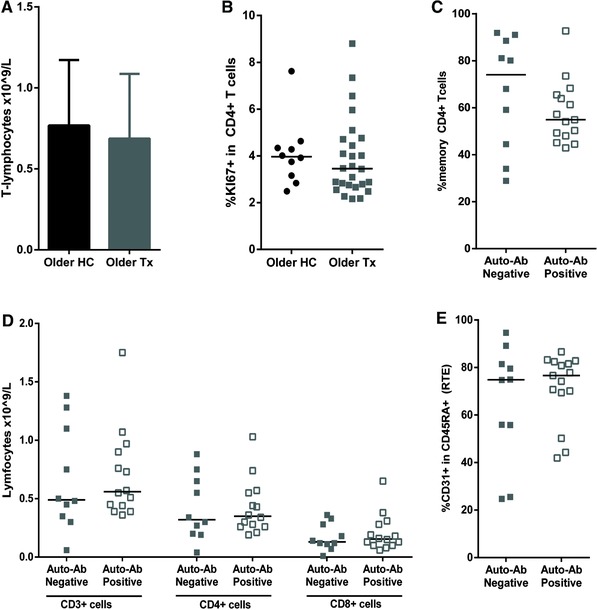
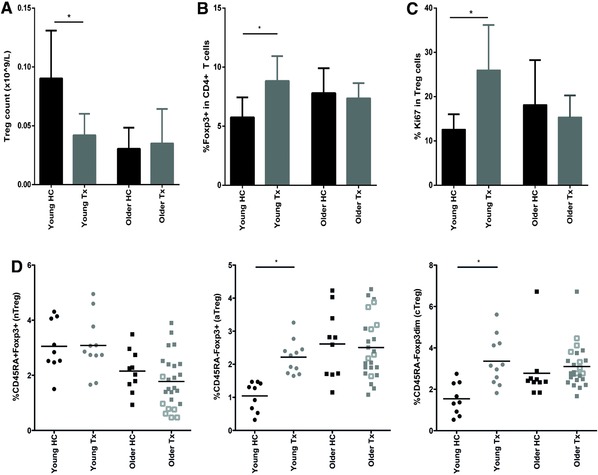
An association between T-cell lymphopenia and autoimmunity has long been proposed, but it remains to be elucidated whether T-cell lymphopenia affects B-cell responses to autoantigens. Human neonatal thymectomy (Tx) results in a decrease in T-cell numbers and we used this model to study the development of autoreactivity. Two cohorts of neonatally thymectomized individuals were examined, a cohort of young (1-5 years post-Tx, n = 10-27) and older children (>10 years, n = 26), and compared to healthy age-matched controls. T-cell and B-cell subsets were assessed and autoantibody profiling performed. Early post-Tx, a decrease in T-cell numbers (2.75 × 10⁹ /L vs. 0.71 × 10⁹ /L) and an increased proportion of memory T cells (19.72 vs. 57.43%) were observed. The presence of autoantibodies was correlated with an increased proportion of memory T cells in thymectomized children. No differences were seen in percentages of different B-cell subsets between the groups. The autoantigen microarray showed a skewed autoantibody response after Tx. In the cohort of older individuals, autoantibodies were present in 62% of the thymectomized children, while they were found in only 33% of the healthy controls. Overall, our data suggest that neonatal Tx skews the autoantibody profile. Preferential expansion and preservation of Treg (regulatory T) cell stability and function, may contribute to preventing autoimmune disease development after Tx.
Keywords: Autoimmunity; B cells; Homeostatic proliferation; Lymphopenia; Regulatory T cell; Thymectomy.
© 2017 The Authors. European Journal of Immunology published by WILEY-VCH Verlag GmbH & Co. KGaA, Weinheim.
Figures
Similar articles
-
Autoimmunity during thymectomy-induced lymphopenia: role of thymus ablation and initial effector T cell activation timing in nonobese diabetic mice.J Immunol. 2009 Oct 15;183(8):4913-20. doi: 10.4049/jimmunol.0901954. J Immunol. 2009. PMID: 19801516
-
Pathogenesis of post-thymectomy autoimmunity. Role of syngeneic MLR-reactive T cells.J Immunol. 1995 Jun 15;154(12):6602-11. J Immunol. 1995. PMID: 7759894
-
Major long-term changes in gamma delta T-cell receptor-positive and CD2+ T-cell subsets after neonatal thymectomy in the pig: a longitudinal study lasting nearly 2 years.Immunology. 1995 Jun;85(2):276-84. Immunology. 1995. PMID: 7642217 Free PMC article.
-
Autoantibodies Targeting Intracellular and Extracellular Proteins in Autoimmunity.Front Immunol. 2021 Mar 8;12:548469. doi: 10.3389/fimmu.2021.548469. eCollection 2021. Front Immunol. 2021. PMID: 33763057 Free PMC article. Review.
-
Immunological memory stabilizing autoreactivity.Curr Top Microbiol Immunol. 2006;305:241-57. doi: 10.1007/3-540-29714-6_12. Curr Top Microbiol Immunol. 2006. PMID: 16724809 Review.
Cited by
-
Early Thymectomy Is Associated With Long-Term Impairment of the Immune System: A Systematic Review.Front Immunol. 2021 Nov 25;12:774780. doi: 10.3389/fimmu.2021.774780. eCollection 2021. Front Immunol. 2021. PMID: 34899730 Free PMC article.
-
The Case for Cardiac Xenotransplantation in Neonates: Is Now the Time to Reconsider Xenotransplantation for Hypoplastic Left Heart Syndrome?Pediatr Cardiol. 2019 Feb;40(2):437-444. doi: 10.1007/s00246-018-1998-1. Epub 2018 Oct 9. Pediatr Cardiol. 2019. PMID: 30302505 Review.
-
Multi-Organ Transplantation in Adult Congenital Heart Disease: Navigating the Unique Challenges of a Distinct Patient Population.Methodist Debakey Cardiovasc J. 2025 May 15;21(3):72-82. doi: 10.14797/mdcvj.1576. eCollection 2025. Methodist Debakey Cardiovasc J. 2025. PMID: 40384737 Free PMC article. Review.
-
From heart to gut: Exploring the gut microbiome in congenital heart disease.Imeta. 2023 Oct 30;2(4):e144. doi: 10.1002/imt2.144. eCollection 2023 Nov. Imeta. 2023. PMID: 38868221 Free PMC article. Review.
-
Thymic hyperplasia in myasthenia gravis: a narrative review.Mediastinum. 2025 Jun 25;9:17. doi: 10.21037/med-25-12. eCollection 2025. Mediastinum. 2025. PMID: 40666538 Free PMC article. Review.
References
-
- Lobach, D. F. and Haynes, B. F. , Ontogeny of the human thymus during fetal development. J. Clin. Immunol. 1987. 7: 81–97. - PubMed
-
- Steinmann, G. G. , Klaus, B. and Müller‐Hermelink, H. K. , The involution of the ageing human thymic epithelium is independent of puberty. A morphometric study. Scand. J. Immunol. 1985. 22: 563–575. - PubMed
-
- den Braber, I. , Mugwagwa, T. , Vrisekoop, N. , Westera, L. , Mogling, R. , de Boer, A. B. , Willems, N. et al, Maintenance of peripheral naive T cells is sustained by thymus output in mice but not humans. Immunity 2012. 36: 288–297. - PubMed
-
- Sauce, D. , Larsen, M. , Fastenackels, S. , Roux, A. , Gorochov, G. , Katlama, C. , Sidi, D. et al, Lymphopenia‐driven homeostatic regulation of naive T cells in elderly and thymectomized young adults. J. Immunol. 2012. 189: 5541–5548. - PubMed
Publication types
MeSH terms
Substances
LinkOut - more resources
Full Text Sources
Other Literature Sources
