Case Reports
. 2017 Aug 1;127(8):3013-3027.
doi: 10.1172/JCI92069. Epub 2017 Jul 10.

Biallelic mutations in the ubiquitin ligase RFWD3 cause Fanconi anemia

Affiliations
Case Reports

Biallelic mutations in the ubiquitin ligase RFWD3 cause Fanconi anemia

Kerstin Knies et al. J Clin Invest. .

Abstract

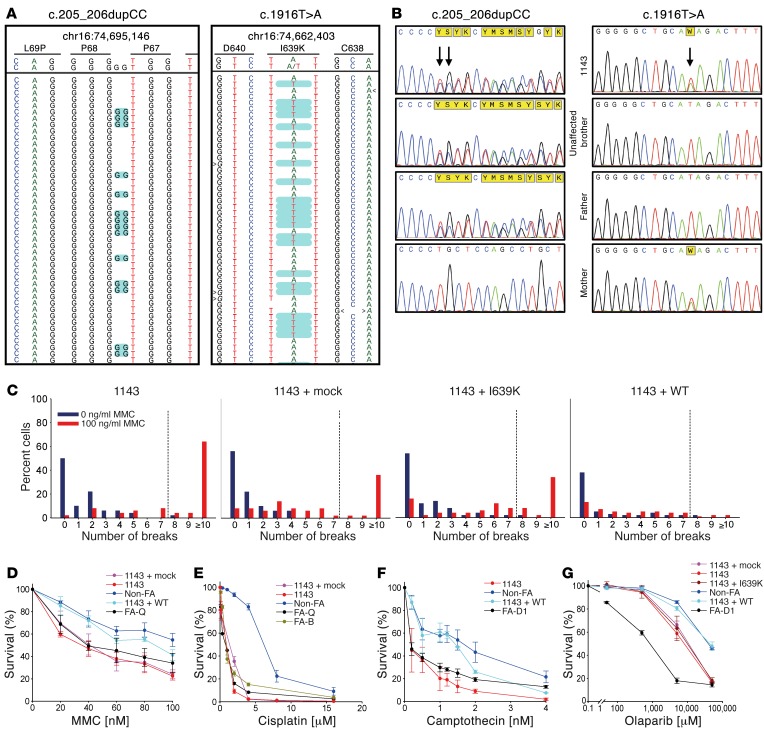
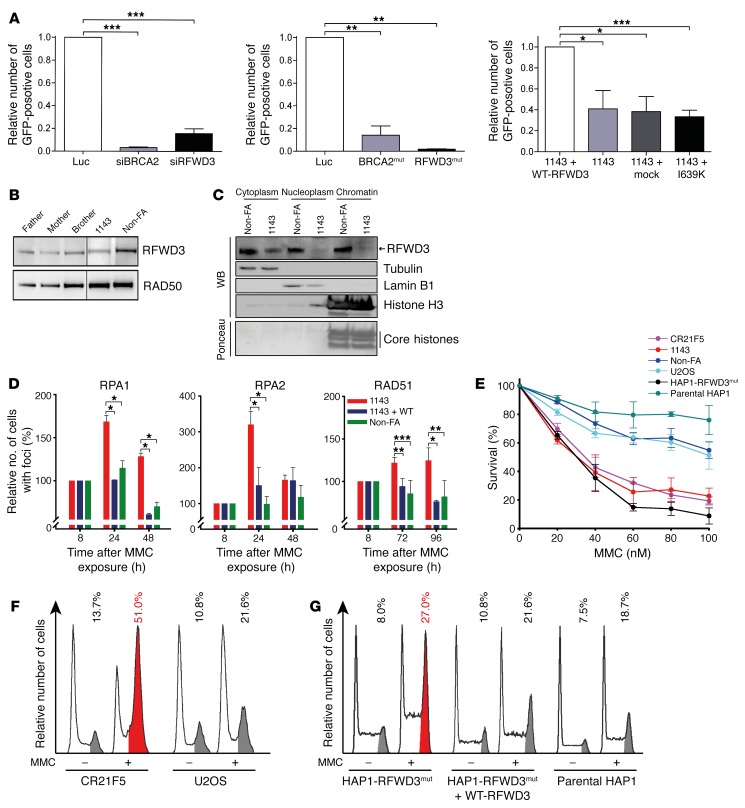
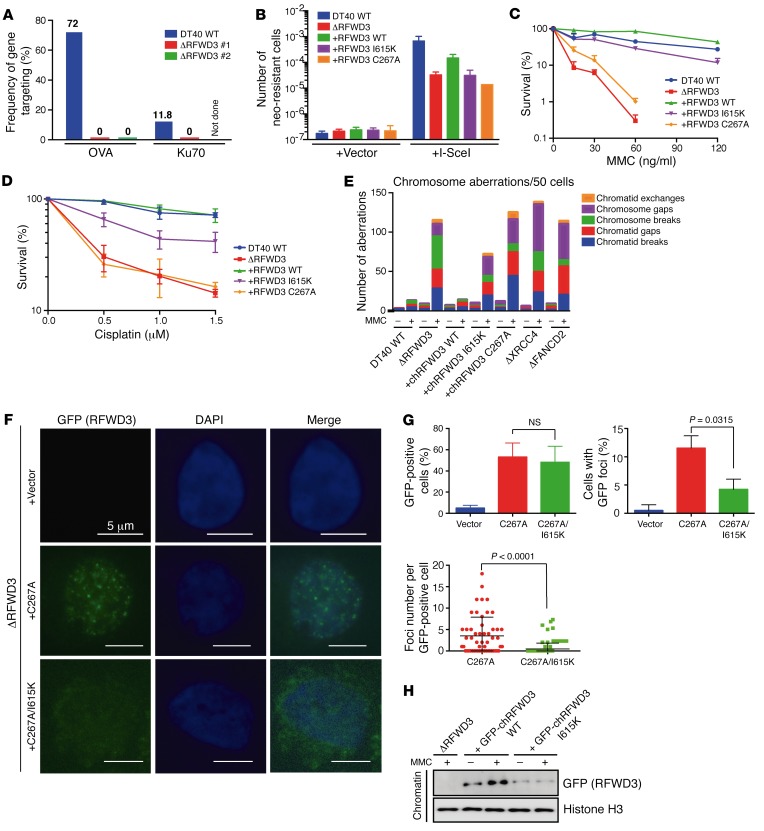
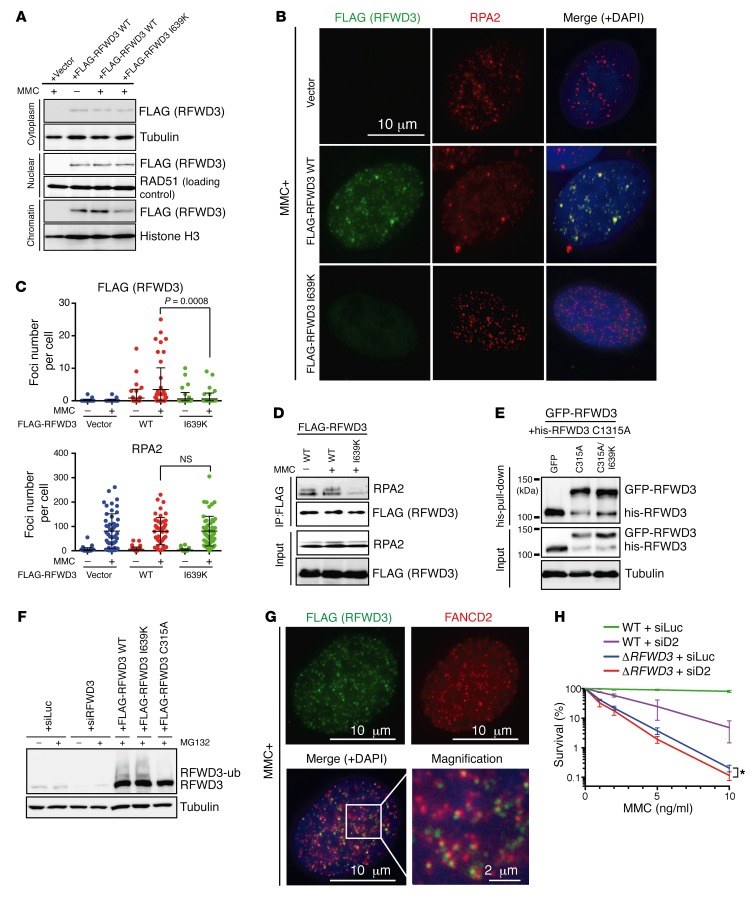
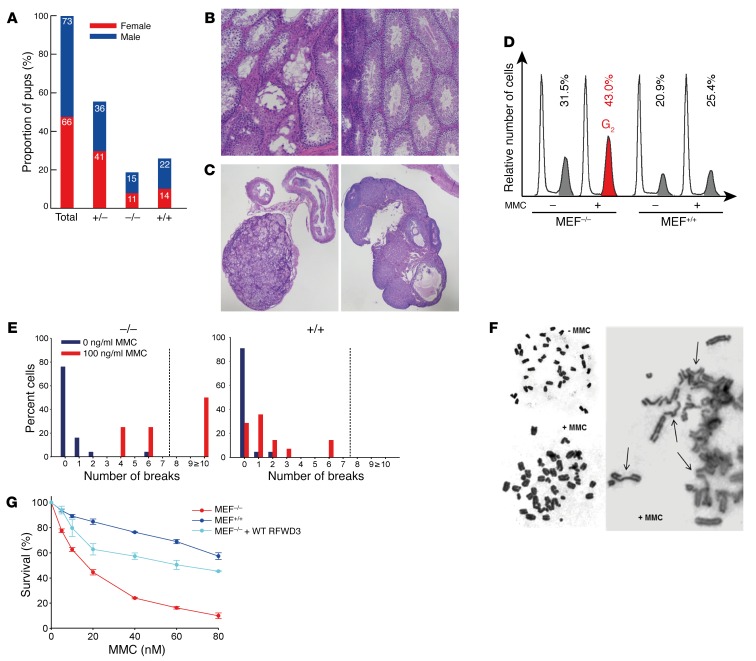
The WD40-containing E3 ubiquitin ligase RFWD3 has been recently linked to the repair of DNA damage by homologous recombination (HR). Here we have shown that an RFWD3 mutation within the WD40 domain is connected to the genetic disease Fanconi anemia (FA). An individual presented with congenital abnormalities characteristic of FA. Cells from the patient carrying the compound heterozygous mutations c.205_206dupCC and c.1916T>A in RFWD3 showed increased sensitivity to DNA interstrand cross-linking agents in terms of increased chromosomal breakage, reduced survival, and cell cycle arrest in G2 phase. The cellular phenotype was mirrored in genetically engineered human and avian cells by inactivation of RFWD3 or introduction of the patient-derived missense mutation, and the phenotype was rescued by expression of wild-type RFWD3 protein. HR was disrupted in RFWD3-mutant cells as a result of impaired relocation of mutant RFWD3 to chromatin and defective physical interaction with replication protein A. Rfwd3 knockout mice appear to have increased embryonic lethality, are subfertile, show ovarian and testicular atrophy, and have a reduced lifespan resembling that of other FA mouse models. Although RFWD3 mutations have thus far been detected in a single child with FA, we propose RFWD3 as an FA gene, FANCW, supported by cellular paradigm systems and an animal model.


Conflict of interest statement

Conflict of interest: The authors have declared that no conflict of interest exists.

Figures

Figure 1
Figure 1. Identification and characterization of RFWD3 mutation.
(A) WES data reveal 2 heterozygous sequence variants in the RFWD3 gene, highlighted in green. The gene is located on the minus strand; chromosomal and amino acid positions next to the mutations are depicted atop the sequence data. (B) Sanger sequencing confirms both mutations in individual 1143 and familial segregation. (C) Histograms reflecting proportions of cells with the indicated number of chromosomal breaks per metaphase, blue without, red after exposure to mitomycin C (MMC). Dashed lines delimit high rates (>7) of RFWD3-mutated (1143) and unproductively transduced fibroblasts (1143+mock, 1143+I630K). Rates of 1143+WT are rescued. Fifty metaphases each were scored. The 1143 plot is reused in Supplemental Figure 1B. (DG) Dose-response curves of the same cell lines used in C compared with non-FA and FA control (FA-Q, FA-B, or FA-D1) fibroblasts after exposure to the indicated agents and concentrations. The data represent mean ± SEM; N = 5. The 1143 and non-FA curves of D are reused in Figure 2E. The 1143 and non-FA curves of F are reused in Supplemental Figure 2G.
Figure 2
Figure 2. Involvement of RFWD3 in HR and ICL repair.
(A) Reduced HR in RFWD3-deficient human cells as signaled by the I-SceI–induced HR assay. Shown is the decrease of GFP-positive (HR-active) cells compared with controls. The left graph shows data from siRNA-transfected U2OS cells (luciferase [Luc; mock] vs. BRCA2 and RFWD3). The middle graph represents data from non-FA versus RFWD3-mutant 1143 and BRCA2/FANCD1-mutant fibroblasts, a disease-control FA-D1 line with the homozygous mutation c.469A>T (p.Lys157*). The right graph displays data from 1143 transduced with WT-RFWD3 versus mock, I639K, and nontransduced 1143 fibroblasts. All results are corrected for transfection rate and size of S phase. (B) Western blot with RFWD3 antibody including lysates from 1143, her family members, and non-FA fibroblasts exposed to MMC. Lanes were run on the same gel but were noncontiguous. (C) Cell fractionation of protein lysates from non-FA and 1143 fibroblasts exposed to MMC. (D) Proportion of RPA1, RPA2, and RAD51 foci–positive cells in 1143, 1143+WT-RFWD3–transduced, and non-FA fibroblasts at different intervals after an initial 8-hour pulse of MMC exposure. (E) Dose-response curves of CRISPR clone CR21F5 versus parental U2OS cells, HAP1-RFWD3 versus HAP1 control cells, and 1143 versus non-FA fibroblasts exposed to MMC. The 1143 and non-FA curves are reused in Figure 1D. (F and G) Cell cycle analysis regarding G2-phase arrest of CRISPR clone CR21F5 versus parental U2OS cells and of HAP1-RFWD3 versus HAP1-RFWD3+WT–complemented and HAP1 control cells without or with exposure to MMC. Increased G2 compartment size is highlighted in red; normal size is shown in gray. Data in A, D, and E represent mean ± SEM; N = 3 for siRNA experiments, otherwise N = 5. *P < 0.05; **P < 0.01; ***P < 0.001 by unpaired, 2-tailed Student’s t test.
Figure 3
Figure 3. Functional analyses of ΔRFWD3 DT40 cells.
(A) Frequency of gene targeting at the ovalbumin (OVA) and KU70 loci of WT DT40 cells (blue) and 2 independently generated ΔRFWD3 DT40 cell lines (#1, red; #2, green). Percentages of the targeting events relative to the number of examined clones are shown on top of each bar. (B) Frequency of neo-resistant DT40 colonies due to HR events in the SCneo recombination substrate integrated in the OVA locus. Cells with indicated genotypes were transiently transfected with empty vector (+Vector) or with vector containing I-SceI (+I-SceI) and selected in medium containing G418. After 10–14 days the number of colonies was counted. (C and D) Dose-response curves of WT DT40 cells versus ΔRFWD3 DT40 cells and ΔRFWD3 DT40 cells transfected with WT-RFWD3, RFWD3-I615K, or RFWD3-C267A. Cells were exposed to MMC or cisplatin. (E) Histograms reflecting proportions of cells with the indicated number of chromosomal lesions per metaphase in WT DT40 and mutant cells with the indicated genotypes and transfections without or with exposure to MMC. Fifty cells each were scored. (F) GFP immunofluorescence analysis of ΔRFWD3 DT40 fibroblasts transiently transfected with mock, GFP-chRFWD3-C267A, or the double mutant GFP-chRFWD3-C267A/I615K after exposure to MMC. (G) Proportion of GFP-RFWD3–positive ΔRFWD3 DT40 cells (top panel) and GFP-RFWD3 foci–positive ΔRFWD3 DT40 cells (>5, middle panel) and number of GFP-RFWD3 foci in individual GFP-RFWD3 foci–positive ΔRFWD3 DT40 cells (bottom panel) after transfection with the indicated plasmids. Cells are those used in F. (H) Relocation of GFP-RFWD3 in ΔRFWD3 DT40 cells transfected with the indicated plasmids without and with exposure to MMC. Fractions were probed using anti-GFP and anti–histone 3 antibodies. Data in BD and G represent mean ± SEM; N = 3. Significance in G determined by unpaired, 2-tailed Student’s t test. NS, not significant.
Figure 4
Figure 4. Interaction studies of human RFWD3.
(A) Cell fractionation shows impaired chromatin relocation of RFWD3 with the mutation in the WD40 domain when U2OS cells were transiently transfected with FLAG-WT-RFWD3 or FLAG-RFWD3-I639K and exposed to MMC as indicated. (B) FLAG-RFWD3 immunofluorescence analysis of the same cells used in A exposed to MMC. Anti-FLAG detected RFWD3, anti-RPA2 detected endogenous RPA, and DAPI counterstains the nucleus. (C) Number of FLAG-RFWD3 (top graph) and RPA2 (bottom graph) foci per nucleus without or with exposure to MMC. Cells are those used in A. More than 50 cells were counted for each sample. The experiment was repeated 4 times. Data represent mean ± SD. P values of WT versus I639K were calculated using the unpaired, 2-tailed Student’s t test. NS, not significant. (D) Coimmunoprecipitation of FLAG-WT-RFWD3 or FLAG-RFWD3-I639K with RPA2 in transiently transfected U2OS cells without or with exposure to MMC. (E) Pull-down study of GFP-RFWD3 and his-RFWD3 dimerization in U2OS cells transiently transfected with GFP, GFP-RFWD3-C315A (RING mutation), or GFP-RFWD3-C315A/I639K (double mutation). Detection was by anti-his and anti-GFP antibodies. (F) Auto-ubiquitination of FLAG-WT-RFWD3, FLAG-RFWD3-I639K, or FLAG-RFWD3-C315A in transiently transfected U2OS cells without or with exposure to the proteasome inhibitor MG132. siLuc and siRFWD3 served as negative controls. Detection was by anti-RFWD3. (G) Colocalization of FLAG-RFWD3 and FANCD2. U2OS cells were transiently transfected with FLAG-RFWD3 and exposed to MMC (100 ng/ml for 24 hours). (H) Survival curves of WT HAP1 and RFWD3-mutated HAP1 cells transfected with siRNAs to luciferase (Luc) or FANCD2 (D2) and exposed to MMC. Means ± SD of 3 independent experiments are shown. Depletion of FANCD2 and BRCA2 (control) was analyzed by immunoblotting and is shown in Supplemental Figure 2, H and I. The P value (*P < 0.05) of ΔRFWD3+siLuc versus ΔRFWD3+siD2 was calculated using the Tukey’s range test.
Figure 5
Figure 5. Characterization of an Rfwd3–/– mouse model.
(A) Numbers and proportions of female (red) and male (blue) Rfwd3+/–, Rfwd3–/–, and Rfwd3+/+ mouse offspring of heterozygous mating. Rfwd3–/– pups were born at a sub-Mendelian rate. (B) Left panel displays atrophic Rfwd3–/– mouse testis. Remaining seminiferous tubules have little active spermatogenesis and few spermatozoa. Right panel shows Rfwd3+/+ testis with normal spermatogenesis for control. The original micrographs were taken at ×40. (C) Left panel displays atrophic Rfwd3–/– mouse ovary. There are clusters of luteal cells within a delicate stroma, but there is no follicular development. Right panel shows Rfwd3+/+ ovary with normal follicular development for control. The original micrographs were taken at ×40. (D) Cell cycle analysis examining G2-phase arrest in Rfwd3–/– versus Rfwd3+/+ MEFs without or with exposure to MMC. Increased G2 compartment size is highlighted in red, normal size shown in gray. (E) Histograms reflecting proportions of cells with the indicated number of chromosomal breaks per metaphase, blue without, red after exposure to MMC, in Rfwd3–/– and Rfwd3+/+ MEFs. Fifty cells each were scored. Sensitivity is indicated by the high rate of metaphases with more than 7 breaks (dashed line). Fifty metaphases each were scored. (F) Micrographs of Rfwd3–/– MEF metaphase preparations. Unaffected cell without prior exposure to MMC (top left), increased chromosomal breakage after exposure to MMC (bottom left), and predominance of chromatid-type lesions and radial reunion figures (arrows, right) after exposure to MMC. The original micrographs were taken at ×100. (G) Dose-response curves of Rfwd3–/– MEFs, Rfwd3+/+ MEFs, and Rfwd3–/– MEFs transduced with human WT-RFWD3 exposed to MMC. The data represent mean ± SEM; N = 3.

References

    1. Kutler DI, et al. High incidence of head and neck squamous cell carcinoma in patients with Fanconi anemia. Arch Otolaryngol Head Neck Surg. 2003;129(1):106–112. doi: 10.1001/archotol.129.1.106. - DOI - PubMed
    1. Auerbach AD. Fanconi anemia and its diagnosis. Mutat Res. 2009;668(1–2):4–10. - PMC - PubMed
    1. Kutler DI, et al. Natural history and management of Fanconi anemia patients with head and neck cancer: A 10-year follow-up. Laryngoscope. 2016;126(4):870–879. doi: 10.1002/lary.25726. - DOI - PMC - PubMed
    1. Alter BP. Fanconi anemia and the development of leukemia. Best Pract Res Clin Haematol. 2014;27(3–4):214–221. - PMC - PubMed
    1. Kottemann MC, Smogorzewska A. Fanconi anaemia and the repair of Watson and Crick DNA crosslinks. Nature. 2013;493(7432):356–363. doi: 10.1038/nature11863. - DOI - PMC - PubMed

Publication types

MeSH terms