. 2017 Jul 10:2:17112.
doi: 10.1038/nmicrobiol.2017.112.

Bacteriophage evolution differs by host, lifestyle and genome

Affiliations

Bacteriophage evolution differs by host, lifestyle and genome

Travis N Mavrich et al. Nat Microbiol. .

Abstract

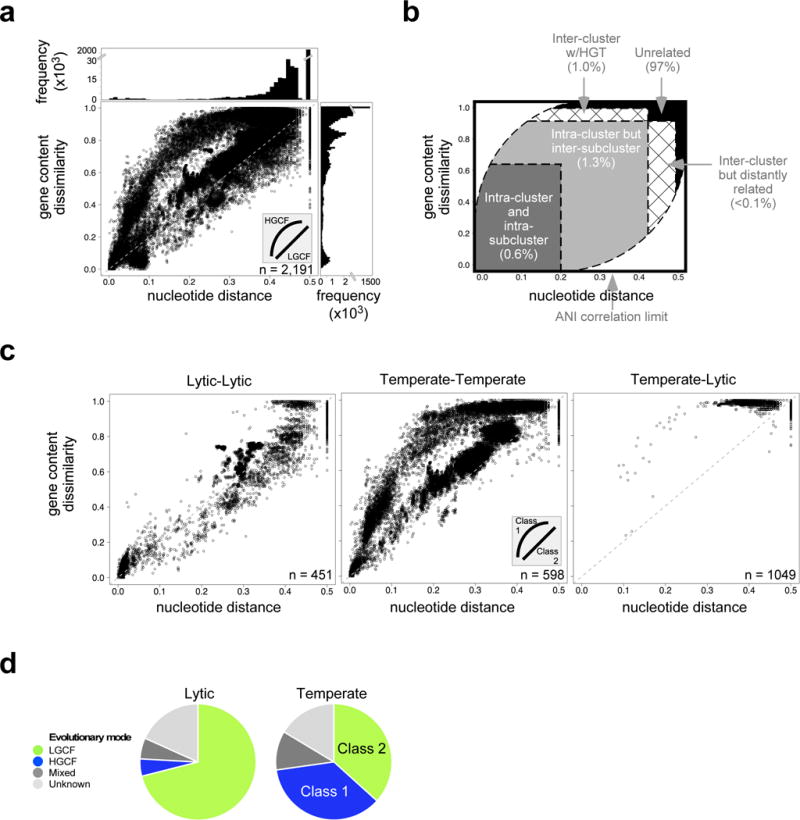
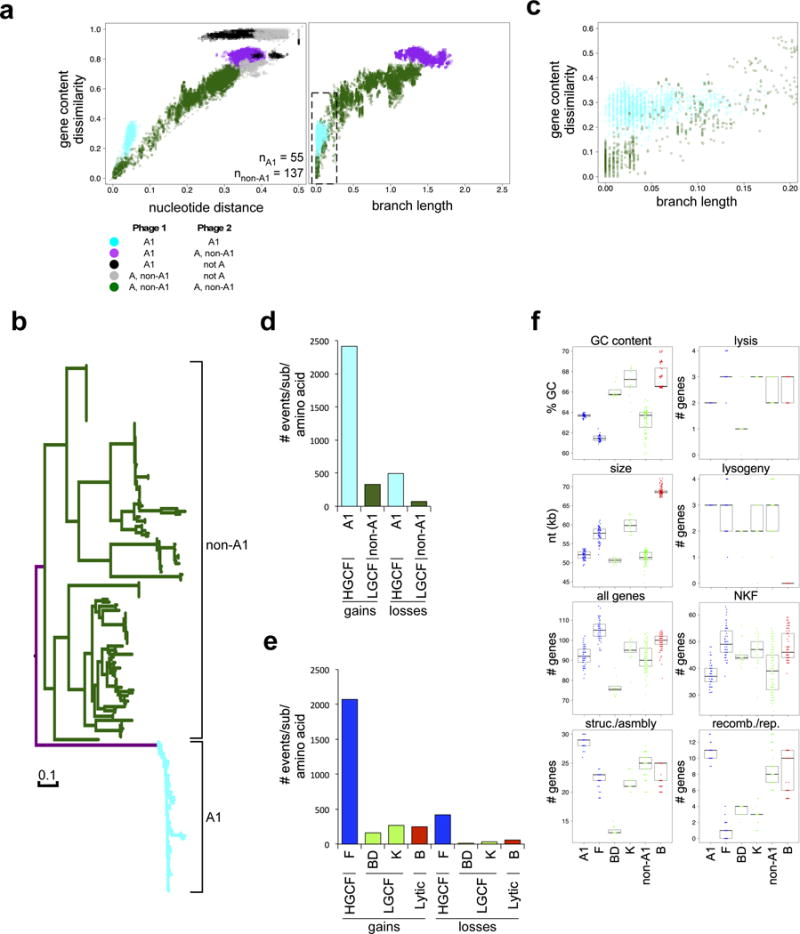
Bacteriophages play key roles in microbial evolution1,2, marine nutrient cycling3 and human disease4. Phages are genetically diverse, and their genome architectures are characteristically mosaic, driven by horizontal gene transfer with other phages and host genomes5. As a consequence, phage evolution is complex and their genomes are composed of genes with distinct and varied evolutionary histories6,7. However, there are conflicting perspectives on the roles of mosaicism and the extent to which it generates a spectrum of genome diversity8 or genetically discrete populations9,10. Here, we show that bacteriophages evolve within two general evolutionary modes that differ in the extent of horizontal gene transfer by an order of magnitude. Temperate phages distribute into high and low gene flux modes, whereas lytic phages share only the lower gene flux mode. The evolutionary modes are also a function of the bacterial host and different proportions of temperate and lytic phages are distributed in either mode depending on the host phylum. Groups of genetically related phages fall into either the high or low gene flux modes, suggesting there are genetic as well as ecological drivers of horizontal gene transfer rates. Consequently, genome mosaicism varies depending on the host, lifestyle and genetic constitution of phages.


Conflict of interest statement

Author Information

The authors declare no competing financial interests.

Figures

Figure 1
Figure 1. Two evolutionary modes correlate with phage lifestyle
a, Nucleotide distance (using Mash) and gene content dissimilarity (using phams from Phamerator) are plotted for ~2.4 × 10⁶ dsDNA phage comparisons to reveal two evolutionary modes (inset). The line at y = 2x is plotted for reference. Marginal frequency histograms emphasize densely-plotted regions, with truncated y axes for viewability. b, Defined genomic similarity plot sectors (dotted lines) highlight various genomic relationships (see Methods), including the percentage of dsDNA phage comparisons in panel a that are positioned in each sector. c, Comparisons involving two lytic (left), two temperate (middle), or one lytic and temperate phage are plotted (right) as in panel a. d, Pie charts reflecting the proportion of predicted lytic and temperate phages in the dataset that exhibit the HGCF or LGCF mode. Two classes of temperate phages are apparent: those with HGCF (class 1) and those with LGCF (class 2). n = number of phages used for the analysis (distinct from the number of comparisons plotted).
Figure 2
Figure 2. Phage clusters exhibit unique evolutionary trajectories
a, Cluster-specific intra-cluster (orange) and inter-cluster (black) comparisons are plotted as in Figure 1a for representative actinobacteriophage clusters and grouped by their predicted or known lifestyle, with cluster and host genus indicated. n = number of phages present in the specific cluster. b, Stacked bargraphs for 44 actinobacteriophage clusters in which the evolutionary mode of their constituent phages could be determined, along with their predicted lifestyle. For each cluster, the percentage of the constituent phages that are predicted to be temperate or lytic, along with the percentage of the constituent phages that are predicted to be in each evolutionary mode, are indicated. c, Pie chart reflecting the proportion of all actinobacteriophage clusters in each mode (same color scheme as in panel b). d, BLAST-based whole genome alignments of two individual phage comparisons highlight class 1 (Cluster F phages Bobi and Cerasum) and class 2 (Cluster A phages Bactobuster and RhynO) temperate phages. Both comparisons have approximately equal gene content dissimilarities (0.51 and 0.50, respectively) but markedly unequal whole genome nucleotide distances (0.07 and 0.25, respectively). Spectrum color shading reflects BLASTN e-value significance of aligned regions, ranging from unrelated (white) to closely related (violet).
Figure 3
Figure 3. Evolutionary modes correlate with different rates of HGT
a Mycobacteriophage Cluster A-specific comparisons are plotted (left) similar to Fig. 2, but subcluster relationships are highlighted. Cluster A comparisons involving two Subcluster A1 phages (cyan), two non-Subcluster A1 phages (dark green), one Subcluster A1 and one non-Subcluster A1 phage (purple), one Subcluster A1 and one non-Cluster A phage (black), and one non-Subcluster A1 and one non-Cluster A phage (grey) are plotted. Subcluster A1 phages exhibit HGCF compared to other Cluster A phages. n = number of Cluster A phages in Subcluster A1 (nA1) and Subclusters A2-A17 (nnon-A1). The same Cluster A gene content dissimilarities were plotted (right) against pairwise branch lengths from the phylogenetic tree in panel b. Box indicates the area of the plot enlarged in panel c. b, Phylogenetic tree of all Cluster A phages based on structural/assembly genes. All branches are colored as in panel a, highlighting that all A1 phages form a monophyletic clade. c, Enlarged area of plot in panel a (right) to highlight different patterns of gene content changes. d, Bar graph of the predicted number of pham gains and losses per substitution per amino acid site for A1 and non-A1 phages. e, Bar graph of the predicted number of pham gains and losses as in panel d for additional representative clusters (colored as in Supplementary Fig. 8a). f, Comparison of phages in specific representative clusters in the phylogenetic analysis, using several genome metrics such as GC content, genome size (size), and the number of all genes or genes in functional categories per genome (struc./asmbly = structural and assembly; recomb./rep. = recombination and replication; NKF = no known function). Each data point is a phage genome, and boxplots depict the middle 50% of the data surrounding the median (black bar).
Figure 4
Figure 4. Host phyla exhibit diversity in phage evolutionary modes
a-e, Genomic similarities in Figure 1a were divided based on the five most predominant host phyla. Each host phylum displays unique phage genomic similarity profiles, indicating that patterns of phage evolution vary based on host. Pie charts reflect the proportion of phages of each host phylum that are predicted to be in each mode for each predicted lifestyle, as in Fig. 1d (L = lytic, T = temperate). n = number of phages present in the host phylum that were used for the analysis.

References

    1. Canchaya C, Fournous G, Brussow H. The impact of prophages on bacterial chromosomes. Mol Microbiol. 2004;53:9–18. doi: 10.1111/j.1365-2958.2004.04113.x. - DOI - PubMed
    1. Bondy-Denomy J, et al. Prophages mediate defense against phage infection through diverse mechanisms. ISME J. 2016 doi: 10.1038/ismej.2016.79. - DOI - PMC - PubMed
    1. Rodriguez-Brito B, et al. Viral and microbial community dynamics in four aquatic environments. Isme J. 2010;4:739–751. - PubMed
    1. Brussow H, Canchaya C, Hardt WD. Phages and the evolution of bacterial pathogens: from genomic rearrangements to lysogenic conversion. Microbiol Mol Biol Rev. 2004;68:560–602. - PMC - PubMed
    1. Pedulla ML, et al. Origins of highly mosaic mycobacteriophage genomes. Cell. 2003;113:171–182. - PubMed

Methods References

    1. Cock PJ, et al. Biopython: freely available Python tools for computational molecular biology and bioinformatics. Bioinformatics. 2009;25:1422–1423. - PMC - PubMed
    1. Huerta-Cepas J, Dopazo J, Gabaldon T. ETE: a python Environment for Tree Exploration. BMC bioinformatics. 2010;11:24. doi: 10.1186/1471-2105-11-24. - DOI - PMC - PubMed
    1. McNair K, Bailey BA, Edwards RA. PHACTS, a computational approach to classifying the lifestyle of phages. Bioinformatics. 2012;28:614–618. doi: 10.1093/bioinformatics/bts014. - DOI - PMC - PubMed
    1. Leplae R, Lima-Mendez G, Toussaint A. ACLAME: a CLAssification of Mobile genetic Elements, update 2010. Nucleic Acids Res. 2010;38:D57–61. - PMC - PubMed
    1. Chithambaram S, Prabhakaran R, Xia X. Differential codon adaptation between dsDNA and ssDNA phages in Escherichia coli. Mol Biol Evol. 2014;31:1606–1617. doi: 10.1093/molbev/msu087. - DOI - PMC - PubMed