. 2018 Apr;25(4):523-539.
doi: 10.1177/1933719117716779. Epub 2017 Jul 11.

Prenatal Growth Patterns and Birthweight Are Associated With Differential DNA Methylation and Gene Expression of Cardiometabolic Risk Genes in Human Placentas: A Discovery-Based Approach

Affiliations

Prenatal Growth Patterns and Birthweight Are Associated With Differential DNA Methylation and Gene Expression of Cardiometabolic Risk Genes in Human Placentas: A Discovery-Based Approach

Pao-Yang Chen et al. Reprod Sci. 2018 Apr.

Abstract

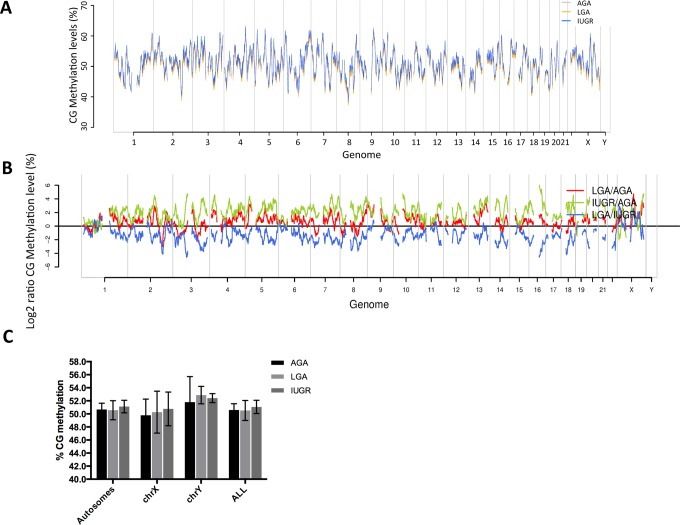
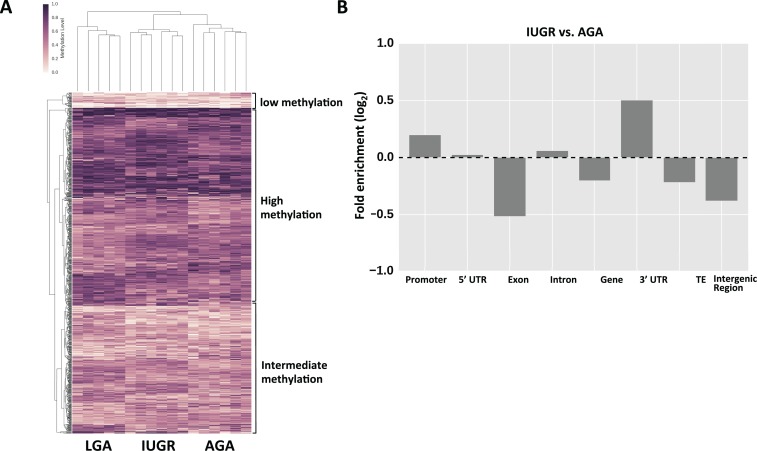
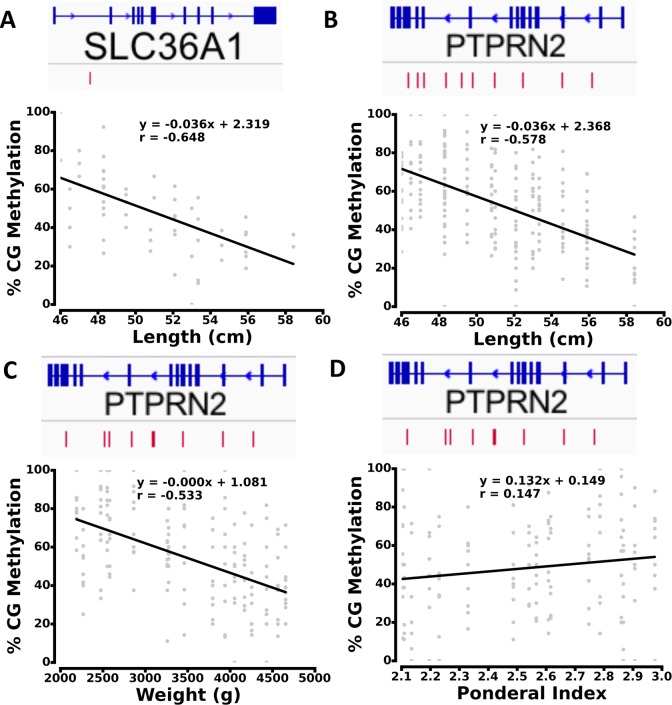
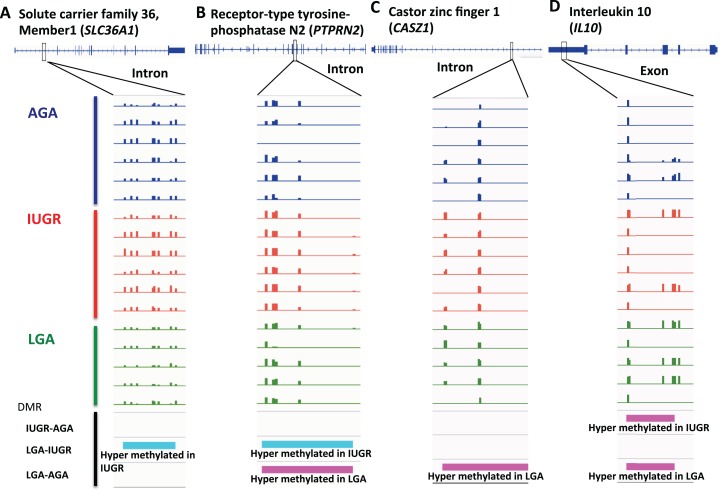
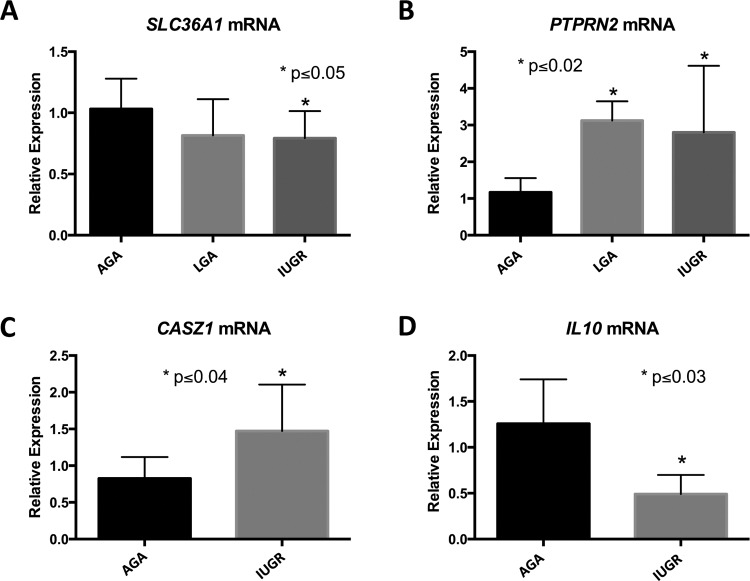
Inherent genetic programming and environmental factors affect fetal growth in utero. Epidemiologic data in growth-altered fetuses, either intrauterine growth restricted (IUGR) or large for gestational age (LGA), demonstrate that these newborns are at increased risk of cardiometabolic disease in adulthood. There is growing evidence that the in utero environment leads to epigenetic modification, contributing to eventual risk of developing heart disease or diabetes. In this study, we used reduced representation bisulfite sequencing to examine genome-wide DNA methylation variation in placental samples from offspring born IUGR, LGA, and appropriate for gestational age (AGA) and to identify differential methylation of genes important for conferring risk of cardiometabolic disease. We found that there were distinct methylation signatures for IUGR, LGA, and AGA groups and identified over 500 differentially methylated genes (DMGs) among these group comparisons. Functional and gene network analyses revealed expected relationships of DMGs to placental physiology and transport, but also identified novel pathways with biologic plausibility and potential clinical importance to cardiometabolic disease. Specific loci for DMGs of interest had methylation patterns that were strongly associated with anthropometric presentations. We further validated altered gene expression of these specific DMGs contributing to vascular and metabolic diseases (SLC36A1, PTPRN2, CASZ1, IL10), thereby establishing transcriptional effects toward assigning functional significance. Our results suggest that the gene expression and methylation state of the human placenta are related and sensitive to the intrauterine environment, as it affects fetal growth patterns. We speculate that these observed changes may affect risk for offspring in developing adult cardiometabolic disease.

Keywords: DNA methylation; developmental programming of cardiometabolic disease; intrauterine growth restriction (IUGR); large for gestational age (LGA); placenta.


Conflict of interest statement

Declaration of Conflicting Interests: The author(s) declared no potential conflicts of interest with respect to the research, authorship, and/or publication of this article.

Figures

Figure 1.
Figure 1.
Profiling of genome wide DNA methylation in human placenta. A, Genome-wide cytosine-guanine pairing methylation levels (%) in AGA (gray), LGA (yellow), and IUGR (blue) groups. B, Log2 ratios of CG methylation level (%) in pair-wise comparisons (red: LGA vs AGA, green: IUGR vs AGA, blue: LGA vs IUGR). C, Average CG methylation levels in autosomes and sex chromosomes (dark gray: AGA, light gray: LGA, medium gray: IUGR). AGA indicates appropriate for gestational age; IUGR, intrauterine growth restriction; LGA, large for gestational age.
Figure 2.
Figure 2.
Differentially methylated regions. A, Heatmap of methylation variable regions across LGA, IUGR, and AGA groups. Darker color denotes higher methylation levels, while lighter colors denote low methylation levels. B, Enrichment analysis of DMR location between IUGR and AGA. Similar patterns were seen comparing LGA and AGA groups (data not shown). AGA indicates appropriate for gestational age; DMR, differentially methylated region; IUGR, intrauterine growth restriction; LGA, large for gestational age.
Figure 3.
Figure 3.
Scatter plot of high covariance methylation sites with phenotypes. Covariance between methylation sites and length in: (A) SLC36A1, and (B) PTPRN2. C, Covariance between methylation sites and weight in PTPRN2. D, Covariance between methylation sites and Ponderal index in PTPRN2. The red bars in the gene models show the distribution of high covariance cytosines.
Figure 4.
Figure 4.
Screenshots of DNA methylation tracks in selected genes. A, DMR in SLC36A1 intron is hypermethylated in IUGR comparing with LGA. B, DMR in PTPRN2 intron is hypermethylated in IUGR comparing with LGA, but hypermethylated in LGA comparing with AGA. C, DMR in CASZ1 intron is hypermethylated in LGA comparing with AGA. D, DMR in IL10 exon is hypermethylated in IUGR and LGA, compared to AGA. (magenta: hyper; cyan: hypo). AGA indicates appropriate for gestational age; DMR, differentially methylated region; IL10, interleukin 10; IUGR, intrauterine growth restriction; LGA, large for gestational age.
Figure 5.
Figure 5.
q-PCR validation of gene expression. A, SLC36A1 mRNA expression levels in AGA, LGA and IUGR groups. B, PTPRN2 mRNA expression levels in AGA, LGA, and IUGR groups. C, CASZ1 mRNA expression levels in AGA and IUGR groups. D, IL10 mRNA expression levels in AGA and IUGR groups. Data are presented as mean ± SD. All statistical analyses were performed using GraphPad Prism software. Two groups were compared by Student t test with normal distribution, and 3 groups compared by ANOVA with Fisher LSD between groups. Significance was assigned at P ≤ .05. AGA indicates appropriate for gestational age; ANOVA, analysis of variance; DMR, differentially methylated region; IUGR, intrauterine growth restriction; LGA, large for gestational age; q-PCR, quantitative polymerase chain reaction; SD, standard deviation; LSD, least significant difference.

References

    1. Maccani MA, Marsit CJ. Epigenetics in the placenta. Am J Reprod Immunol. 2009;62(2):78–89. - PMC - PubMed
    1. Feil R, Fraga MF. Epigenetics and the environment: emerging patterns and implications. Nat Rev Genet. 2012;13(2):97–109. - PubMed
    1. Manolio TA, Collins FS, Cox NJ, et al. Finding the missing heritability of complex diseases. Nature. 2009;461(7265):747–753. - PMC - PubMed
    1. Godfrey KM, Barker DJ. Fetal programming and adult health. Public Health Nutr. 2001;4(2B):611–624. - PubMed
    1. Curhan GC, Chertow GM, Willett WC, et al. Birth weight and adult hypertension and obesity in women. Circulation. 1996;94(6):1310–1315. - PubMed

Publication types