

Demographics of dogs, cats, and rabbits attending veterinary practices in Great Britain as recorded in their electronic health records
- PMID: 28693574
- PMCID: PMC5504643
- DOI: 10.1186/s12917-017-1138-9
Demographics of dogs, cats, and rabbits attending veterinary practices in Great Britain as recorded in their electronic health records
Abstract
Background: Understanding the distribution and determinants of disease in animal populations must be underpinned by knowledge of animal demographics. For companion animals, these data have been difficult to collect because of the distributed nature of the companion animal veterinary industry. Here we describe key demographic features of a large veterinary-visiting pet population in Great Britain as recorded in electronic health records, and explore the association between a range of animal's characteristics and socioeconomic factors.
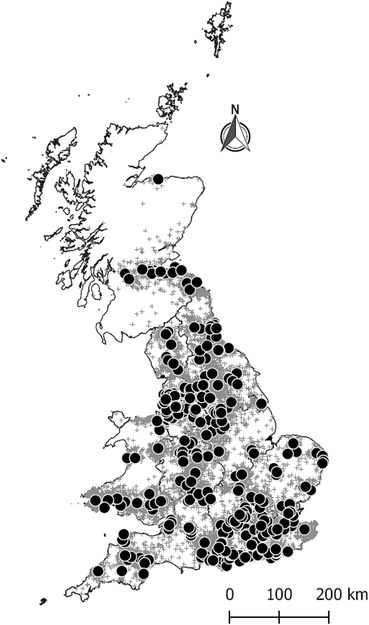
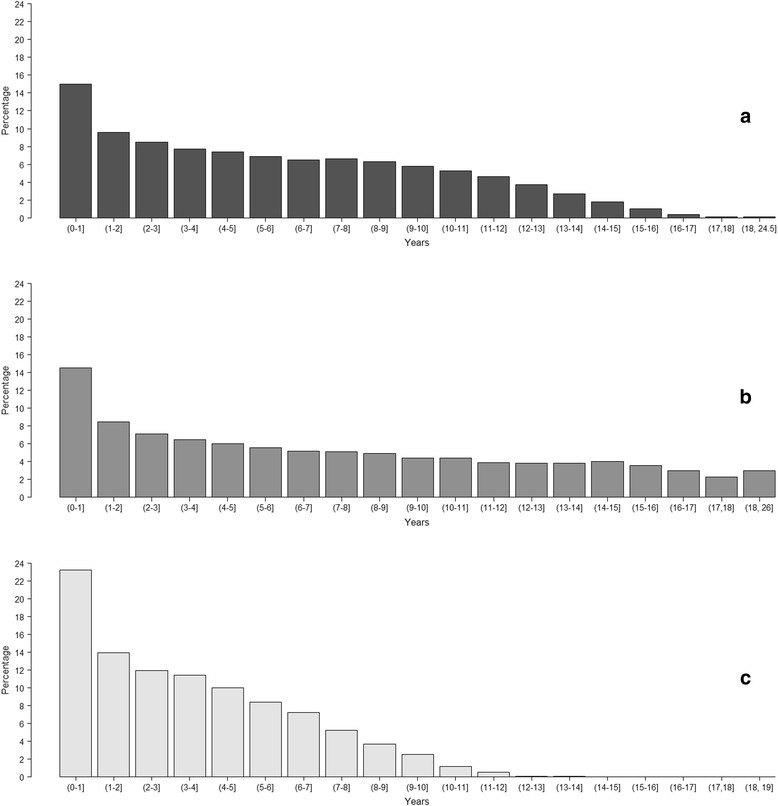
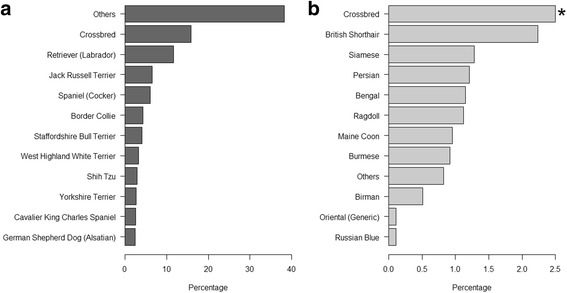
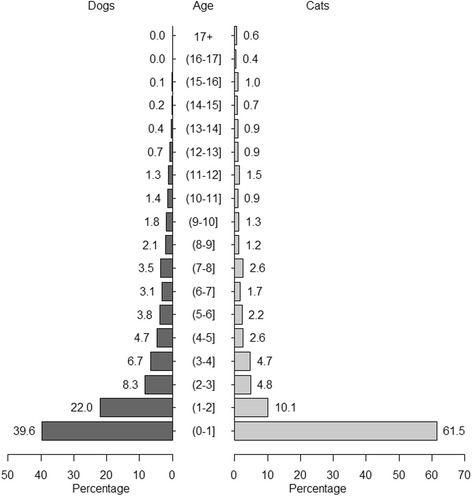
Results: Electronic health records were captured by the Small Animal Veterinary Surveillance Network (SAVSNET), from 143 practices (329 sites) in Great Britain. Mixed logistic regression models were used to assess the association between socioeconomic factors and species and breed ownership, and preventative health care interventions. Dogs made up 64.8% of the veterinary-visiting population, with cats, rabbits and other species making up 30.3, 2.0 and 1.6% respectively. Compared to cats, dogs and rabbits were more likely to be purebred and younger. Neutering was more common in cats (77.0%) compared to dogs (57.1%) and rabbits (45.8%). The insurance and microchipping relative frequency was highest in dogs (27.9 and 53.1%, respectively). Dogs in the veterinary-visiting population belonging to owners living in least-deprived areas of Great Britain were more likely to be purebred, neutered, insured and microchipped. The same association was found for cats in England and for certain parameters in Wales and Scotland.
Conclusions: The differences we observed within these populations are likely to impact on the clinical diseases observed within individual veterinary practices that care for them. Based on this descriptive study, there is an indication that the population structures of companion animals co-vary with human and environmental factors such as the predicted socioeconomic level linked to the owner's address. This 'co-demographic' information suggests that further studies of the relationship between human demographics and pet ownership are warranted.
Keywords: Companion animals; Demographics; Electronic health records; SAVSNET; Socioeconomic factors.
Conflict of interest statement
Ethics approval and consent to participate
Ethics approval for this project came from the University of Liverpool Committee on Research Ethics (CORE) (RETH00964). Consent to participate is recognised via an opt-out process available to all companion animal owners at veterinary clinics participating in SAVSNET. Specifically, owners attending clinics participating in SAVSNET are informed about the project by a waiting room poster; those wishing to opt out are invited to tell their practitioner, who can then exclude all their data from the study. These opted out consultations are quantifiable for each practice, but no further data are captured by SAVSNET. There is no explicit requirement to check each owner has seen the poster because this would not be practical in a busy practice. This consenting process was felt proportionate to the risk by the ethics committee as we only collect anonymised data, and only data relating to the consultation in question (we do not collect the full health record).
Consent for publication
Not applicable.
Competing interests
The authors declare that they have no competing interests.
Publisher’s Note
Springer Nature remains neutral with regard to jurisdictional claims in published maps and institutional affiliations.
Figures
References
MeSH terms
Grants and funding
LinkOut - more resources
Full Text Sources
Other Literature Sources
Miscellaneous
