. 2017 Oct;23(10):1502-1511.
doi: 10.1261/rna.056408.116. Epub 2017 Jul 10.

The contribution of the C5 protein subunit of Escherichia coli ribonuclease P to specificity for precursor tRNA is modulated by proximal 5' leader sequences

Affiliations

The contribution of the C5 protein subunit of Escherichia coli ribonuclease P to specificity for precursor tRNA is modulated by proximal 5' leader sequences

Courtney N Niland et al. RNA. 2017 Oct.

Abstract

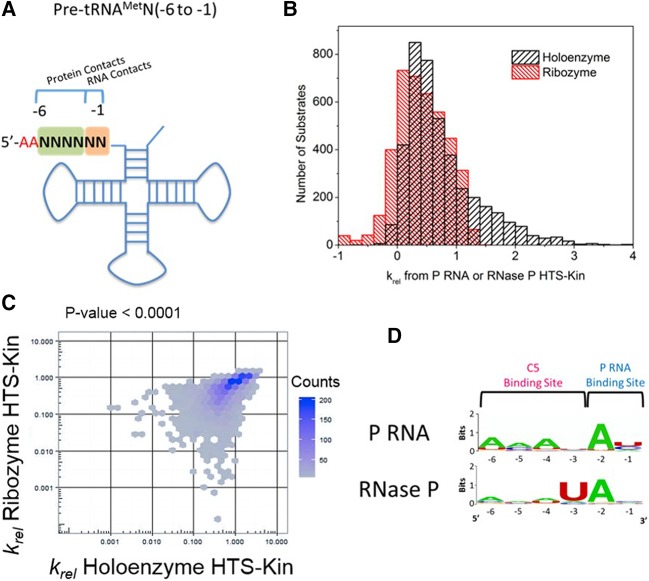
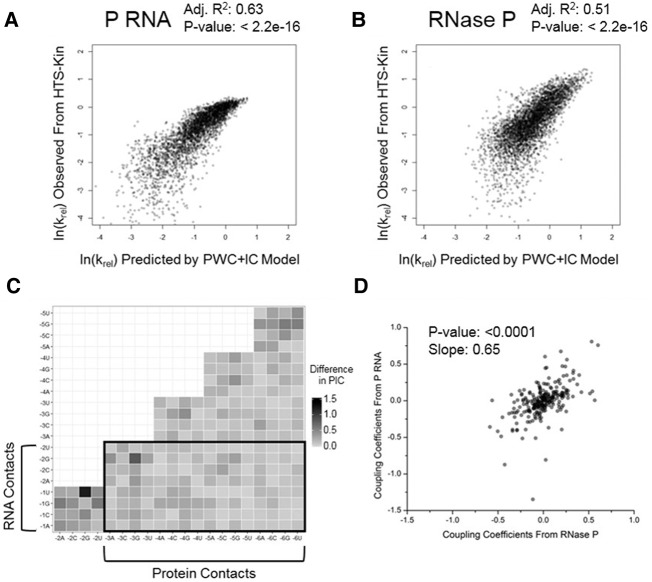
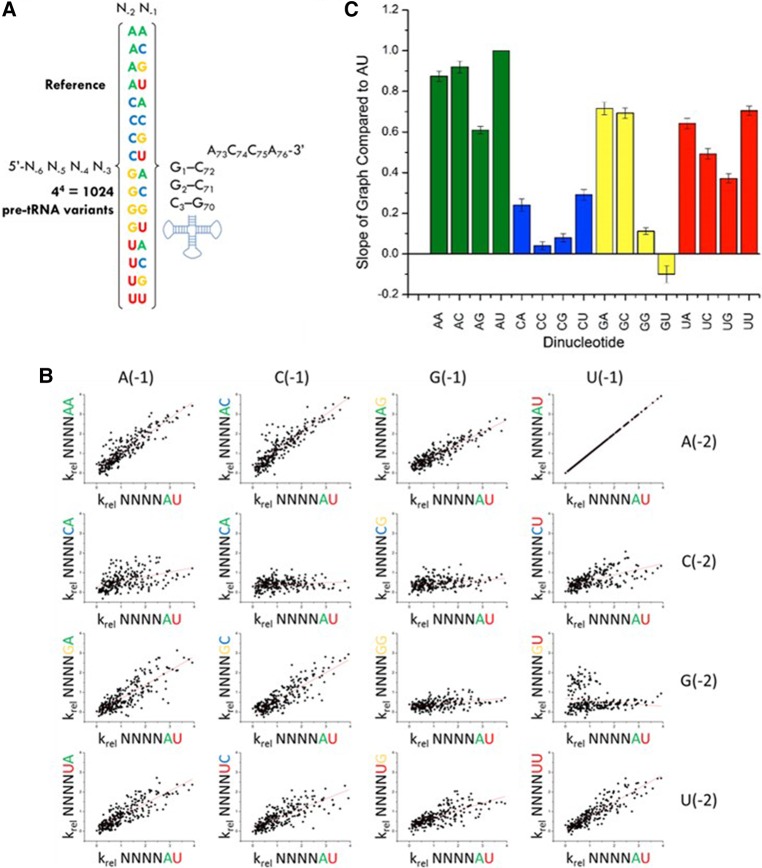
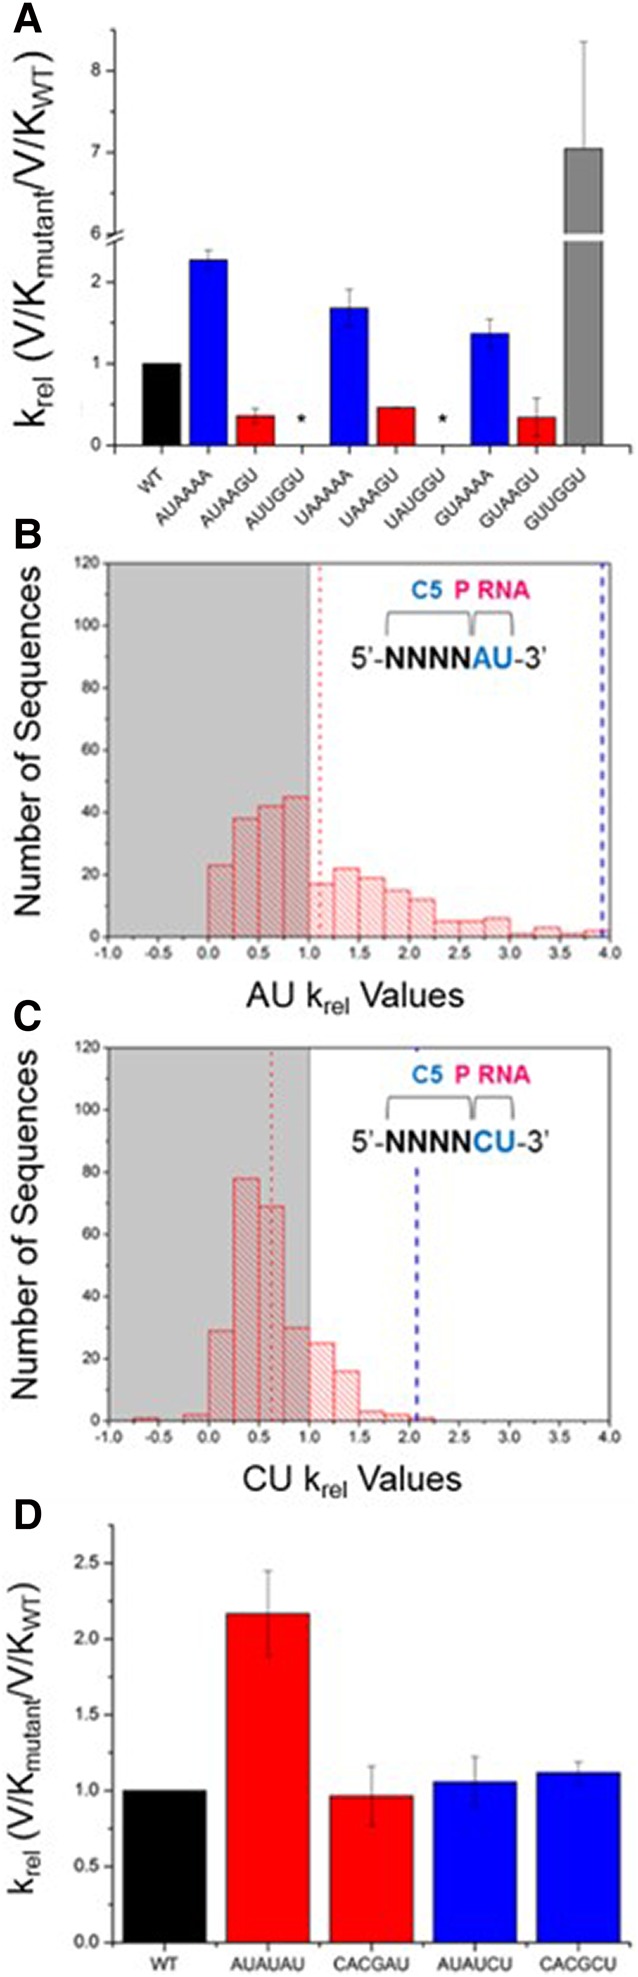
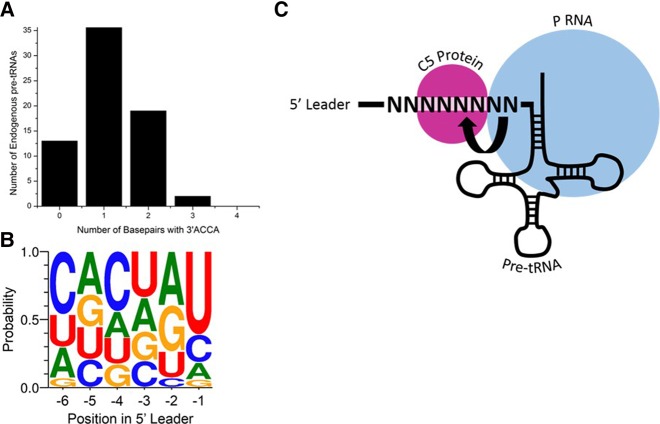
Recognition of RNA by RNA processing enzymes and RNA binding proteins often involves cooperation between multiple subunits. However, the interdependent contributions of RNA and protein subunits to molecular recognition by ribonucleoproteins are relatively unexplored. RNase P is an endonuclease that removes 5' leaders from precursor tRNAs and functions in bacteria as a dimer formed by a catalytic RNA subunit (P RNA) and a protein subunit (C5 in E. coli). The P RNA subunit contacts the tRNA body and proximal 5' leader sequences [N(-1) and N(-2)] while C5 binds distal 5' leader sequences [N(-3) to N(-6)]. To determine whether the contacts formed by P RNA and C5 contribute independently to specificity or exhibit cooperativity or anti-cooperativity, we compared the relative kcat/Km values for all possible combinations of the six proximal 5' leader nucleotides (n = 4096) for processing by the E. coli P RNA subunit alone and by the RNase P holoenzyme. We observed that while the P RNA subunit shows specificity for 5' leader nucleotides N(-2) and N(-1), the presence of the C5 protein reduces the contribution of P RNA to specificity, but changes specificity at N(-2) and N(-3). The results reveal that the contribution of C5 protein to RNase P processing is controlled by the identity of N(-2) in the pre-tRNA 5' leader. The data also clearly show that pairing of the 5' leader with the 3' ACCA of tRNA acts as an anti-determinant for RNase P cleavage. Comparative analysis of genomically encoded E. coli tRNAs reveals that both anti-determinants are subject to negative selection in vivo.

Keywords: RNase P; enzyme specificity; high-throughput sequencing; kinetics; molecular recognition; pre-tRNA processing.


Figures

FIGURE 1.
FIGURE 1.
Sequence determinants for holoenzyme and ribozyme reactions are unique and reveal changes in specificity. (A) Secondary structure of pre-tRNAMetN(−6 to −1) with regions of randomization analyzed in this study indicated by N's. As shown, these regions encompass nucleotides of the 5′ leader that are involved in P RNA and C5 protein contact. (B) The affinity distribution of relative rate constants from holoenzyme (black, published in Niland et al. 2016b) and ribozyme (red) with pre-tRNAMetN(−6 to −1) show that while some substrates are processed with rate constants significantly above the genomically encoded reference in holoenzyme reactions, the same substrate population is significantly slower in the ribozyme reaction with no protein subunit. (C) Comparison of the relative rate constants measured for each substrate variant in HTS-Kin reactions with RNase P holoenzyme (x-axis) and P RNA ribozyme (y-axis). (D) Sequence preference in the 5′ leader of pre-tRNAMetN(−6 to −1) examined by creating sequence probability logos of the fastest reacting substrates in holoenzyme or ribozyme reactions. The position in the 5′ leader is indicated on the bottom of the logo; nucleotide preference at each position is indicated by the identity and size of the letter of the nucleobase.
FIGURE 2.
FIGURE 2.
Plotting the IC values from the PWM+IC model identifies altered energetic coupling in holoenzyme and ribozyme reactions. (A,B) Comparison of the relative rate constants of pre-tRNAMetN(−6 to −1) observed in the ribozyme and holoenzyme HTS-Kin reaction compared to that predicted by the position weight matrix model including coupling coefficients (PWM+IC). Less than 10% of data omitted for clarity. RNase P modeling results published in Niland et al. (2016b). The greater apparent distribution of values for the P RNA reaction is likely due to its reduced specificity for N(−3) to N(−6). (C) Heatmap showing the difference in calculated IC values in the P RNA and RNase P reactions between nucleotides in the randomized region of the 5′ leader, N(−6) to N(−1). The identity and position of the nucleotide is indicated on each axis and the absolute value of the difference of the predicted IC values is indicated by the color at the vertex (black for large difference, white for small difference). (D) Comparison of the IC values calculated from the model between RNase P and P RNA HTS-Kin reactions.
FIGURE 3.
FIGURE 3.
Variation of nucleotides in the 5′ leader of pre-tRNA contacting the P RNA subunit of RNase P alters the energetic contribution of nucleotides contacting the C5 protein. (A) The 16 data subsets of HTS-Kin separated by the identity of nucleotides at N(−2) and N(−1) in the RNA binding site. (B) Each subset is compared to the genomically encoded A(−2)U(−1). Each row symbolizes a change in nucleotide identity at the N(−1) position while each column follows a change at N(−2). Each of the 16 boxes represents a scatter plot of the krel for a substrate with a given sequence at N(−6) to N(−3) in the background of the mutant or wild-type nucleotides at N(−2) and N(−1). (C) Each scatter plot was fit to a line with the slope indicated in the graph. Any arrangement of points other than a line with positive slope indicates different C5 sequence specificity depending on the identity of the nucleotides at N(−1)N(−2).
FIGURE 4.
FIGURE 4.
Coupling between nucleotides in the RNA and protein binding sites in the 5′ leader of pre-tRNA is a key component of RNase P specificity. (A) Results of individual substrate assays to test the effect of zero, two, or four base pairs between the 5′ leader and 3′ACCA on the krel. The 5′ leader of each substrate from N(−6) to N(−1) is indicated on the x-axis. Experiments were performed in triplicate and error bars indicate the standard deviation from all experiments. (*) indicates no cleavage was observed. (B) One population of substrates with U(−1) and A(−2) includes 256 sequences; the affinity distribution for these substrates is broad and shows that ptRNA variation in the C5 binding site alters RNase P processing rates. (C) For those substrates with U(−1) and C(−2), the affinity distribution is much more narrow, indicating little effect of protein binding site sequence variation on krel. (D) Single substrate multiple turnover assays measured the absolute kcat/Km for substrates with the indicated 5′ leaders on the x-axis. These reactions contained pre-tRNAMetWT as an internal reference. Experiments were performed in triplicate and error bars indicate the standard deviation from all experiments.
FIGURE 5.
FIGURE 5.
Significance of energetic coupling and base-pairing in vivo. (A) Bar graph of potential pairing between the 5′ leader and 3′RCCA of endogenous pre-tRNA from E. coli K12. Each pre-tRNA was examined for its containing a 5′-UGGU-3′ from N(−4 to −1) and the number calculated based upon sequential containment of this sequence (i.e., 5′-UGGA-3′ has no base pair and 5′-AAAU-3′ has one base pair). (B) Frequency plot of the sequence of 5′ leaders of pre-tRNA from E. coli K12. Each position in the 5′ leader is indicated on the x-axis; the size of the nucleotide letter indicates its portion in the endogenous pre-tRNA population. (C) A diagram for modulation of interdependence of proximal and distal leader sequence specificities. A possible interpretation of the results herein is that there is a change in the rate-limiting step of substrates with either an A(−2) or C(−2), possibly at the conformational change step.

Similar articles

Cited by

References

    1. Altman S, Guerrier-Takada C. 1986. M1 RNA, the RNA subunit of Escherichia coli ribonuclease P, can undergo a pH-sensitive conformational change. Biochemistry 25: 1205–1208. - PubMed
    1. Anderson VE. 2015. Multiple alternative substrate kinetics. Biochim Biophys Acta 1854: 1729–1736. - PubMed
    1. Ascano M, Hafner M, Cekan P, Gerstberger S, Tuschl T. 2012. Identification of RNA-protein interaction networks using PAR-CLIP. Wiley Interdiscip Rev RNA 3: 159–177. - PMC - PubMed
    1. Ascano M, Gerstberger S, Tuschl T. 2013. Multi-disciplinary methods to define RNA-protein interactions and regulatory networks. Curr Opin Genet Dev 23: 20–28. - PMC - PubMed
    1. Brännvall M, Mattsson JG, Svärd SG, Kirsebom LA. 1998. RNase P RNA structure and cleavage reflect the primary structure of tRNA genes. J Mol Biol 283: 771–783. - PubMed

Publication types

MeSH terms

LinkOut - more resources