. 2017 Jul 10;7(1):4977.
doi: 10.1038/s41598-017-05337-6.

Monocular deprivation induces dendritic spine elimination in the developing mouse visual cortex

Affiliations

Monocular deprivation induces dendritic spine elimination in the developing mouse visual cortex

Yanmei Zhou et al. Sci Rep. .

Abstract

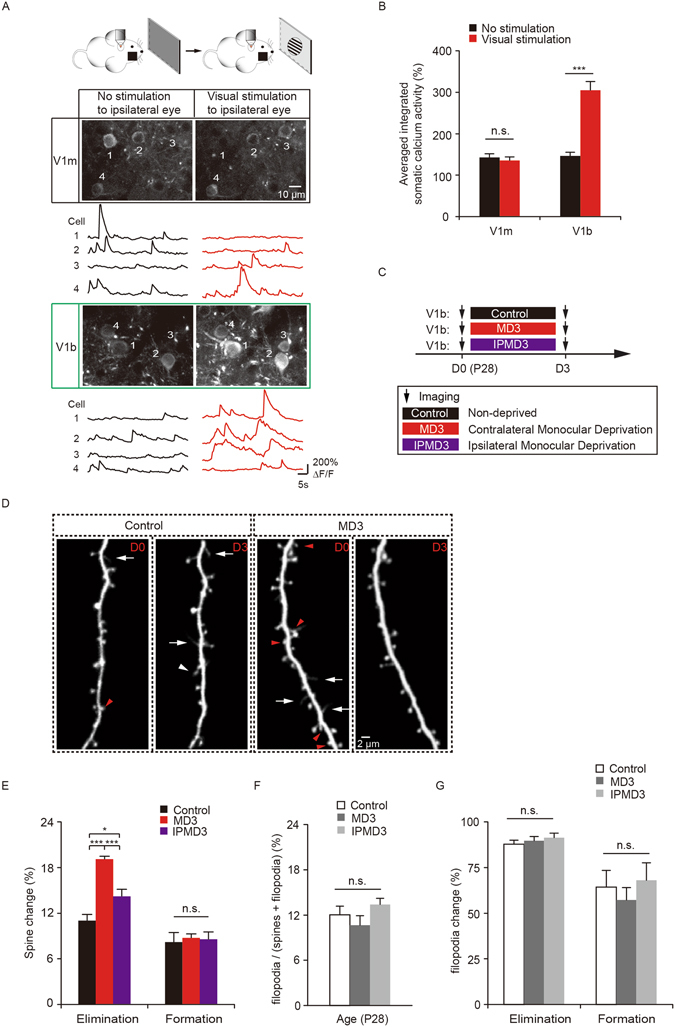
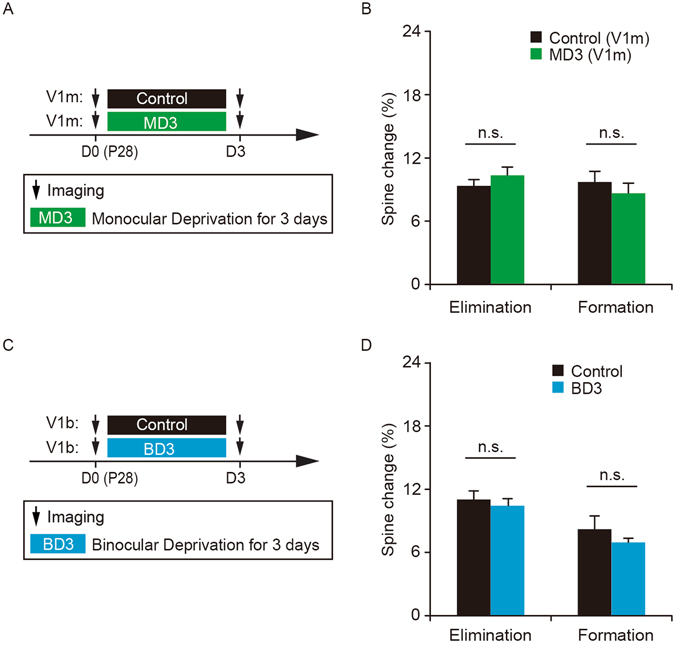
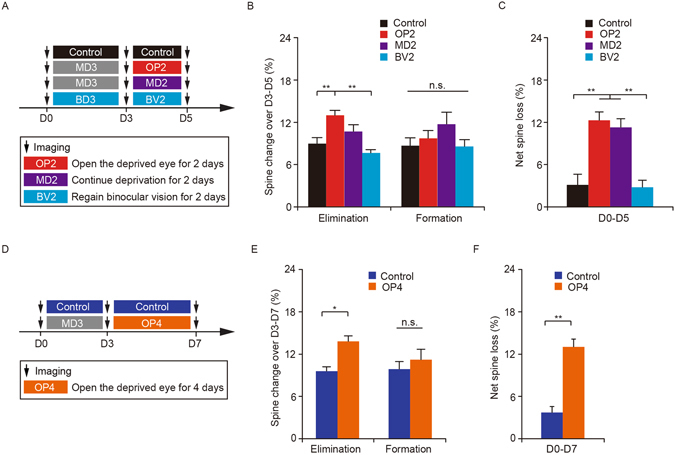
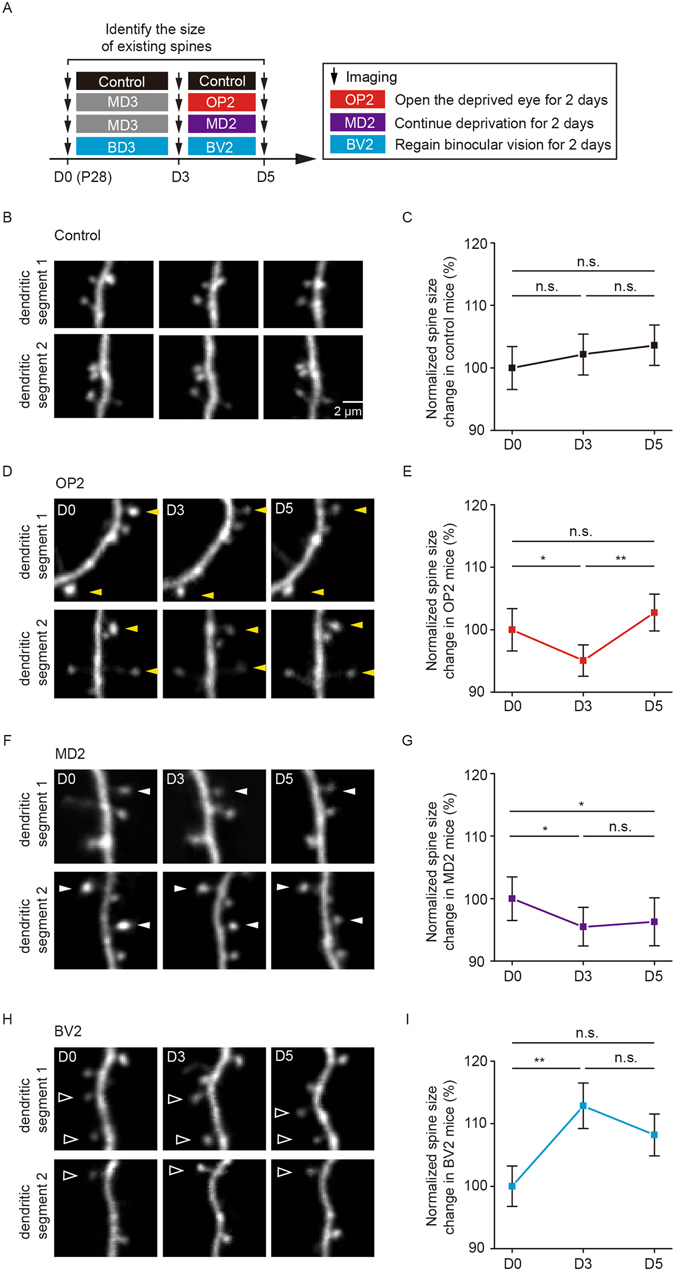
It is well established that visual deprivation has a profound impact on the responsiveness of neurons in the developing visual cortex. The effect of visual deprivation on synaptic connectivity remains unclear. Using transcranial two-photon microscopy, we examined the effect of visual deprivation and subsequent recovery on dendritic spine remodeling of layer 5 pyramidal neurons in the mouse primary visual cortex. We found that monocular deprivation (MD), but not binocular deprivation (BD), increased dendritic spine elimination over 3 days in the binocular region of 4-week-old adolescent mice. This MD-induced dendritic spine elimination persisted during subsequent 2-4 days of binocular recovery. Furthermore, we found that average dendritic spine sizes were decreased and increased following 3-day MD and BD, respectively. These spine size changes induced by MD or BD tended to be reversed during subsequent binocular recovery. Taken together, these findings reveal differential effects of MD and BD on synaptic connectivity of layer 5 pyramidal neurons and underscore the persistent impact of MD on synapse loss in the developing visual cortex.


Conflict of interest statement

The authors declare that they have no competing interests.

Figures

Figure 1
Figure 1
MD increases dendritic spine elimination in the binocular region during the critical period. (A) Two-photon calcium imaging of layer 2/3 pyramidal neurons in the monocular (V1m) and binocular (V1b) regions of the visual cortex in mice with the contralateral eye covered. Scale bar: 10 μm. Black traces represent activities without visual stimulation. Red traces represent activities when visual stimulus was presented to the ipsilateral eye. Calcium fluorescence traces of four neurons over 50 s are shown. (B) Somatic calcium activities in V1m were comparable between no stimulation and stimulation conditions (n = 4 mice, 205 cells). Somatic calcium activities in V1b were significantly increased when visual stimulus was presented to the ipsilateral eye (n = 3 mice, 179 cells). (C) Schematic of experimental paradigm. MD represents deprivation of the contralateral eye relative to the imaged hemisphere. IPMD represents deprivation of the ipsilateral eye. (D) Images of dendritic spines on apical tuft dendrites of layer 5 pyramidal neurons in control and MD mice over 3 days during the critical period. Red arrowheads indicate eliminated dendritic spines and white arrowhead indicates newly formed spines. White arrows indicate dendritic filopodia. Scale bar: 2 μm. (E) Percentage of dendritic spines eliminated and formed over 3 days in the binocular region. 3d of MD significantly increased spine elimination as compared to the non-deprived control and ipsilateral eye deprived mice, respectively (n = 1096 spines, 42 dendrites from 6 control mice, n = 4019 spines, 145 dendrites from 21 MD3 mice, n = 966 spines, 43 dendrites from 6 IPMD3 mice). In mice with the ipsilateral eye deprived for three days, significant spine elimination was observed as compared to the controls. No significant difference in spine formation among the three groups. (F) Percentage of filopodia over total dendritic protrusions (spines and filopodia) in the binocular region (n = 150 filopodia, 42 dendrites from 6 control mice; n = 384 filopodia, 106 dendrites from 16 MD3 mice; n = 149 filopodia, 42 dendrites from 6 IPMD3 mice). (G) Percentage of filopodia eliminated and formed over 3 days in the binocular region. Data are presented as mean ± SEM. *P < 0.05, ***P < 0.001, n.s. = not significant.
Figure 2
Figure 2
MD-induced spine elimination depends on the competitive interactions between the deprived and non-deprived eye. (A) Schematic of experimental design to examine the effect of MD in the monocular region of the primary visual cortex. (B) No significant difference in spine elimination or formation over 3 days between MD mice and non-deprived control mice (n = 713 spines, 30 dendrites from 4 MD mice, n = 653 spines, 30 dendrites from 4 control mice). (C) Schematic of experimental design to examine the effect of BD in the binocular region of the primary visual cortex. BD represents binocular deprivation. (D) No significant difference in spine elimination or formation over 3 days between BD and non-deprived control mice (n = 1023 spines, 47 dendrites from 6 BD mice, n = 1096 spines, 42 dendrites from 6 control mice). Data are presented as mean ± SEM. n.s. = not significant.
Figure 3
Figure 3
MD-induced spine elimination persists during subsequent binocular recovery. (A) Schematic of experimental paradigm. OP2 represents the condition in which the contralateral deprived eye was reopened for two days. MD2 represents continuous deprivation of the contralateral eye for two days and BV2 represents regaining binocular vision from BD for two days. (B) Percentage of dendritic spines eliminated and formed between days 3 and 5. The rate of spine elimination in OP2 mice (n = 1539 spines, 58 dendrites from 9 mice) was comparable to that in MD2 mice (n = 1349 spines, 58 dendrites from 8 mice), but significantly higher than that in non-deprived control mice (n = 1067 spines, 42 dendrites from 6 mice) and BV2 mice (n = 839 spines, 38 dendrites from 5 mice). No significant difference in the rate of spine formation was observed among the four groups. (C) Changes in spine number over five days under various conditions. The degree of net spine loss in OP2 mice (n = 9) was comparable to that in MD2 mice (n = 7), but significantly higher than that in non-deprived mice (n = 6) and BV2 mice (n = 5). (D) Schematic of experimental design. OP4 represents the condition in which the contralateral deprived eye was reopened for four days. (E) Percentage of dendritic spines eliminated and formed between days 3 and 7. The rate of spine elimination in OP4 mice (n = 871 spines, 34 dendrites from 5 mice) was significantly higher than that in non-deprived control mice (n = 964 spines, 58 dendrites from 6 mice). There was no significant difference in spine formation between OP4 and control mice. (F) The degree of net spine loss in OP4 mice (n = 5) was significantly higher than that in non-deprived mice (n = 6). Data are presented as mean ± SEM. *P < 0.05, **P < 0.01, n.s. = not significant.
Figure 4
Figure 4
MD or BD-induced spine size changes tend to be reversed after binocular recovery. (A) Schematic of experimental design to evaluate the effect of visual deprivation and subsequent recovery on the size of dendritic spines in the binocular region of the primary visual cortex. (B) Images of dendritic spine size changes from day 0 to 5 in non-deprived control mice. Scale bar: 2 μm. (C) Average spine size (measured by spine fluorescence relative to shaft fluorescence) exhibited no significant difference over 5 days in control mice (n = 116 spines from 6 mice). (D) Images of dendritic spine size changes from day 0 to 5 in OP2 mice. Yellow arrowheads indicate spines with size decrease after MD and size increase after subsequent binocular recovery. (E) Average spine size decreased during 3 days of MD and increased after 2 days of binocular recovery in OP2 mice (n = 145 spines from 5 mice). (F) Images of dendritic spine size changes from day 0 to 5 in MD2 mice. White arrowheads indicate spines with size decrease after MD and subsequent binocular recovery. (G) Average spine size showed no increase in mice with continued MD for additional 2 days (n = 125 spines from 5 mice). (H) Images of dendritic spine size changes from day 0 to 5 in BV2 mice. Open arrowheads indicate spines with size increase after BD over 3 days and decrease after subsequent binocular recovery. (I) Average spine size increased after 3 days of BD and showed a tendency to decrease after 2 days of binocular recovery in BV2 mice. Average spine size was not significantly different between day 0 and day 5 in BV2 mice. (n = 107 spines from 4 mice). Data are presented as mean ± SEM. *P < 0.05, **P < 0.01, n.s. = not significant.

References

    1. Hubel DH, Wiesel TN. Binocular interaction in striate cortex of Kittens reared with artificial squint. Journal of Neurophysiology. 1965;28:1041–59. - PubMed
    1. Crair MC, Gillespie DC, Stryker MP. The role of visual experience in the development of columns in cat visual cortex. Science. 1998;279:566–70. doi: 10.1126/science.279.5350.566. - DOI - PMC - PubMed
    1. Trachtenberg JT, et al. Long-term in vivo imaging of experience-dependent synaptic plasticity in adult cortex. Nature. 2002;420:788–794. doi: 10.1038/nature01273. - DOI - PubMed
    1. Wang BS, Sarnaik R, Cang JH. Critical period plasticity matches binocular orientation preference in the visual cortex. Neuron. 2010;65:246–256. doi: 10.1016/j.neuron.2010.01.002. - DOI - PMC - PubMed
    1. Hensch TK. Critical period plasticity in local cortical circuits. Nat Rev Neurosci. 2005;6:877–88. doi: 10.1038/nrn1787. - DOI - PubMed

Publication types

LinkOut - more resources