. 2017 Jun 26:8:733.
doi: 10.3389/fimmu.2017.00733. eCollection 2017.

Latent Cytomegalovirus (CMV) Infection Does Not Detrimentally Alter T Cell Responses in the Healthy Old, But Increased Latent CMV Carriage Is Related to Expanded CMV-Specific T Cells

Affiliations

Latent Cytomegalovirus (CMV) Infection Does Not Detrimentally Alter T Cell Responses in the Healthy Old, But Increased Latent CMV Carriage Is Related to Expanded CMV-Specific T Cells

Sarah E Jackson et al. Front Immunol. .

Abstract

Human cytomegalovirus (HCMV) primary infection and periodic reactivation of latent virus is generally well controlled by T-cell responses in healthy people. In older donors, overt HCMV disease is not generally seen despite the association of HCMV infection with increased risk of mortality. However, increases in HCMV DNA in urine of older people suggest that, although the immune response retains functionality, immunomodulation of the immune response due to lifelong viral carriage may alter its efficacy. Viral transcription is limited during latency to a handful of viral genes and there is both an IFNγ and cellular IL-10 CD4+ T-cell response to HCMV latency-associated proteins. Production of cIL-10 by HCMV-specific CD4+ T-cells is a candidate for aging-related immunomodulation. To address whether long-term carriage of HCMV changes the balance of cIL-10 and IFNγ-secreting T-cell populations, we recruited a large donor cohort aged 23-78 years and correlated T-cell responses to 11 HCMV proteins with age, HCMV IgG levels, latent HCMV load in CD14+ monocytes, and T-cell numbers in the blood. IFNγ responses by CD4+ and CD8+ T-cells to all HCMV proteins were detected, with no age-related increase in this cohort. IL-10-secreting CD4+ T cell responses were predominant to latency-associated proteins but did not increase with age. Quantification of HCMV genomes in CD14+ monocytes, a known site of latent HCMV carriage, did not reveal any increase in viral genome copies in older donors. Importantly, there was a significant positive correlation between the latent viral genome copy number and the breadth and magnitude of the IFNγ T-cell response to HCMV proteins. This study suggests in healthy aged donors that HCMV-specific changes in the T cell compartment were not affected by age and were effective, as viremia was a very rare event. Evidence from studies of unwell aged has shown HCMV to be an important comorbidity factor, surveillance of latent HCMV load and low-level viremia in blood and body fluids, alongside typical immunological measures and assessment of the antiviral capacity of the HCMV-specific immune cell function would be informative in determining if antiviral treatment of HCMV replication in the old maybe beneficial.

Keywords: IFNγ production; cIL-10+CD4+ T cells; human cytomegalovirus; human cytomegalovirus-specific T-cells; immunology of aging; latent viral load; viral latency.


Figures

Figure 1
Figure 1
Impact of aging on T cell numbers. EDTA treated whole blood was stained with a panel of phenotyping antibodies in order to enumerate CD4+ and CD8+ T cells and their subsets. Representative dot plots from a young and old donor showing CD4+ and CD8+ T cell gates, naïve T cells subset were defined by CD27+ and CD45RA+ (TNAIVE) expression, and CD4+ T regulatory cells (Treg—CD25hi, CD127lo); the number of cells per microliter of whole blood present for each gated population of interest are also indicated (A). Graphs illustrating the numbers of total CD8+ T cells (B), TNAIVE CD8+ T cells (C), total CD4+ T cells (D), TNAIVE CD4+ T cells (E), and CD4+ Treg cells (F) of the entire ARIA cohort (n = 119) correlated to donor age. The relationship of T cell subset numbers with donor age was analyzed using Spearman rank correlation with the results indicated on each graph [rs (95% confidence interval) and p value]. There was a significant decrease in total and TNAIVE CD4+ and CD8+ T cells with age, CD4+ Treg numbers showed no significant difference.
Figure 2
Figure 2
Impact of human cytomegalovirus (HCMV) carriage on T cell numbers. EDTA treated whole blood was stained with a panel of phenotyping antibodies in order to enumerate CD4+ and CD8+ T cells and their subsets. Representative dot plots from a HCMV seropositive (HCMV +ve) and HCMV seronegative (HCMV-ve) age-matched donors are illustrated showing the memory (as defined by CD27 and CD45RA expression) and differentiation level (as defined by CD27 and CD28) phenotype of both CD4+ and CD8+ T cells; the number of cells per microliter of whole blood for effector memory (TEM—CD27CD45RA) CD4+ and CD8+ T cells and Intermediate (INT—CD27CD28+) and Late (LATE—CD27CD28) differentiated CD8+ T cells are shown (A). Box and whisker plots comparing cell numbers of the memory (B,D) and differentiation phenotypes (C,E) of CD8+ T cells and CD4+ T cells, respectively, between HCMV +ve (red) and HCMV-ve (green) donors are shown. The differences between the two groups were analyzed by a Kruskal–Wallis one-way ANOVA test with post hoc Mann–Whitney U-test performed with significant results set as p ≤ 0.015 shown on each graph. A representative CD4 vs CD8 dot plot from the same donors with their respective CD4:CD8 ratio indicated are shown (F), the comparison of CD4:CD8 ratios for all seropositive vs seronegative donors are also shown (G) with the significant decrease in the CD4:CD8 ratio in HCMV positive donors indicated (Mann–Whitney test).
Figure 2
Figure 2
Impact of human cytomegalovirus (HCMV) carriage on T cell numbers. EDTA treated whole blood was stained with a panel of phenotyping antibodies in order to enumerate CD4+ and CD8+ T cells and their subsets. Representative dot plots from a HCMV seropositive (HCMV +ve) and HCMV seronegative (HCMV-ve) age-matched donors are illustrated showing the memory (as defined by CD27 and CD45RA expression) and differentiation level (as defined by CD27 and CD28) phenotype of both CD4+ and CD8+ T cells; the number of cells per microliter of whole blood for effector memory (TEM—CD27CD45RA) CD4+ and CD8+ T cells and Intermediate (INT—CD27CD28+) and Late (LATE—CD27CD28) differentiated CD8+ T cells are shown (A). Box and whisker plots comparing cell numbers of the memory (B,D) and differentiation phenotypes (C,E) of CD8+ T cells and CD4+ T cells, respectively, between HCMV +ve (red) and HCMV-ve (green) donors are shown. The differences between the two groups were analyzed by a Kruskal–Wallis one-way ANOVA test with post hoc Mann–Whitney U-test performed with significant results set as p ≤ 0.015 shown on each graph. A representative CD4 vs CD8 dot plot from the same donors with their respective CD4:CD8 ratio indicated are shown (F), the comparison of CD4:CD8 ratios for all seropositive vs seronegative donors are also shown (G) with the significant decrease in the CD4:CD8 ratio in HCMV positive donors indicated (Mann–Whitney test).
Figure 3
Figure 3
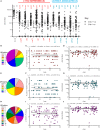
Magnitude and breadth of CD8+ T cell IFNγ response to human cytomegalovirus (HCMV) proteins. The IFNγ secreting CD8+ T cell response to 6 HCMV proteins only expressed during lytic infection: pp65, IE2, pp71, IE1, gB, US3, and 5 HCMV latency-associated proteins: UL144, US28, vIL-10, LUNA, and UL138 were measured in a cohort of 91 HCMV seropositive and 7 seronegative donors. The production of IFNγ was measured using an IFNγ FluoroSpot detection method; with the results converted to spot forming units/million cells (sfu/million) with background counts subtracted. The response to the lytic expressed proteins (red), latency associated (blue), and the positive control by all 98 donors are summarized (A) with HCMV seropositive donors (dark) and HCMV seronegative donors (light) both illustrated. The positive response threshold cutoff of 100 sfu/million is shown (dashed line) and the proportion of donors with a positive response to each HCMV protein is indicated. The proportion of the 91 seropositive donors producing a positive response to 1 or more of the 6 Lytic expressed proteins (B), 5 latency-associated proteins (E) or all 11 HCMV proteins (H) are summarized as pie charts with the key to segments for each graph shown. Graphs illustrating the breadth of HCMV seropositive donors response to HCMV proteins correlated with age are illustrated for lytic expressed (C), latency associated (F), and all 11 proteins (I); also shown is the summed IFNγ response to lytic (D), latent (G), and all proteins (J) correlated with age. Spearman rank correlation [Spearman rs (95% confidence intervals) and p values] results are indicated on each graph.
Figure 4
Figure 4
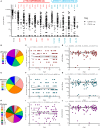
Magnitude and breadth of CD4+ T cell IFNγ response to human cytomegalovirus (HCMV) proteins. The IFNγ-secreting CD4+ T cell response to 6 HCMV proteins only expressed during lytic infection: pp65, IE2, pp71, IE1, gB, and US3 (red) and 5 HCMV latency-associated proteins: UL144, US28, vIL-10, LUNA, and UL138 (blue) were measured in a cohort of 91 HCMV seropositive and 8 seronegative donors. The production of IFNγ was measured using an IFNγ FluoroSpot method; with the results converted to spot forming units/million cells (sfu/million) with background counts then subtracted. The response to the HCMV proteins and the positive control by all 99 donors are summarized (A) with HCMV seropositive donors (dark) and HCMV seronegative donors (light) both illustrated. The positive response threshold cutoff of 100 sfu/million (dashed line) and the proportion of donors with an above threshold response to each HCMV protein is indicated. The proportion of the 91 seropositive donors producing a positive IFNγ response to 1 or more of the 6 Lytic expressed proteins (B), 5 latency-associated proteins (E) or all 11 HCMV proteins (H) are summarized as pie charts with the key to segment color for each graph shown. Graphs illustrating the breadth of HCMV seropositive donors IFNγ response to HCMV proteins correlated with age are illustrated for lytic expressed (C), latency associated (F), and all 11 proteins (I); also shown is the summed IFNγ response to lytic (D), latent (G), and all proteins (J) correlated with age. Spearman rank correlation [Spearman rs (95% confidence intervals) and p values] results are indicated on each graph.
Figure 5
Figure 5
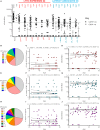
Magnitude and breadth of CD4+ T cell IL-10 response to human cytomegalovirus (HCMV) proteins. The IL-10-secreting CD4+ T cell response to 6 HCMV proteins only expressed during lytic infection: pp65, IE2, pp71, IE1, gB, and US3 (red) and 5 HCMV latency-associated proteins: UL144, US28, vIL-10, LUNA, and UL138 (blue) were measured in a cohort of 67 HCMV seropositive and 6 seronegative donors. The production of IL-10 was measured using an IL-10 FluoroSpot method; with the results converted to spot forming units/million cells (sfu/million) with background counts then subtracted. The response to the HCMV proteins and the positive control by all 73 donors are summarized (A) with HCMV seropositive donors (dark) and HCMV seronegative donors (light) both illustrated. The positive response threshold cutoff of 100 sfu/million (dashed line) and the proportion of donors responding to each HCMV protein is indicated. The proportion of the 67 seropositive donors producing a positive IL-10 response to 1 or more of the 6 lytic expressed proteins (B), 5 latency-associated proteins (E) or all 11 HCMV proteins (H) are summarized as pie charts with the key to segment color for each graph shown. Graphs illustrating the breadth of HCMV seropositive donors IL-10 response to HCMV proteins correlated with age are illustrated for lytic expressed (C), latency associated (F), and all 11 proteins (I); also shown is the summed IL-10 response to lytic (D), latent (G), and all proteins (J) correlated with age. Spearman rank correlation [Spearman rs (95% confidence intervals) and p values] results are indicated on each graph.
Figure 6
Figure 6
CD4+ T cell donor responses to human cytomegalovirus (HCMV) LUNA, UL138, pp71, US3, and US28 proteins were more frequently IL-10 biased. The frequency of CD4+ T cells that secrete IFNγ or IL-10 or both in response to stimulation by HCMV proteins was measured simultaneously using a dual IFNγ/IL-10 FluoroSpot assay. 67 HCMV seropositive donors were analyzed, only donors with above threshold responses for either IFNγ or IL-10 (100 sfu/million) to each protein are shown. The IFNγ (dark gray), IL-10 (white spotted), and dual cytokine (red) responses of the donor cohort to US28 (A), LUNA (B), UL138 (C), UL144 (D), vIL-10 (E), pp71 (F) US3 (G), pp65 (H), IE2 (I), gB (J), and IE1 (K) are shown as a percentage of the total CD4+ T cell (IFNγ+ IL-10) response of each donor, the donors are arranged along the x-axis in increasing age order. The lytic expressed proteins axis label is in red (F–K) and the latency-associated protein responses are labeled in blue (A–E).
Figure 7
Figure 7
There was no effect of donor age on the magnitude of latent human cytomegalovirus (HCMV) load in CD14+ monocytes. The DNA of purified CD14+ monocytes was extracted and HCMV viral load detected using droplet digital PCR analysis. No HCMV was detected in 14 HCMV seronegative donors tested. The HCMV viral load (copies/106 CD14+ cells) results from 94 HCMV seropositive donors are shown correlated with donor age. Spearman rank correlation [Spearman rs (95% confidence intervals) and p values] analysis is indicated on the graph.
Figure 8
Figure 8
High levels of latent human cytomegalovirus (HCMV) load in CD14+ monocytes correlates with increased frequency and breadth of HCMV-specific IFNγ CD8+ T cell responses. The HCMV viral load (copies/106 CD14+ cells) from 83 HCMV seropositive donors was correlated with CD8+ HCMV-specific T cell responses. Graphs illustrating the breadth (positive response) of individual donors CD8+ IFNγ response to the 6 lytic expressed (red) (A), 5 latency-associated (blue) (C), and all 11 HCMV proteins (purple) (E) correlated with CD14+ cells HCMV viral load are shown. The magnitude of the CD8+ IFNγ response summed for all protein groups is correlated with HCMV viral load for lytic (red) (B), latent (blue) (D), and all proteins (purple) (F). Spearman rank correlation [Spearman rs (95% confidence intervals) and p values] results are indicated on each graph.

Similar articles

Cited by

References

    1. McElhaney JE, Effros RB. Immunosenescence: what does it mean to health outcomes in older adults? Curr Opin Immunol (2009) 21(4):418–24.10.1016/j.coi.2009.05.023 - DOI - PMC - PubMed
    1. Denkinger MD, Leins H, Schirmbeck R, Florian MC, Geiger H. HSC aging and senescent immune remodeling. Trends Immunol (2015) 36(12):815–24.10.1016/j.it.2015.10.008 - DOI - PMC - PubMed
    1. Kline KA, Bowdish DM. Infection in an aging population. Curr Opin Microbiol (2016) 29:63–7.10.1016/j.mib.2015.11.003 - DOI - PubMed
    1. Sinclair J, Sissons P. Latency and reactivation of human cytomegalovirus. J Gen Virol (2006) 87(Pt 7):1763–79.10.1099/vir.0.81891-0 - DOI - PubMed
    1. Wills MR, Poole E, Lau B, Krishna B, Sinclair JH. The immunology of human cytomegalovirus latency: could latent infection be cleared by novel immunotherapeutic strategies? Cell Mol Immunol (2015) 12(2):128–38.10.1038/cmi.2014.75 - DOI - PMC - PubMed