. 2017 Jun 6;4(7):450-465.
doi: 10.1002/acn3.405. eCollection 2017 Jul.

Megalencephalic leukoencephalopathy with cysts: the Glialcam-null mouse model

Affiliations

Megalencephalic leukoencephalopathy with cysts: the Glialcam-null mouse model

Marianna Bugiani et al. Ann Clin Transl Neurol. .

Abstract

Objective: Megalencephalic leukoencephalopathy with cysts (MLC) is a genetic infantile-onset disease characterized by macrocephaly and white matter edema due to loss of MLC1 function. Recessive mutations in either MLC1 or GLIALCAM cause the disease. MLC1 is involved in astrocytic volume regulation; GlialCAM ensures the correct membrane localization of MLC1. Their exact role in brain ion-water homeostasis is only partly defined. We characterized Glialcam-null mice for further studies.

Methods: We investigated the consequences of loss of GlialCAM in Glialcam-null mice and compared GlialCAM developmental expression in mice and men.

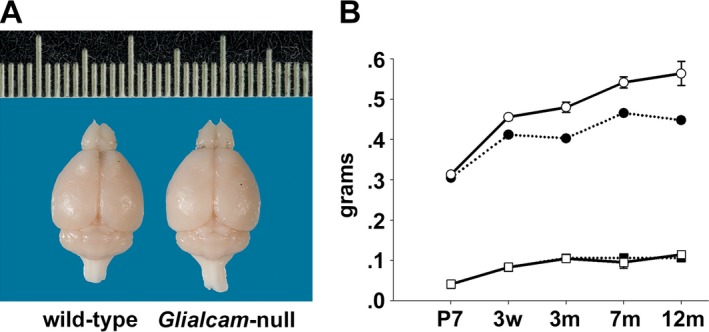
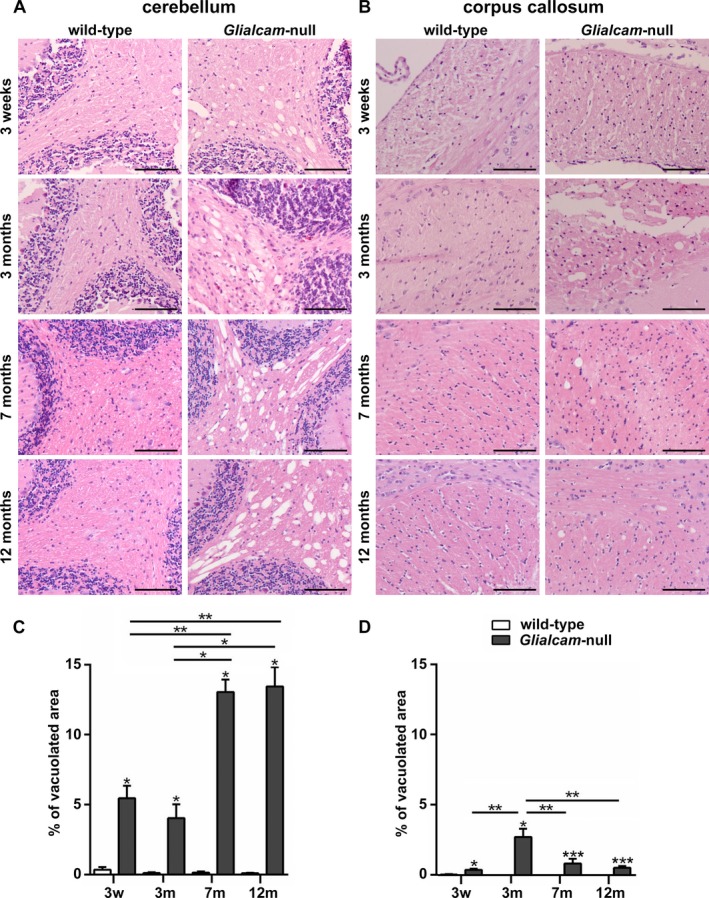
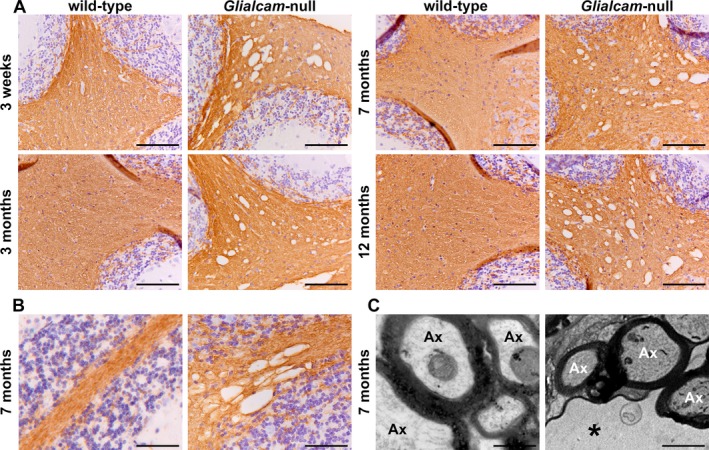
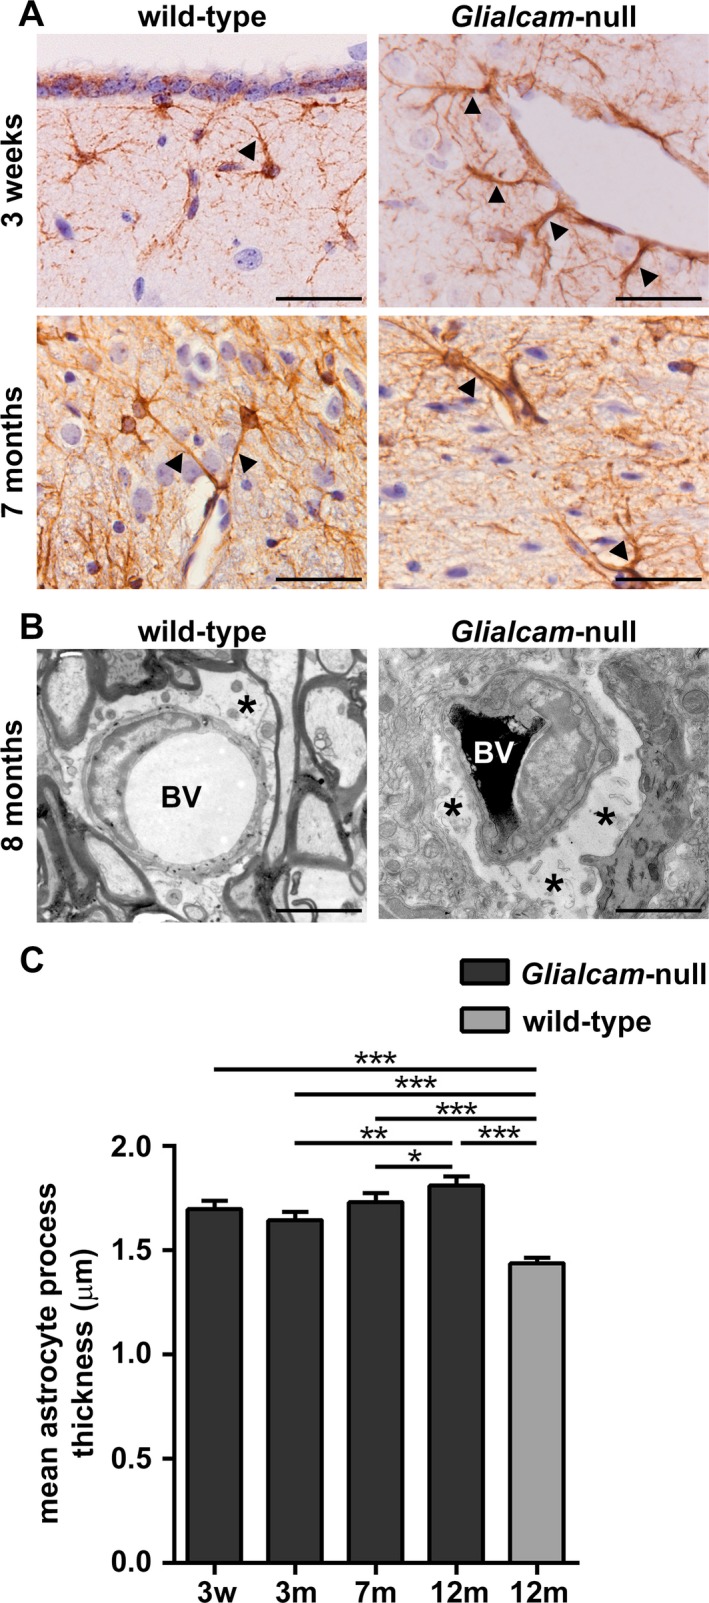
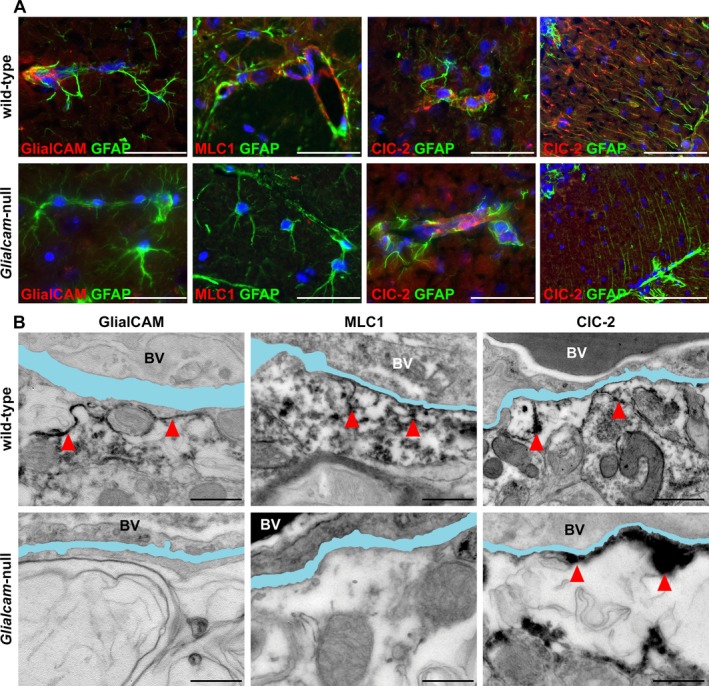
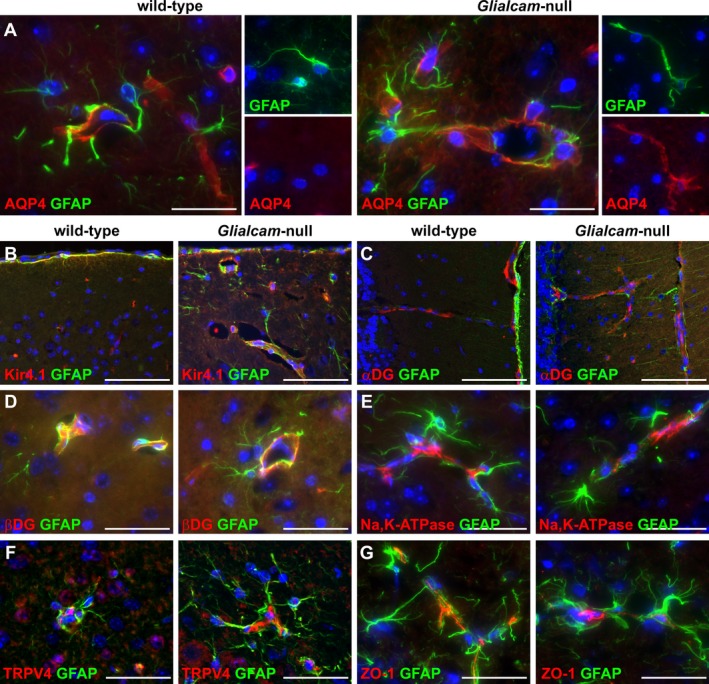
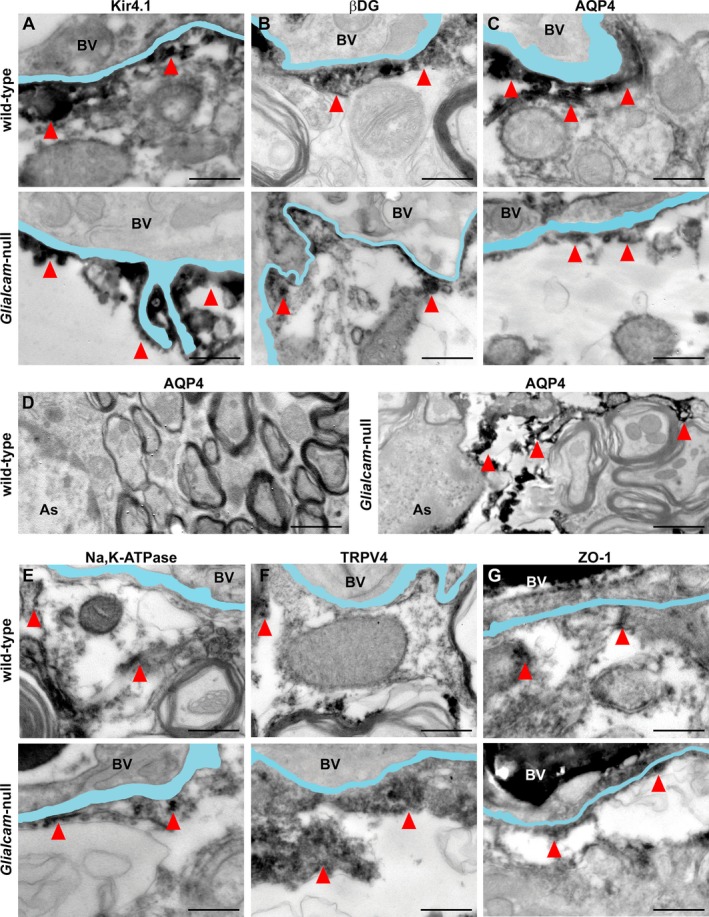
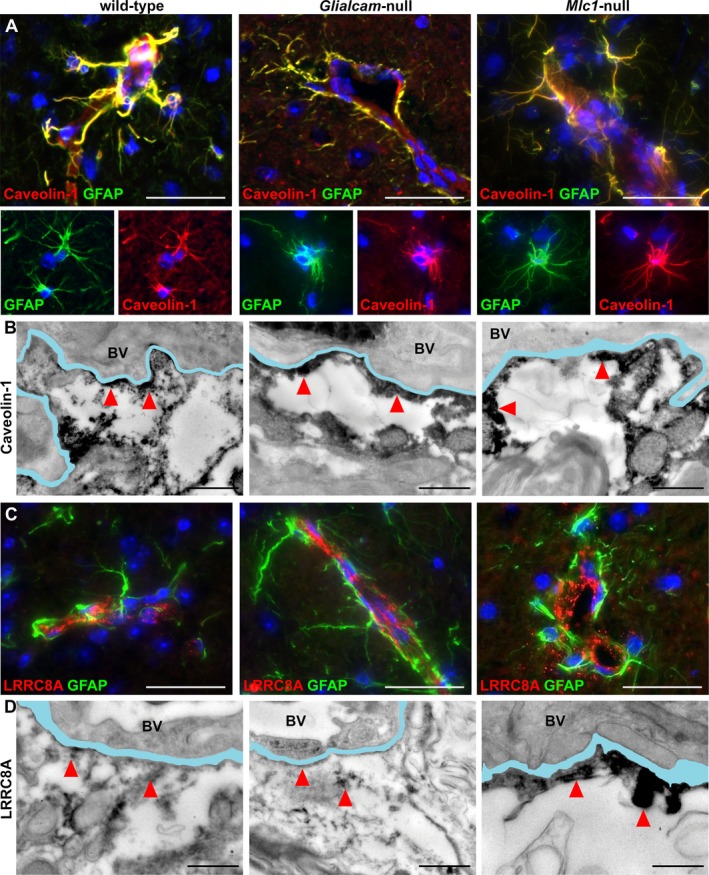
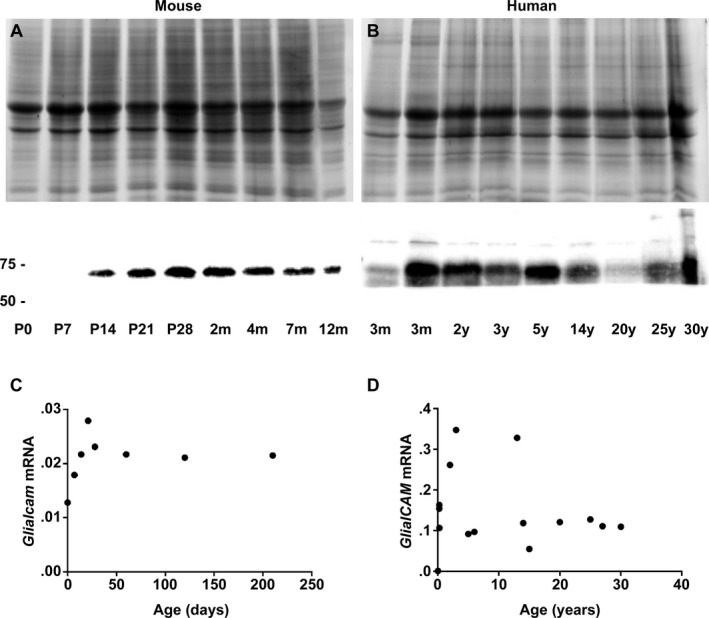
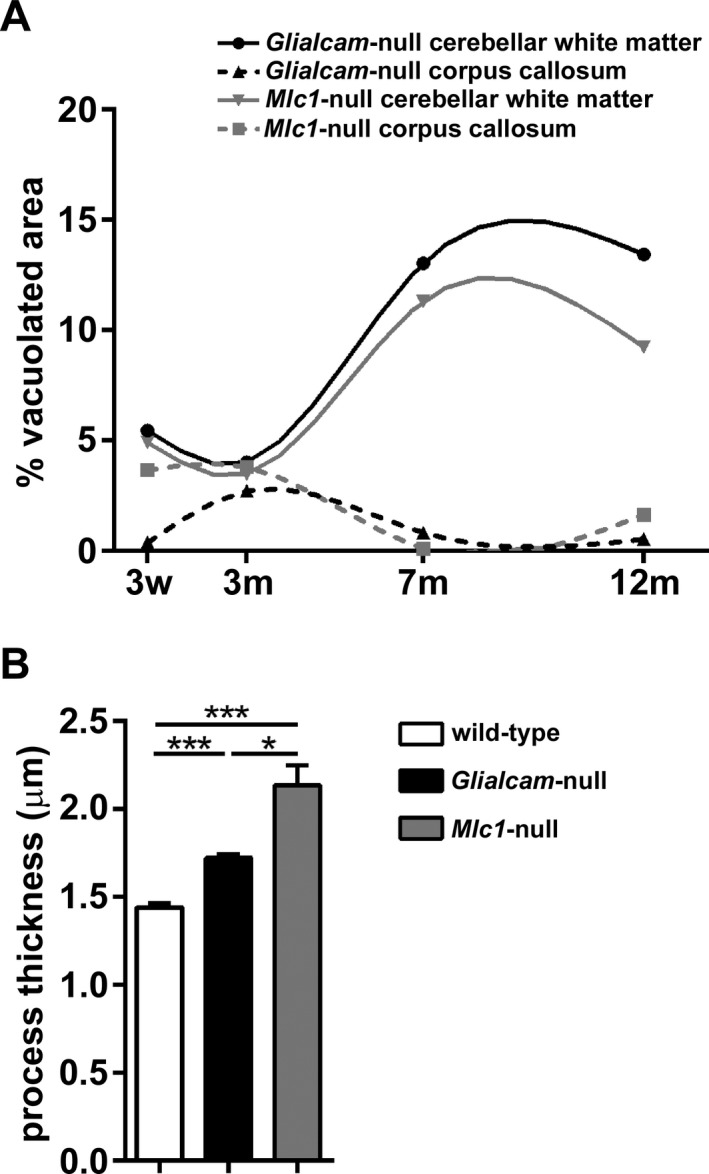
Results: Glialcam-null mice had early-onset megalencephaly and increased brain water content. From 3 weeks, astrocytes were abnormal with swollen processes abutting blood vessels. Concomitantly, progressive white matter vacuolization developed due to intramyelinic edema. Glialcam-null astrocytes showed abolished expression of MLC1, reduced expression of the chloride channel ClC-2 and increased expression and redistribution of the water channel aquaporin4. Expression of other MLC1-interacting proteins and the volume regulated anion channel LRRC8A was unchanged. In mice, GlialCAM expression increased until 3 weeks and then stabilized. In humans, GlialCAM expression was highest in the first 3 years to then decrease and stabilize from approximately 5 years.

Interpretation: Glialcam-null mice replicate the early stages of the human disease with early-onset intramyelinic edema. The earliest change is astrocytic swelling, further substantiating that a defect in astrocytic volume regulation is the primary cellular defect in MLC. GlialCAM expression affects expression of MLC1, ClC-2 and aquaporin4, indicating that abnormal interplay between these proteins is a disease mechanism in megalencephalic leukoencephalopathy with cysts.


Figures

Figure 1
Figure 1
Generation of the Glialcam‐null mice. (A) Molecular construct of the Glialcam‐null mouse. (B) Immunofluorescence staining for GlialCAM (red) and glial fibrillary acidic protein (GFAP) (green) of the cerebral cortex of 8‐month‐old mice shows that Glialcam‐null mice express no GlialCAM, whereas wild‐type animals express the protein normally. In all pictures, nuclei are stained with 4′ #bib6‐diamidino‐2‐phenylindole (DAPI) (blue). Bars = 50 μm.
Figure 2
Figure 2
Megalencephaly with increased brain water content in Glialcam‐null mice. (A) Glialcam‐null mice have larger brains than wild‐type littermates, as shown for these 8‐month‐old animals. (B) Measurements of brain wet and dry weight at postnatal day 7 (P7) #bib3 weeks (w), and at 3, 7, and 12 months (m; n = 3 per genotype per age) show significantly increased brain wet weight (circles) in Glialcam‐null mice (solid line) compared to controls (dotted line) from 3 weeks (P = 0.98 at P7, P = 0.05 at 3 weeks, P = 0.0004 at 3 months). This difference continues to grow (P = 0.0004 at 7 months, P < 0.0001 at 12 months). No differences are present in brain dry weight (squares) between Glialcam‐null and wild‐type mice. Error bars indicate the standard error of the mean.
Figure 3
Figure 3
White matter vacuolization in Glialcam‐null mice. (A, B) Hematoxylin & eosin (H&E) stain of 3‐week, and 3‐, 7‐ and 12‐month‐old animals shows vacuolization of the deep and subcortical cerebellar and to a lesser degree of the callosal white matter of Glialcam‐null mice. No vacuoles are seen in wild‐type animals. Bars: 100 μm. (C,D) Quantification confirms significantly more prominent white matter vacuolization in the cerebellum (C,) and corpus callosum (D) of Glialcam‐null than of control animals at all ages. *P < 0.05, **P < 0.01 and ***P < 0.0001. Graph bars represent the standard error of the mean.
Figure 4
Figure 4
Normal myelination and intramyelinic edema in the white matter of Glialcam‐null mice. (A) Stain for the myelin‐specific protein proteolipid protein (PLP) of the cerebellum shows no differences in PLP staining intensity between Glialcam‐null and wild‐type white matter at all ages analyzed, indicating that the mutant mice have no lack or loss of myelin. (B) Stain for PLP shows that the fine tissue strands crossing the vacuoles are PLP‐positive. (C) Ultrastructural analysis of the cerebellar white matter of 8‐month‐old Glialcam‐null mice shows large vacuoles surrounded by the outermost myelin lamellae of neighboring axons. The intramyelinic splitting occurs at the intraperiod line. Bars = 50 μm (A), 100 μm (B), 500 nm (C).
Figure 5
Figure 5
Glialcam‐null perivascular astrocytes are swollen and have thicker cell processes. (A) Glial fibrillary acidic protein (GFAP) stain shows abnormal perivascular astrocytes with thick processes abutting blood vessels (arrowheads) in the brains of Glialcam‐null mice from P21 onward as compared to wild‐type mice. (B) EM characterization of astrocytic morphology in the cerebellar white matter of 8‐month‐old Glialcam‐null mice shows that astrocytes have enlarged endfeet around the blood vessels compared to wild‐type animals. Asterisks indicate perivascular astrocytic endfeet. BV = blood vessel. Bars: 100 μm (A), 1 μm (B). (C) Glialcam‐null perivascular astrocytes have significantly thicker cell processes abutting the blood vessels than wild‐type cells. Perivascular astrocytic process thickness slightly increases between 3 and 7 and between 7 and 12 months in Glialcam‐null mice (n ≥ 100 processes per age, Mann–Whitney U test, *P < 0.05, **P < 0.001, ***P < 0.0001). Graph bars represent the standard error of the mean.
Figure 6
Figure 6
Expression of MLC1, GlialCAM and ClC‐2 in wild‐type and Glialcam‐null mice. (A) Double stain for GlialCAM (red) and glial fibrillary acidic protein (GFAP, green) shows completely absent GlialCAM perivascular expression in astrocytic endfeet abutting a capillary in the fimbria of Glialcam‐null mice. Double stain for MLC1 (red) and GFAP (green) shows no MLC1 expression in astrocytic endfeet abutting capillaries in the superior colliculus in Glialcam‐null mice. Double stain for ClC‐2 (red) and GFAP (green) shows reduced ClC‐2 expression in perivascular astrocytic endfeet in the corpus callosum and abolished ClC‐2 immunoreactivity in the Bergmann glia of the cerebellar cortex in Glialcam‐null mice. In all pictures, the nuclei are stained blue with DAPI. Bars = 100 μm. (B) GlialCAM immunoreactivity lines the perivascular basal lamina and astrocytic endfeet in wild‐type mice, but is completely absent in Glialcam‐null animals. MLC1 immunoreactivity abuts the vascular basal lamina and the astrocytic endfeet processes in wild‐type; no immunoreactivity is seen in Glialcam‐null mice. ClC‐2 immunoreactivity is found at the vascular basal lamina and astrocytic endfeet processes in wild‐type mice and also in Glialcam‐null mice. In all images, the basal lamina is colored in light blue; when duplicated, only the outermost is colored. Bars = 500 nm (B). BV = blood vessel.
Figure 7
Figure 7
Expression of the MLC1‐associated or ‐interacting proteins in Glialcam‐null mice as detected by fluorescence immunohistochemistry. (A) Double stain for aquaporin4 (AQP4, red) and glial fibrillary acidic protein (GFAP, green) shows AQP4 redistribution along the cell body and processes of Glialcam‐null astrocytes. (B) Double stain for Kir4.1 (red) and GFAP (green) shows no changes around blood vessels of Glialcam‐null compared to wild‐type mice. (C,D) Double stain for α‐dystroglycan (αDG) or β‐dystroglycan (βDG, red) and GFAP (green) shows no differences in the expression of both proteins in the molecular layer of the cerebellar cortex (C) and corpus callosum (D) between mutant and wild‐type mice. (E,F) Double stain for Na,K‐ATPase subunit β1 or TRPV4 (red) and GFAP (green) shows comparable expression in Glialcam‐null and wild‐type animals around large‐ and small‐caliber blood vessels in the superior colliculus (E) and cerebellar white matter (F). (G) Double stain for ZO‐1 (red) and GFAP (green) shows comparable endothelial cell ZO‐1 expression in capillaries in the corpus callosum of Glialcam‐null and wild‐type mice. In all pictures, the nuclei are stained blue with DAPI. Bars = 200 μm (A), 100 μm (B‐G).
Figure 8
Figure 8
Distribution of MLC1‐associated or ‐interacting proteins in Glialcam‐null mice as detected by immuno‐EM. (A) Kir4.1 immunoreactivity abuts the vascular basal lamina in wild‐type and Glialcam‐null mice. (B) β‐dystroglycan (βDG) immunoreactivity is visible along the basal lamina of wild‐type and Glialcam‐null mice. (C) Wild‐type and Glialcam‐null mice show AQP4 immunoreactivity along the vascular basal lamina. (D) AQP4 expression is redistributed along the astrocytic cell processes of Glialcam‐null animals. (E) Wild‐type and Glialcam‐null mice show Na,K‐ATPase immunoreactivity along the vascular basal lamina. (F) TRPV4 immunoreactivity abuts the vascular basal lamina in wild‐type and Glialcam‐null mice. (G) Wild‐type and Glialcam‐null mice show ZO‐1 immunoreactivity along the vascular basal lamina. In all images, the basal lamina is colored in light blue; when duplicated, only the outermost is colored. Bars = 500 nm (A–C, E–G), 1 μm (D). BV = blood vessel.
Figure 9
Figure 9
Expression and distribution of caveolin‐1 and the VRAC component LRRCA8 in wild‐type, Glialcam‐null and Mlc1‐null mice. (A) Double stain for caveolin‐1 (red) and glial fibrillary acidic protein (GFAP, green) shows no differences in caveolin‐1 expression in astrocytes and endfeet around vessels in the fimbria between wild‐type, Glialcam‐null and Mlc1‐null mice. (B) Wild‐type, Glialcam‐null and Mlc1‐null mice show caveolin‐1 immunoreactivity along the vascular basal lamina by immuno‐EM. (C) Double stain for LRRC8A (red) and GFAP (green) shows similar LRRC8A expression around blood vessels in the dorsal brainstem of Glialcam‐null, Mlc1‐null and wild‐type animals. (D) By immuno‐EM, LRRC8A immunoreactivity is visible along the basal lamina of wild‐type, Glialcam‐null and Mlc1‐null mice. In all fluorescence immunohistochemistry pictures, the nuclei are stained blue with DAPI. Bars = 100 μm (A,C). In all immuno‐EM images, the basal lamina is colored in light blue; when duplicated, only the outermost is colored. Bars = 500 nm (B,D). BV = blood vessel.
Figure 10
Figure 10
GlialCAM expression in the mouse and human brain throughout life. (A,C) Western blotting (A) and qPCR (C) in P0 to 12‐month‐old wild‐type mice show that GlialCAM protein (lower panel, approximately 60 kDa) and GlialCAM mRNA levels show the most pronounced increase up to P21 and then little further change. (B) Western blotting of frontal white matter lysates of normal human subjects shows that GlialCAM protein levels (lower panel, approximately 60 kDa) are highest during the first 5 years of life, decrease and stabilize thereafter. In‐gel trichloroethanol (TCE, A and B, upper panels) confirms equal protein load. (D) Real‐time qPCR analysis shows that relative GlialCAM mRNA levels are also highest in early infancy and then decrease to stabilize at around 5 years of life. Notably, the 13‐year‐old subject with highest GlialCAM mRNA levels had multiple injuries and succumbed after an unknown agonal time; no neuropathology was reported by the provider (National Institute of Child Health and Human Development Brain and Tissue Bank for Developmental Disorders at the University of Maryland, Baltimore, Maryland), but we cannot exclude presence of trauma‐related brain edema and compensatory GlialCAM overexpression.
Figure 11
Figure 11
Comparing white matter vacuolization and astrocyte process thickness in Gliacam‐null and Mlc1‐null mice. (A) Compared to Mlc1‐null mice, Glialcam‐null animals have significantly more prominent vacuoles in the cerebellar white matter, but less vacuoles in the corpus callosum (N = 4 per genotype per age). (B) Astrocyte process thickness is increased in both MLC mutant mice, but is slightly higher in Mlc1‐null18 than in Glialcam‐null animals (N > 250 per genotype). *P < 0.05, ***P < 0.0001. Bars represent the standard error of the mean.

References

    1. van der Knaap MS, Valk J, Barth PG, et al. Leukoencephalopathy with swelling in children and adolescents: MRI patterns and differential diagnosis. Neuroradiology 1995;37:679–686. - PubMed
    1. Singhal BS, Gursahani RD, Udani VP, Biniwale AA. Megalencephalic leukodystrophy in an Asian Indian ethnic group. Pediatr Neurol 1996;14:291–296. - PubMed
    1. van der Voorn JP, Pouwels PJ, Hart AA, et al. Childhood white matter disorders: quantitative MR imaging and spectroscopy. Radiology 2006;241:510–517. - PubMed
    1. Kocaman G, Eryigit G, Abbink TE, et al. An unusually mild presentation of megalencephalic leukoencephalopathy with subcortical cysts. Clin Neurol Neurosurg 2013;115:1564–1566. - PubMed
    1. van der Knaap MS, Barth PG, Vrensen GF, Valk J. Histopathology of an infantile‐onset spongiform leukoencephalopathy with a discrepantly mild clinical course. Acta Neuropathol 1996;92:206–212. - PubMed

LinkOut - more resources