. 2017 Aug 3;13(8):1386-1403.
doi: 10.1080/15548627.2017.1332565. Epub 2017 Jul 11.

ADIPOQ/adiponectin induces cytotoxic autophagy in breast cancer cells through STK11/LKB1-mediated activation of the AMPK-ULK1 axis

Affiliations

ADIPOQ/adiponectin induces cytotoxic autophagy in breast cancer cells through STK11/LKB1-mediated activation of the AMPK-ULK1 axis

Seung J Chung et al. Autophagy. .

Abstract

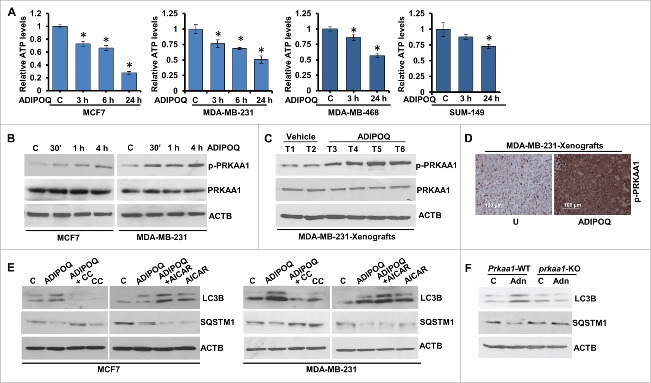
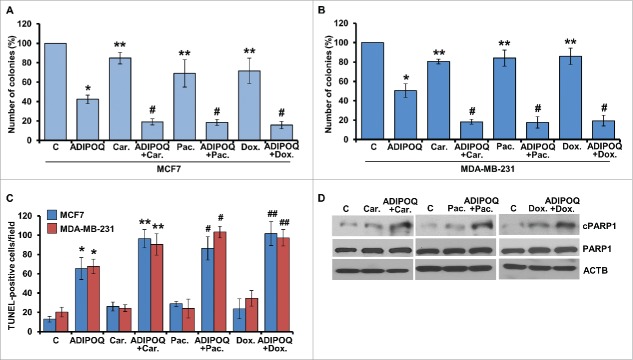
ADIPOQ/adiponectin, an adipocytokine secreted by adipocytes in the breast tumor microenvironment, negatively regulates cancer cell growth hence increased levels of ADIPOQ/adiponectin are associated with decreased breast cancer growth. However, its mechanisms of action remain largely elusive. We report that ADIPOQ/adiponectin induces a robust accumulation of autophagosomes, increases MAP1LC3B-II/LC3B-II and decreases SQSTM1/p62 in breast cancer cells. ADIPOQ/adiponectin-treated cells and xenografts exhibit increased expression of autophagy-related proteins. LysoTracker Red-staining and tandem-mCherry-GFP-LC3B assay show that fusion of autophagosomes and lysosomes is augmented upon ADIPOQ/adiponectin treatment. ADIPOQ/adiponectin significantly inhibits breast cancer growth and induces apoptosis both in vitro and in vivo, and these events are preceded by macroautophagy/autophagy, which is integral for ADIPOQ/adiponectin-mediated cell death. Accordingly, blunting autophagosome formation, blocking autophagosome-lysosome fusion or genetic-knockout of BECN1/Beclin1 and ATG7 effectively impedes ADIPOQ/adiponectin induced growth-inhibition and apoptosis-induction. Mechanistic studies show that ADIPOQ/adiponectin reduces intracellular ATP levels and increases PRKAA1 phosphorylation leading to ULK1 activation. AMPK-inhibition abrogates ADIPOQ/adiponectin-induced ULK1-activation, LC3B-turnover and SQSTM1/p62-degradation while AMPK-activation potentiates ADIPOQ/adiponectin's effects. Further, ADIPOQ/adiponectin-mediated AMPK-activation and autophagy-induction are regulated by upstream master-kinase STK11/LKB1, which is a key node in antitumor function of ADIPOQ/adiponectin as STK11/LKB1-knockout abrogates ADIPOQ/adiponectin-mediated inhibition of breast tumorigenesis and molecular analyses of tumors corroborate in vitro mechanistic findings. ADIPOQ/adiponectin increases the efficacy of chemotherapeutic agents. Notably, high expression of ADIPOQ receptor ADIPOR2, ADIPOQ/adiponectin and BECN1 significantly correlates with increased overall survival in chemotherapy-treated breast cancer patients. Collectively, these data uncover that ADIPOQ/adiponectin induces autophagic cell death in breast cancer and provide in vitro and in vivo evidence for the integral role of STK11/LKB1-AMPK-ULK1 axis in ADIPOQ/adiponectin-mediated cytotoxic autophagy.

Keywords: AMPK; STK11/LKB1; ULK1; adiponectin; autophagy; breast cancer.


Figures

Figure 1.
Figure 1.
ADIPOQ/adiponectin inhibits breast cancer growth and induces autophagosome accumulation. (A) Breast cancer cells were treated with 5 µg/ml ADIPOQ/adiponectin and subjected to soft-agar colony-formation assay for 3 wk. Histogram represents average number of colonies counted (in 6 microfields). *, P < 0.001, compared with untreated controls. Vehicle-treated cells, denoted with the letter “C.” (B) Clonogenicity of breast cancer cells treated with 5 µg/ml ADIPOQ/adiponectin as indicated. (C) MDA-MB-231 cell-derived xenografts were developed in nude mice and treated with control-adenoviral (Ad-Luc) and ADIPOQ/adiponectin-adenoviral (Ad-ADIPOQ) (108 pfu). Tumor growth was monitored by measuring the tumor volume for 6 wk. (n = 8 mice per group). Ad-ADIPOQ/adiponectin treatment reduced tumor size as compared with Ad-Luc, *P < 0.001. (D) Tumors from vehicle (V) and ADIPOQ/adiponectin-treated mice were subjected to immunohistochemical analysis using MKI67 antibodies. Scale bar: 100 µm. Bar diagrams show quantification of immunohistochemical analysis. *P < 0.001, compared with control. (E) TUNEL-positive cells in tumor sections were counted. Each bar represents the mean apoptotic cell rate (n = 6–8). *, P < 0.01, compared with untreated controls. (F) MCF7 cells were treated with 5 µg/ml ADIPOQ/adiponectin as indicated and visualized under an electron microscope. Scale bar: 2 µm. Top pictures are shown with approximately 7,400x magnifications. Double-membrane autophagosomes were counted in randomly selected ∼100 cells. The number of autophagosomes was counted from randomly selected fields. Cells with >2 autophagosomes were counted. (G) MCF7 and MDA-MB-231 cells were treated with 5 µg/ml ADIPOQ/adiponectin and subjected to immunocytochemistry using LC3B antibody. Scale bar: 20 µm. Representative immunofluorescence images are shown.
Figure 2.
Figure 2.
ADIPOQ/adiponectin induces autophagy in breast cancer cells. (A) Breast cancer cells were treated with 5 µg/ml ADIPOQ/adiponectin, and total cell lysates were immunoblotted for LC3B and SQSTM1/p62 expression. ACTB was used as a loading control. Bar diagram shows quantification of western blot signals from multiple independent experiments. (B) Immunoblot analysis of BECN1, ATG5, ATG7 and ATG12 in breast cancer cells treated with 5 µg/ml ADIPOQ/adiponectin as indicated. ACTB was used as a loading control. (C) Total protein lysates from tumors from control-adenoviral (Ad-Luc) and ADIPOQ/adiponectin -adenoviral (Ad-ADIPOQ)-treated mice were examined for the expression of BECN1, ATG7, LC3B and SQSTM1/p62. ACTB was used as a loading control. (D) Tumors from vehicle (V) and ADIPOQ/adiponectin-treated mice were subjected to immunohistochemical (IHC) analysis using BECN1, ATG5, SQSTM1/p62 and LC3B antibodies. Scale bar: 100 µm. Bar diagrams show quantification of IHC analysis. *P < 0.01, compared with control. (E,F) Breast cancer cells were transfected with an LC3B-encoding plasmid, treated with 5 µg/ml ADIPOQ/adiponectin and stained with LysoTracker Red. Scale bar: 20 µm. Representative immunofluorescence images are shown.
Figure 3.
Figure 3.
Inhibition of autophagy inhibits ADIPOQ/adiponectin-mediated reduction in cell-survival and apoptosis-induction in breast cancer cells. (A) MCF7 and MDA-MB-231 cells were treated with 5 µg/ml ADIPOQ/adiponectin alone or in combination with 200 nM Baf and 2 mM 3-MA as indicated and subjected to XTT assay. *P < 0.001, compared with control; #P < 0.005, compared with ADIPOQ/adiponectin-treated cells. (B) Breast cancer cells were treated as in (A) and subjected to DNA fragmentation assay. *P < 0.01, compared with control; #P < 0.01, compared with ADIPOQ/adiponectin -treated cells. (C) MCF7 and MDA-MB-231 cells were treated with 5 µg/ml ADIPOQ/adiponectin and 2 mM 3-MA and total cell lysates were immunoblotted for cleaved PARP1 (cPARP1), PARP1 and ACTB as indicated. (D) BECN1 and ATG7 were knocked out in MCF7 cells using CRISPR/Cas9 and total cell lysates were immunoblotted for BECN1 and ATG7. ACTB was used as loading control. (E) Control, BECN1-KO and ATG7-KO MCF7 cells were treated with 5 µg/ml ADIPOQ/adiponectin and total cell lysates were immunoblotted for cleaved-PARP1 and total-PARP1 expression levels. (F) Clonogenicity of control, BECN1-KO and ATG7-KO MCF7 cells treated with 5 µg/ml ADIPOQ/adiponectin as indicated.
Figure 4.
Figure 4.
ADIPOQ/adiponectin induces energy depletion and AMPK-activation in breast cancer cells and inhibition of AMPK hinders ADIPOQ/adiponectin-mediated modulation of autophagy markers. (A) Intracellular ATP production was measured in MCF7, MDA-MB-231, MDA-MB-468 and SUM149 cells treated with ADIPOQ/adiponectin (5 µg/ml) for the indicated times. Relative ATP levels are expressed as fold change with respect to control. *P < 0.01, compared with control. (B) Total cell lysates from MCF7 and MDA-MB-231 cells treated with 5 µg/ml ADIPOQ/adiponectin for the indicated times were immunoblotted for phospho-PRKAA1 (p-PRKAA1), and total PRKAA1. ACTB was used as a loading control. (C) Total protein lysates from tumors from control-adenoviral (Ad-Luc) and ADIPOQ/adiponectin-adenoviral (Ad-ADIPOQ)-treated mice were examined for the expression of p-PRKAA1 and PRKAA1. ACTB was used as a loading control. (D) Tumors from vehicle (V) and ADIPOQ/adiponectin-treated mice were subjected to immunohistochemical analysis using p-PRKAA1 antibodies. Scale bar: 100 µm. (E) MCF7 and MDA-MB-231 cells were treated with ADIPOQ/adiponectin (5 µg/ml), compound C (CC) and AICAR alone and in combination as indicated, and total cell lysates were immunoblotted for LC3B and SQSTM1/p62 expression. ACTB was used as a loading control. (F) Prkaa1 wild-type (Prkaa1-WT) and prkaa1 knockout (prkaa1-KO) MEFs were treated with 5 µg/ml ADIPOQ/adiponectin and total cell lysates were immunoblotted for LC3B and SQSTM1/p62 expression. ACTB was used as a loading control.
Figure 5.
Figure 5.
ADIPOQ/adiponectin increases ULK1 expression via AMPK in breast cancer cells. (A) MCF7 and MDA-MB-231 cells were treated with 5 µg/ml ADIPOQ/adiponectin for various time intervals as indicated and total cell lysates were immunoblotted for ULK1 and phospho-ULK1 (p-ULK1) expression. ACTB is used as a loading control. (B) Total protein lysates from tumors from control-adenoviral (Ad-Luc) (denoted as C) and ADIPOQ/adiponectin-adenoviral (Ad-ADIPOQ)-treated mice were examined for the expression of ULK1 and p-ULK1. ACTB was used as a loading control. (C) Tumors from vehicle (V) and ADIPOQ/adiponectin-treated mice were subjected to immunohistochemical analysis using ULK1 and p-ULK1 antibodies. Scale bar: 100 µm. (D, E) MCF7 and MDA-MB-231 cells were treated with ADIPOQ/adiponectin (5 µg/ml), compound C and AICAR alone and in combination as indicated, and total cell lysates were immunoblotted for ULK1 and p-ULK1 expression. ACTB was used as a loading control. (F) Prkaa1 wild-type (Prkaa1-WT) and prkaa1 knockout (prkaa1-KO) MEFs were treated with 5 µg/ml ADIPOQ/adiponectin and total cell lysates were immunoblotted for ULK1 and p-ULK1 expression. ACTB was used as control.
Figure 6.
Figure 6.
STK11/LKB1 plays an important role in ADIPOQ/adiponectin-mediated cytotoxic-autophagy and inhibition of tumor growth. (A) Total protein lysates of MCF7 and MDA-MB-231 cells infected with STK11/LKB1 shRNA (STK11/LKB1sh) and vector-pLKO.1 control (vector) were immunoblotted for the expression of STK11/LKB1. MCF7 cells containing STK11/LKB1 shRNA and MCF7 cells containing vector were treated with 5 µg/ml ADIPOQ/adiponectin and total protein lysates were examined for p-PRKAA1 and PRKAA1 expression in an immunoblot assay. (B) MCF7 cells containing STK11/LKB1 shRNA, MCF7 cells containing vector, MDA-MB-231 cells containing STK11/LKB1 shRNA, and MDA-MB-231 cells containing vector were treated with 5 µg/ml ADIPOQ/adiponectin and total protein lysates were examined for LC3B and BECN1 expression in an immunoblot assay. (C) MCF7 cells with STK11/LKB1 shRNA, MCF7 cells with vector, MDA-MB-231 cells with STK11/LKB1 shRNA, and MDA-MB-231 cells with vector were treated with 5 µg/ml ADIPOQ/adiponectin and subjected to a clonogenicity assay. (D) Tumors derived from MDA-MB-231 cells with STK11/LKB1 shRNA and MDA-MB-231 cells with vector-pLKO.1 control (vector) were developed in nude mice and treated with control-adenoviral-Ad-Luc (C) and ADIPOQ/adiponectin-adenoviral (Ad-ADIPOQ) (108 pfu). Tumor growth was monitored by measuring the tumor volume for 5 weeks (n = 8–10); (P < 0.001), vector + ADIPOQ/adiponectin compared with STK11/LKB1 shRNA+ ADIPOQ/adiponectin. (E-G) Tumors from vehicle (V) and ADIPOQ/adiponectin-treated mice were subjected to immunohistochemical analysis using MKI67, ATG5 and BECN1 antibodies. Scale bar: 100 µm. Bar diagrams show quantification of IHC-analysis. *P < 0.01, compared with control.
Figure 7.
Figure 7.
ADIPOQ/adiponectin sensitizes breast cancer cells to a variety of chemotherapy drugs. (A, B) MCF7 and MDA-MB-231 cells were treated with 5 µg/ml ADIPOQ/adiponectin, carboplatin (Car.), paclitaxel (Pac.) or doxorubicin (Dox.) either alone or in combination and subjected to clonogenicity. *P < 0.01, compared with control; **P < 0.001, compared with control; #P < 0.05, compared with cells treated with carboplatin, paclitaxel and doxorubicin alone. (C) MCF7 and MDA-MB-231 cells were treated as in (A) and subjected to TUNEL assay. *P < 0.05, compared with control; **P < 0.01, compared with carboplatin alone; #P < 0.01, compared with paclitaxel alone; ##P < 0.01, compared with doxorubicin alone. (D) MCF7 cells were treated with 5 µg/ml ADIPOQ/adiponectin, carboplatin (Car.), paclitaxel (Pac.) and or doxorubicin (Dox.) either alone or in combination and total cell lysates were subjected to immunoblot analysis using cleaved-PARP1, total-PARP1 antibodies. ACTB was included as a loading control.
Figure 8.
Figure 8.
Higher expression of ADIPOQ/adiponectin-receptor and BECN1 correlates with increased overall survival. (A, B) Chemotherapy-treated patients (n = 416 in the Metabric cohort and n = 791 in the Affymetrix cohort) were included in a survival analysis. In the Metabric data set, higher expression of ADIPOR2 (adiponectin receptor 2) and BECN1 correlated with better survival (HR = 0.68, 95% CI = 0.51–0.90, P = 0.0076 and HR = 0.68, 95% CI = 0.50–0.91, P = 0.0087, respectively). (C) ADIPOQ/adiponectin levels were correlated with survival in the Affymetrix cohort but the results were not statistically significant (HR = 0.83, 95% CI = 0.62–1.11, P = 0.22). (D) Schematic representation of ADIPOQ/adiponectin-mediated activation of cytotoxic autophagy via the STK11/LKB1 axis. ADIPOQ/adiponectin treatment increases expression and cytoplasmic localization of STK11/LKB1 and reduces negative phosphorylation of STK11/LKB1 via reduction of phospho-MAPK1/ERK2. ADIPOQ-induced STK11/LKB1 leads to AMPK-activation, which in turn increases ULK1 expression and phosphorylation leading to cytotoxic autophagy and tumor growth inhibition.

References

    1. Vona-Davis L, Howard-McNatt M, Rose DP. Adiposity, type 2 diabetes and the metabolic syndrome in breast cancer. Obes Rev 2007; 8:395-408; PMID:17716297; https://doi.org/10.1111/j.1467-789X.2007.00396.x - DOI - PubMed
    1. Sharma D, Davidson NE. Obesity and breast cancer: a multipartite connection. J Mammary Gland Biol Neoplasia 2013; 18:253-5; PMID:24190309; https://doi.org/10.1007/s10911-013-9306-4 - DOI - PMC - PubMed
    1. Iyengar NM, Zhou XK, Gucalp A, Morris PG, Howe LR, Giri DD, Morrow M, Wang H, Pollak M, Jones LW, et al.. Systemic Correlates of White Adipose Tissue Inflammation in Early-Stage Breast Cancer. Clinical cancer research: an official journal of the American Association for Cancer Research 2016; 22:2283-89; PMID:26712688; https://doi.org/10.1158/1078-0432.CCR-15-2239 - DOI - PMC - PubMed
    1. Lee Y, Jung WH, Koo JS. Adipocytes can induce epithelial-mesenchymal transition in breast cancer cells. Breast cancer research and treatment 2015; 153:323-35; PMID:26285644; https://doi.org/10.1007/s10549-015-3550-9 - DOI - PubMed
    1. Santander AM, Lopez-Ocejo O, Casas O, Agostini T, Sanchez L, Lamas-Basulto E, Carrio R, Cleary MP, Gonzalez-Perez RR, Torroella-Kouri M. Paracrine Interactions between Adipocytes and Tumor Cells Recruit and Modify Macrophages to the Mammary Tumor Microenvironment: The Role of Obesity and Inflammation in Breast Adipose Tissue. Cancers 2015; 7:143-78; PMID:25599228; https://doi.org/10.3390/cancers7010143 - DOI - PMC - PubMed

MeSH terms