. 2017 Sep;70(3):543-551.
doi: 10.1161/HYPERTENSIONAHA.117.09208. Epub 2017 Jul 10.

Increased Perfusion Pressure Drives Renal T-Cell Infiltration in the Dahl Salt-Sensitive Rat

Affiliations

Increased Perfusion Pressure Drives Renal T-Cell Infiltration in the Dahl Salt-Sensitive Rat

Louise C Evans et al. Hypertension. 2017 Sep.

Abstract

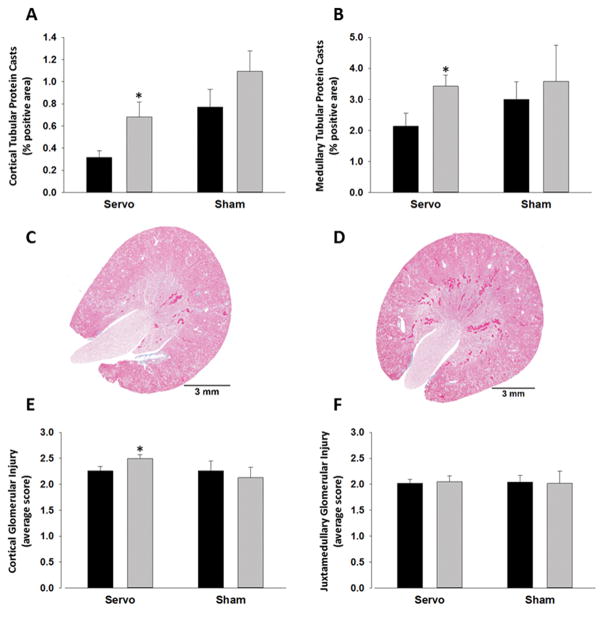
Renal T-cell infiltration is a key component of salt-sensitive hypertension in Dahl salt-sensitive (SS) rats. Here, we use an electronic servo-control technique to determine the contribution of renal perfusion pressure to T-cell infiltration in the SS rat kidney. An aortic balloon occluder placed around the aorta between the renal arteries was used to maintain perfusion pressure to the left kidney at control levels, ≈128 mm Hg, during 7 days of salt-induced hypertension, whereas the right kidney was exposed to increased renal perfusion pressure that averaged 157±4 mm Hg by day 7 of high-salt diet. The number of infiltrating T cells was compared between the 2 kidneys. Renal T-cell infiltration was significantly blunted in the left servo-controlled kidney compared with the right uncontrolled kidney. The number of CD3+, CD3+CD4+, and CD3+CD8+ T cells were all significantly lower in the left servo-controlled kidney. This effect was not specific to T cells because CD45R+ (B cells) and CD11b/c+ (monocytes and macrophages) cell infiltrations were all exacerbated in the hypertensive kidneys. Increased renal perfusion pressure was also associated with augmented renal injury, with increased protein casts and glomerular damage in the hypertensive kidney. Levels of norepinephrine were comparable between the 2 kidneys, suggestive of equivalent sympathetic innervation. Renal infiltration of T cells was not reversed by the return of renal perfusion pressure to control levels after 7 days of salt-sensitive hypertension. We conclude that increased pressure contributes to the initiation of renal T-cell infiltration during the progression of salt-sensitive hypertension in SS rats.

Keywords: blood pressure; diet; immune system; lymphocytes; rats.


Conflict of interest statement

Conflicts of Interest/Disclosures

None

Figures

Figure 1
Figure 1
Renal perfusion pressure (RPP) in servo-controlled (A) (n=12) and sham (B) (n=17) rats during 3-days 0.4% NaCl and 7-days 4.0% NaCl intake. The carotid arterial pressure (grey) represents pressure to the right kidney, whereas the femoral arterial pressure (black) represents pressure to the left kidney. Data are presented as Means ± SEM for 24hr averages of the day of study. Renal immune cell infiltration in servo-controlled (C) (n=12) and sham (D) (n=17) rats after 7-days of 4.0% NaCl intake. Left kidney (black bars) and right (grey bars) are shown. CD3+ (mature T-cells), CD3+CD4+ (helper T-cells), CD3+CD8+ (cytotoxic T-cells), CD45R+ (B-Cells), CD11b/c+ (monocytes and macrophages). Data are presented as Means ± SEM and expressed as total cells per kidney. #=significantly different from the average blood pressure measurement during the control period, #=p<0.05, ###=p<0.001. *=significantly different from the left kidney in the same group on the same study day, *=p<0.05, **=p<0.005, ***=p<0.001.
Figure 2
Figure 2
Renal injury in servo-controlled and sham rats. Left kidneys (black bars) are compared to the corresponding right kidneys (grey bars). Tubular protein casts in the cortex (A) and medulla (B) was quantified as the % of the total area which were casts. Example images of left (C) and right (D) kidneys from servo-controlled rats are shown. Glomerular injury was quantified in the cortex (E) and juxtamedullary region (F) by scoring glomeruli on a scale of 0–4. 4 represents the most severe damage. Data are presented as Means ± SEM. *=p<0.05 compared to the left kidney within the same group.
Figure 3
Figure 3
qPCR assessment of genes involved in renal fibrosis in the cortex (A) and medulla (B) of right-hypertensive (grey) and left servo-controlled (black) kidneys (n=8). *=significantly different from the left kidney on the same day of study, *p<0.05, **p<0.01, ***p<0.001. CD3+ staining in the cortex (C) and medulla (D) is represented by the brown staining.
Figure 4
Figure 4
Renal perfusion pressure (RPP) (A) and lymphocyte infiltration (B) in servo-controlled reversal study. The carotid artery pressure (grey) represents pressure to the right kidney (n=6, two catheters did not work), whereas the femoral artery pressure (black) represents pressure to the left, servo-controlled reversal kidney (n=8). Data are presented as Means ± SEM for 24hr averages of the day of study (A). Left reversal kidneys (black) and right hypertensive kidneys (grey) (B). #=significantly different from the average blood pressure measurement during the 3-days of the control period, ##=p<0.005, ###=p<0.001. *=significantly different from the left kidney on the same day of study, *p<0.05, ***p<0.001.

References

    1. Hughson MD, Gobe GC, Hoy WE, Manning RD, Douglas-Denton R, Bertram JF. Associations of glomerular number and birth weight with clinicopathological features of African Americans and whites. American Journal of Kidney Diseases. 2008;52:18–28. - PubMed
    1. Mattson DL. Infiltrating immune cells in the kidney in salt-sensitive hypertension and renal injury. Am J Physiol Renal Physiol. 2014;307:F499–F508. - PMC - PubMed
    1. McMaster WG, Kirabo A, Madhur MS, Harrison DG. Inflammation, immunity, and hypertensive end-organ damage. Circ Res. 2015;116:1022–1033. - PMC - PubMed
    1. Ozawa Y, Kobori H, Suzaki Y, Navar LG. Sustained renal interstitial macrophage infiltration following chronic angiotensin II infusions. Am J Physiol Renal Physiol. 2007;292:F330–339. - PMC - PubMed
    1. Marvar PJ, Thabet SR, Guzik TJ, Lob HE, McCann LA, Weyand C, Gordon FJ, Harrison DG. Central and peripheral mechanisms of T-lymphocyte activation and vascular inflammation produced by angiotensin II-induced hypertension. Circ Res. 2010;107:263–270. - PMC - PubMed

Publication types

Substances