. 2017 Jul 25;114(30):E6097-E6106.
doi: 10.1073/pnas.1705065114. Epub 2017 Jul 10.

Continuous immunotypes describe human immune variation and predict diverse responses

Affiliations

Continuous immunotypes describe human immune variation and predict diverse responses

Kevin J Kaczorowski et al. Proc Natl Acad Sci U S A. .

Abstract

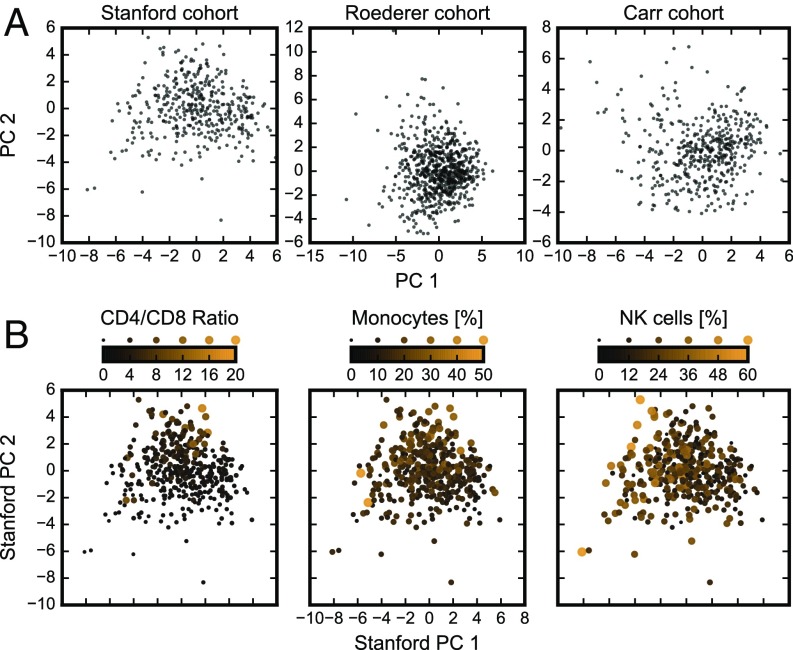
The immune system consists of many specialized cell populations that communicate with each other to achieve systemic immune responses. Our analyses of various measured immune cell population frequencies in healthy humans and their responses to diverse stimuli show that human immune variation is continuous in nature, rather than characterized by discrete groups of similar individuals. We show that the same three key combinations of immune cell population frequencies can define an individual's immunotype and predict a diverse set of functional responses to cytokine stimulation. We find that, even though interindividual variations in specific cell population frequencies can be large, unrelated individuals of younger age have more homogeneous immunotypes than older individuals. Across age groups, cytomegalovirus seropositive individuals displayed immunotypes characteristic of older individuals. The conceptual framework for defining immunotypes suggested by our results could guide the development of better therapies that appropriately modulate collective immunotypes, rather than individual immune components.

Keywords: aging; human immune variation; immune cell composition; systems immunology.


Conflict of interest statement

The authors declare no conflict of interest.

Figures

Fig. 1.
Fig. 1.
Immune cell composition varies continuously across the healthy human population. (A) Projection of immune cell compositions of the Stanford, Roederer, and Carr cohorts onto the top two of their respective PCs (Fig. S1). (B) Overlay of individuals from the Stanford cohorts with extreme values of individual immune cell populations (or two, in the case of CD4/CD8 ratio) on the top two PCs of immune cell composition data. Solid circles scale linearly in both area and color (Fig. S2).
Fig. S1.
Fig. S1.
Additional clustering analysis for the Stanford, Roederer, and Carr cohorts reveals no clustering, related to Fig. 1A. (A) Cumulative explained variance of PCs from PCA. Datasets dominated by top PCs often show a kink (or “shoulder”) in the graph, indicating that most of the variability can be explained by only a few PCs. This feature is notably absent from our analyses. (B and C) Clustering using the k-means algorithm was performed on the immune cell compositions, using up to the top 10 PCs (line colors range from black to orange, indicating 1, 2, 3, 4, 5, and 10 PCs used in clustering; analysis using 6–9 PCs showed a similar trend, but these lines were removed for visual clarity) and specifying up to 10 clusters (x axis). The quality of clustering was evaluated using one of two metrics: (B) average silhouette coefficient or (C) between-cluster explained variance. Both metrics are compared with a suitable null distribution (Materials and Methods, Clustering Methods), in dashed, semitransparent lines. Larger values indicate a greater degree of clustering for either metric. Thus, because neither metric is significantly larger than the corresponding null distribution, we conclude that these datasets do not cluster any more readily than randomly generated datasets. (D) Dimensionality reduction using two-component t-SNE also reveals no visual clustering.
Fig. S2.
Fig. S2.
Individuals considered outliers in individual immune cell populations are not outliers using a collective description via PCs, related to Fig. 1B. Shown are distributions of PC scores across the Stanford cohort population (PCs 1–4 in A–D, respectively). For each of CD4/CD8 ratio, monocytes, and NK cells, outlier individuals (defined as being in the top (red) or bottom (blue) 5% of the respective individual population distribution) are indicated by open circles on the x axis. Because these outlier individuals are distributed throughout the ranges of PCs 1–4, we find that outliers in individual populations do not necessarily constitute outliers in the collective description of immune cell composition.
Fig. 2.
Fig. 2.
A few key combinations of immune cell frequencies predict functional responses: regression model analysis. (A and B) Learning curves for PLS and PCR models, which plot model error as a function of number of variables (LVs or PCs for PLS and PCR, respectively) included in the model. The curves are either normalized (A) or raw (B), calculated across all responses [median ± interquartile range (IQR)]. Raw error is defined as 10-fold cross-validated negative Spearman correlation between measured and predicted responses to estimate out-of-sample error. Normalized error is defined as the remaining fraction of total possible reduction in raw error (eemin0.0emin). (C–E) Raw latent variable signatures (gray) with mean ± SD (orange) across all responses, for the top three LVs (C, D, and E, respectively) (Fig. S3).
Fig. S3.
Fig. S3.
Distribution of similarity metric (the dot product between the LVs of two responses) across all response pairs, related to Fig. 2. The similarities of the top three LVs across responses are quantified using distributions of absolute dot product between two LVs (SI Materials and Methods, Latent Variable Similarities). For example, Top Left distribution compares LV1 with LV1 across all response pairs; the labeled arrow indicates that 70% of response pairs have similarities with P < 0.05, corresponding to a dot product greater than 0.335 (SI Materials and Methods, Latent Variable Similarities).
Fig. S4.
Fig. S4.
Analysis of LV1 heterogeneity across functional responses, related to Fig. 3. (A) Learning curves for Brisbane strain vaccination HAI response, when individuals exhibiting no fold increase in HAI titers (“nonresponders”) are either included or removed. (B) Similarity matrix of response pairs (measured by absolute value of the dot product between LV1 for two functional responses), sorted into two clusters by spectral clustering (SI Materials and Methods, Spectral Clustering). The larger cluster in the lower left is referred to as “group 1,” whereas the smaller cluster in the upper right is referred to as “group 2” (Dataset S5). (C) Distribution of log-modulus–transformed response values across signaling responses in groups 1 and 2.
Fig. 3.
Fig. 3.
Predictive signatures for diverse signaling responses are uniform across responses but distinct from that for vaccination by a single strain of influenza. Signatures show the top LV from group 1 responses (see text), averaged over responding cell type (top 10 rows), contrasted with that for the single flu-vaccination response (antibodies to influenza B/Brisbane/60/2008 strain; bottom row). Each solid circle represents the contribution of a particular immune cell population in the top LV that is predictive of functional response. Circle area is proportional to magnitude of the average LV1 signature coefficient, with positive or negative sign indicated by orange or purple, respectively (Fig. S4 and Dataset S5).
Fig. 4.
Fig. 4.
Heterogeneity in immunotypes increases with age. This is defined by the top three LVs, averaged over group 1 responses (Dataset S5). (A) Individuals plotted in the immunospace defined by the first three PLS LVs. Individuals are colored in gradient from youngest (black) to oldest (orange) by rank order. The dashed red line indicates an “immunological age axis,” the direction of gradient in age (found by logistic regression of age on the top three LVs). The plots contain grayscale “shadows” projected onto the LV1–LV2 plane to aid 3D visualization, as well as a transparent cone to highlight shape of point cloud. (B) Probability distributions of interpatient Euclidean distances defined on top three LVs for different age groups (youngest 10%, 20%, and 60% corresponding to ages <15.6 y, 20 y, and 44 y, respectively, and the oldest 10% corresponding to ages >75 y). Twin pairs are excluded from all three distributions. (C) Regression coefficients (normalized to unit vector) of immune cell populations that define the immunological age axis of A, where populations are ordered by size of coefficient.
Fig. 5.
Fig. 5.
Twin pairs have similar immunotypes. Shown are interindividual distances (Euclidean distance on the top three LVs from PLS) between MZ twin pairs and DZ twin pairs, along with appropriate null models. The null models are constructed from randomly chosen pairs of individuals in the cohort restricted to a similar age distribution as exhibited by the MZ twin pairs or DZ twin pairs, respectively, as described in SI Materials and Methods, Twin Pair Immunotype Similarities Null Model.
Fig. S5.
Fig. S5.
Analysis of Stanford cohort metadata, related to Fig. 6. (A and B) Immunotypes of Individuals plotted (the first three LVs from PLS), with individuals colored black or orange to indicate (A) gender or (B) CMV serology. The plots contain grayscale “shadows” projected onto the LV1–LV2 plane to aid 3D visualization. (C) Spearman correlation between predicted and observed metadata using ridge (age) or logistic (gender/CMV) regression models trained using PLS LVs (median ± IQR). (D) PLS learning curves using immune cell composition alone, metadata alone, and both (median ± IQR).
Fig. 6.
Fig. 6.
HCMV seropositive individuals have immunotypes shifted toward that characteristic of older populations. (A) Individuals in the cohort are projected onto the immunological age axis (predicting age from the top three LVs) from Fig. 4A. The distributions of positions on this line are compared between HCMV seronegative and seropositive (circles and triangles, respectively) individuals for young and old (y and o, respectively) age groups defined at various age thresholds along the x axis (mean ± SD). Age thresholds were chosen as percentiles 10–90 in increments of 10 based on the ages of individuals in the Stanford cohort. Asterisks indicate statistical significance (P < 0.05 according to a two-tailed t test) between HCMV seropositive or seronegative individuals for the young (black) and old (orange) groups. (B) Schematic illustrating immunotypes, represented as a continuously distributed point cloud. An additional small cluster in purple indicates a hypothetical (as-yet undiscovered) disease-associated region of immunospace. Grayscale shadows are projected into the CV1–CV2 plane to aid 3D visualization. Arrows corresponding to age and HCMV serostatus emphasize that external factors exist that influence individuals’ immunotypes throughout their lifetime. The arrow from the disease-associated to the “healthy” region of immunospace represents the potential for the proposed immunotype framework to guide the development of novel therapies that modulate immunotypes in a desired direction (Fig. S5).

Similar articles

Cited by

References

    1. Maecker HT, McCoy JP, Nussenblatt R. Standardizing immunophenotyping for the Human Immunology Project. Nat Rev Immunol. 2012;12:191–200. - PMC - PubMed
    1. Bandura DR, et al. Mass cytometry: Technique for real time single cell multitarget immunoassay based on inductively coupled plasma time-of-flight mass spectrometry. Anal Chem. 2009;81:6813–6822. - PubMed
    1. Tsang JS, et al. Baylor HIPC Center CHI Consortium Global analyses of human immune variation reveal baseline predictors of postvaccination responses. Cell. 2014;157:499–513. - PMC - PubMed
    1. Brodin P, et al. Variation in the human immune system is largely driven by non-heritable influences. Cell. 2015;160:37–47. - PMC - PubMed
    1. Orrù V, et al. Genetic variants regulating immune cell levels in health and disease. Cell. 2013;155:242–256. - PMC - PubMed

Publication types

MeSH terms