. 2017 Jul 25;114(30):E6137-E6146.
doi: 10.1073/pnas.1700655114. Epub 2017 Jul 10.

Combined epigenetic and differentiation-based treatment inhibits neuroblastoma tumor growth and links HIF2α to tumor suppression

Affiliations

Combined epigenetic and differentiation-based treatment inhibits neuroblastoma tumor growth and links HIF2α to tumor suppression

Isabelle Westerlund et al. Proc Natl Acad Sci U S A. .

Abstract

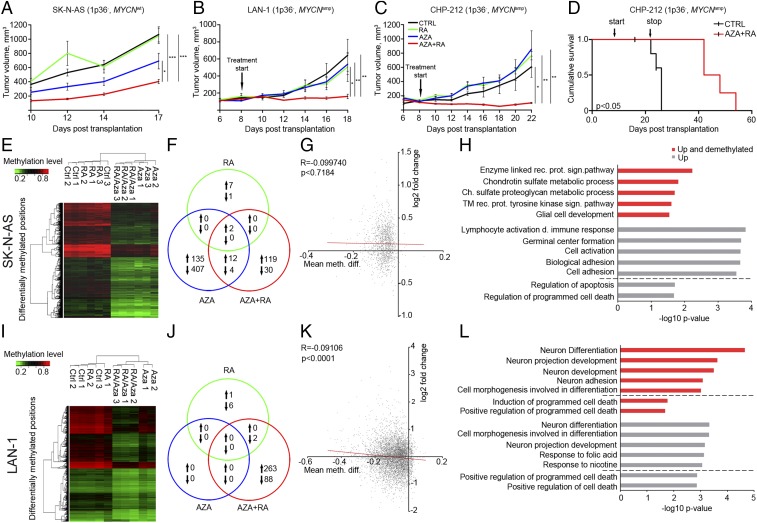
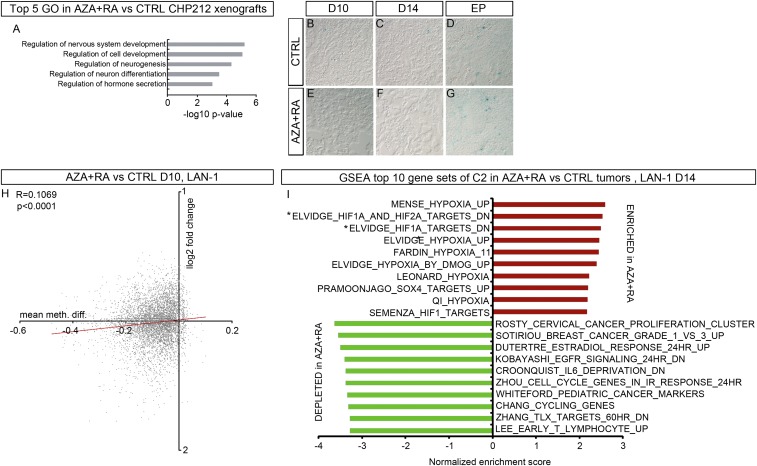
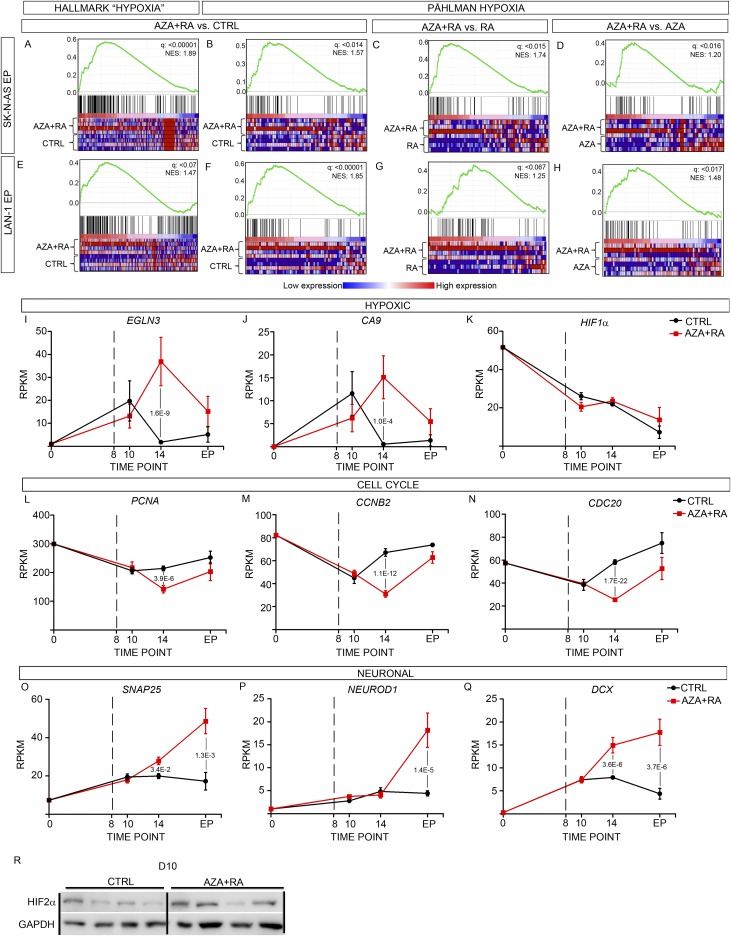
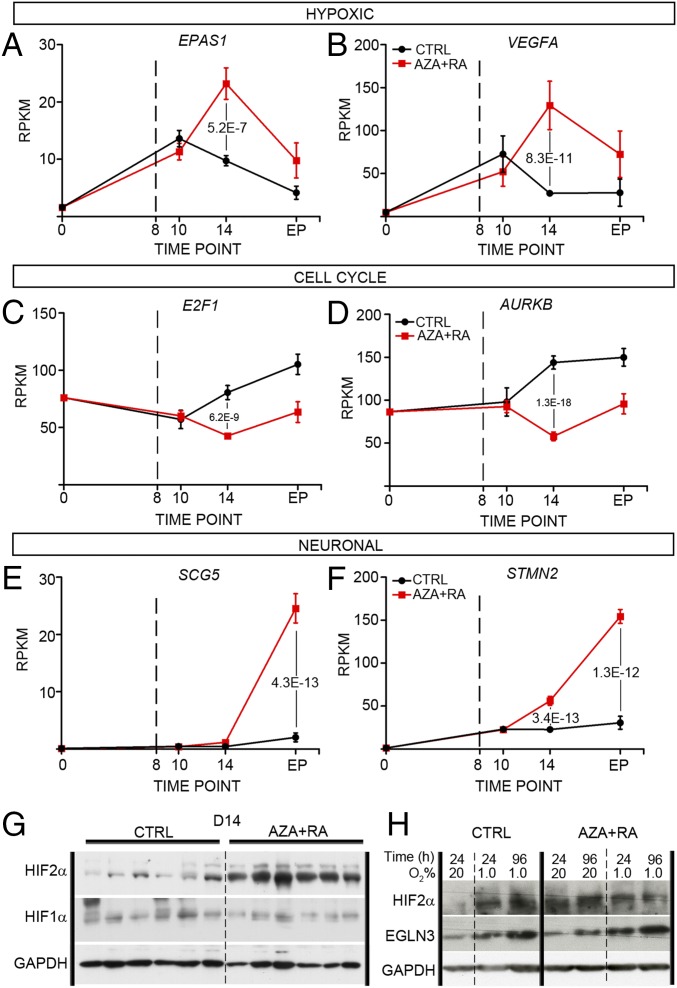
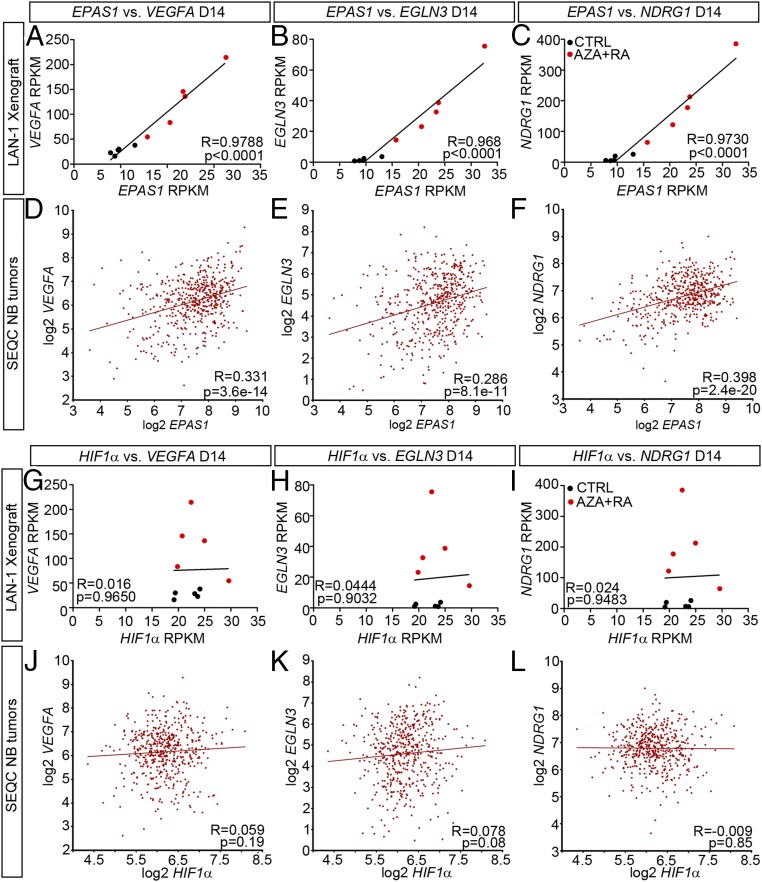
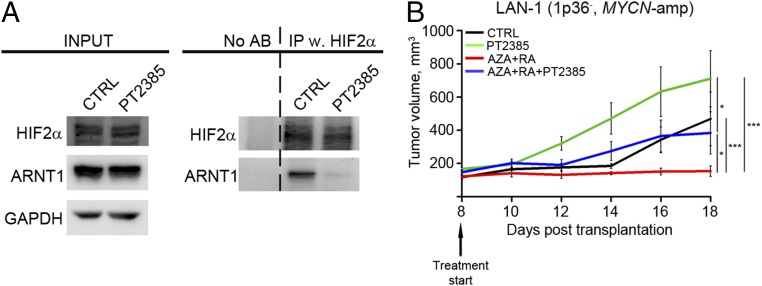
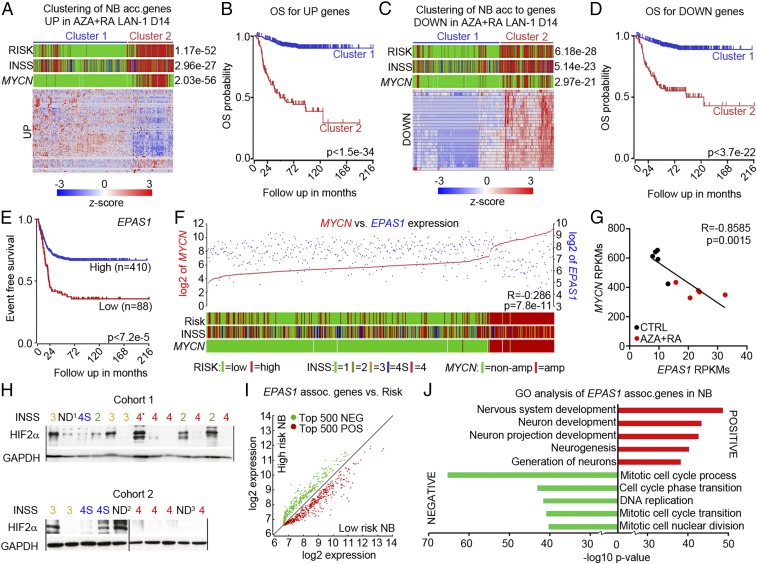
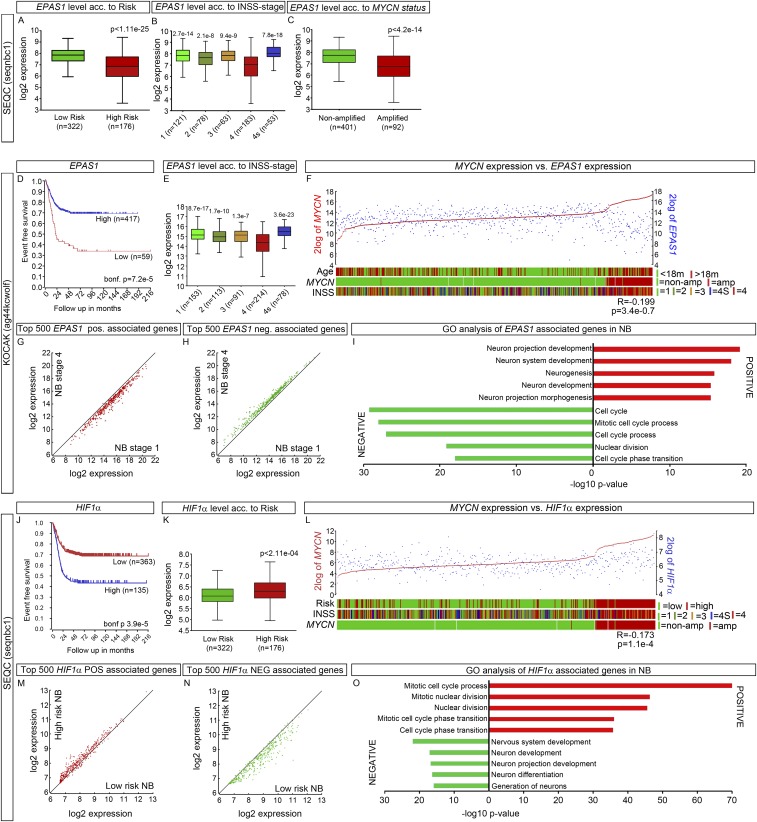
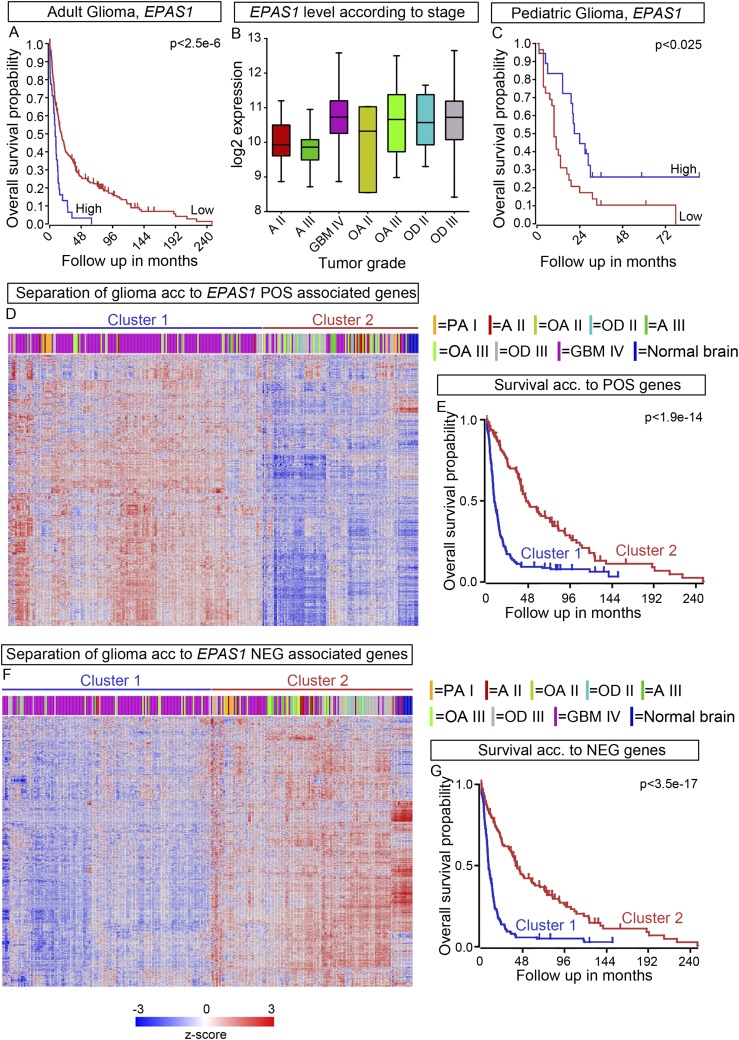
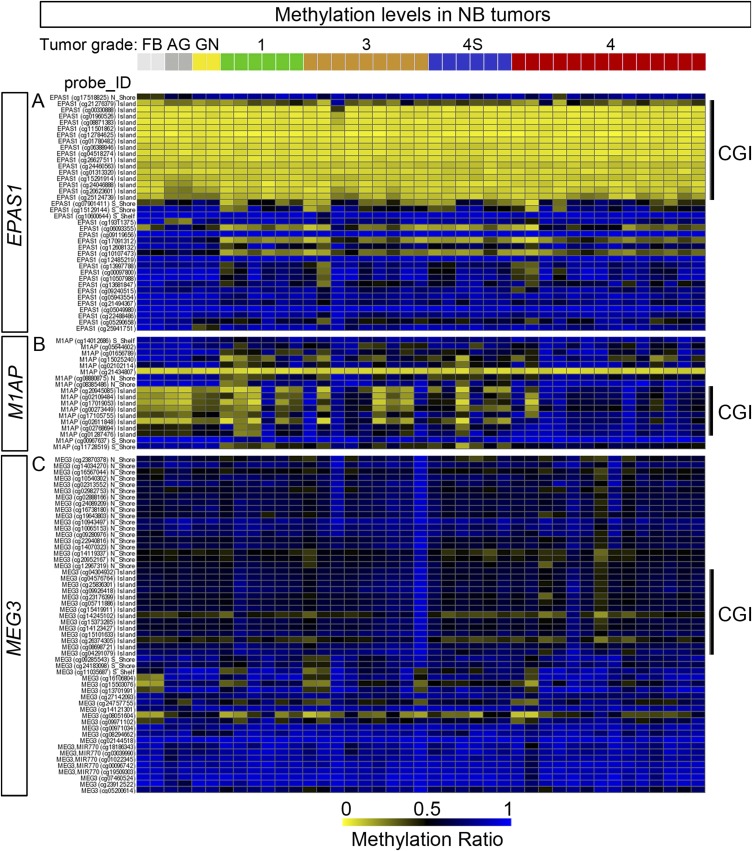
Neuroblastoma is a pediatric cancer characterized by variable outcomes ranging from spontaneous regression to life-threatening progression. High-risk neuroblastoma patients receive myeloablative chemotherapy with hematopoietic stem-cell transplant followed by adjuvant retinoid differentiation treatment. However, the overall survival remains low; hence, there is an urgent need for alternative therapeutic approaches. One feature of high-risk neuroblastoma is the high level of DNA methylation of putative tumor suppressors. Combining the reversibility of DNA methylation with the differentiation-promoting activity of retinoic acid (RA) could provide an alternative strategy to treat high-risk neuroblastoma. Here we show that treatment with the DNA-demethylating drug 5-Aza-deoxycytidine (AZA) restores high-risk neuroblastoma sensitivity to RA. Combined systemic distribution of AZA and RA impedes tumor growth and prolongs survival. Genome-wide analysis of treated tumors reveals that this combined treatment rapidly induces a HIF2α-associated hypoxia-like transcriptional response followed by an increase in neuronal gene expression and a decrease in cell-cycle gene expression. A small-molecule inhibitor of HIF2α activity diminishes the tumor response to AZA+RA treatment, indicating that the increase in HIF2α levels is a key component in tumor response to AZA+RA. The link between increased HIF2α levels and inhibited tumor growth is reflected in large neuroblastoma patient datasets. Therein, high levels of HIF2α, but not HIF1α, significantly correlate with expression of neuronal differentiation genes and better prognosis but negatively correlate with key features of high-risk tumors, such as MYCN amplification. Thus, contrary to previous studies, our findings indicate an unanticipated tumor-suppressive role for HIF2α in neuroblastoma.

Keywords: 5-Aza-dC; HIF2a; differentiation; neuroblastoma; retinoic acid.


Conflict of interest statement

The authors declare no conflict of interest.

Figures

Fig. 1.
Fig. 1.
Pretreatment with AZA restores response to RA treatment in 1p36 NB cells. (A–C) Treatment of SK-N-BE (1) (A–C), SK-N-SH (A′–C′), and SH-SY5Y (A′′–C′′) NB cells for 8 d with 10 μM RA promoted acquisition of neuronal morphology with increased expression of TUJ1 (A and B) and a reduction of cells in the S phase (C). (D) In mice xenografted with SK-N-SH cells, daily treatment with RA perturbed tumor growth. (E–I′′) 10 μM RA or 2 μM AZA treatment alone in the 1p36 NB cells SK-N-AS (E–G), LAN-1 (E′–G′), and CHP-212 (E′′–G′′) did not promote neuronal features (E–G′′), however pretreatment with AZA for 4 d followed by combined AZA+RA exposure for 8 d promoted neuronal features and inhibited cellular growth (H–H′′). Both RA and AZA treatment reduced the number of cells in the S phase but not as efficiently as the combined treatment (I–I′′). Cell-cycle data are represented as means ± SEM; P value was calculated with unpaired Student’s t test in C–C′′ and one-way ANOVA with a Bonferroni posttest in I–I′′. Tumor growth in D is represented as mean tumor volume ± SEM; **P < 0.01; two-way ANOVA (n = 6–7 per group).
Fig. S1.
Fig. S1.
(A–C) Cell counts of 1p36+ NB cell lines SK-N-BE (1) (A), SK-N-SH (B), and SH-SY5Y (C) treated for 10 d. (DF) Cell counts of 1p36 NB cell lines SK-N-AS (D), LAN-1 (E), and CHP-212 (F) treated for 10 d. (G–G′′) LAN-1 cells treated with vehicle (CTRL) for 12 d (G), 12 d + 8 d without treatment (G′), and 12 d + 18 d without treatment (G′′). (H–H′′) LAN-1 cells treated with RA for 12 d (H), 12 d RA + 8 d without treatment (H′), and 12 d RA + 18 d without treatment (H′′). (I–I′′) LAN-1 cells treated with AZA for 12 d (I), 12 d AZA + 8 d without treatment (I′), and 12 d AZA + 18 d without treatment (I′′). (J–J′′) LAN-1 cells treated with AZ+RA for 12 d (J), 12 d AZA+RA + 8 d without treatment (J′), and 12 d AZA+RA + 18 d without treatment (J′′). Black line, CTRL; blue line, RA; green line, AZA; red line, AZA+RA. *P < 0.05, ***P < 0.001; two-way ANOVA with a Bonferroni posttest.
Fig. 2.
Fig. 2.
In vivo treatment of xenografted RA-resistant 1p36 tumors with AZA+RA impedes tumor growth and prolongs survival. (A) In mice xenografted with SK-N-AS cells, only daily AZA+RA injections starting at D1 significantly inhibited tumor growth (n = 6–7 per group). (B and C) In mice xenografted with MYCN-amplified LAN-1 (B) and CHP-212 (C) cells wherein treatment started at D8, only AZA+RA delivery significantly impeded tumor growth (n = 4–5 per group). (D) Significant prolonged survival (tumor volume < 1,000 mm3) of CHP-212 xenografted mice treated with AZA+RA was evident after termination of treatment at D22 (n = 5 per group). (E) Unsupervised clustering of differentially methylated positions 2 kb upstream or downstream of TSS from retrieved SK-N-AS tumors. (F) Venn diagram depicting coregulated transcripts between the different treatment groups compared with the CTRL group in SK-N-AS tumors. (G) Graph showing how promoter methylation changes correlates with gene expression in AZA+RA- vs. CTRL-treated SK-N-AS tumors. Plotted on the x axis is the log-twofold change in gene expression; plotted on the y axis is the mean difference in means across all sites (mean meth. diff.) in a given promoter region. Only promoters with a mean meth. diff. adjusted P value of <0.25 are plotted. (H) GO analysis of the transcripts both demethylated and up (red) and up only (gray) of SK-N-AS tumors. The diagram represents the five most significant GO categories and GO categories pertaining to cell death (below dashed line). (I) Unsupervised clustering of differentially methylated positions 2 kb upstream or downstream of TSS from retrieved LAN-1 tumors. (J) Venn diagram depicting coregulated transcripts between the different treatment groups compared with the CTRL group in LAN-1 tumors. (K) Graph showing how promoter methylation changes correlate with gene expression in AZA+RA- vs. CTRL-treated LAN-1 tumors. Plotted on the x axis is the log-twofold change in gene expression; plotted on the y axis is the mean difference in means across all sites (mean meth. diff.) in a given promoter region. Only promoters with a mean meth. diff. adjusted P value of <0.05 are plotted. (L) GO analysis of the transcripts both demethylated and up (red) and up only (gray). The diagram represents the five most significant GO categories and GO categories pertaining to cell death (below dashed line). In tumor growth curves (A–C), Kaplan–Meier curve (D), and Venn diagrams (G and K), the different treatment protocols are depicted as follows: black lines, CTRL; green lines, RA; blue lines, AZA; red lines, AZA+RA. Tumor growth is represented as mean tumor volume ± SEM; *P < 0.05, **P < 0.01, ***P < 0.001; two-way ANOVA with Bonferroni’s posttest for multiple comparisons. Survival P value calculated with Log-rank test (Mantel Cox); R, Spearman coefficient.
Fig. S2.
Fig. S2.
(A) The top five GO categories derived from DEG up in AZA+RA vs. CTRL in CHP-212 xenografts. (B–G) Representative β-gal staining in CTRL- (B–D) or AZA+RA-treated (E–G) tumors at the indicated time points. (H) Graph showing how promoter methylation changes correlate with gene expression in AZA+RA- vs. CTRL-treated LAN-1 tumors at D10. Plotted on the x axis is the log-twofold change in gene expression; plotted on the y axis is the mean difference in means across all sites (mean meth. diff.) in a given promoter. Only promoters with a mean meth. diff. adjusted P value of <0.05 are plotted. (I) The top 10 GSEA C2 categories enriched for (in red) and depleted (in green) in AZA+RA-treated LAN-1 tumors at D14; all categories have an FDR of <0.00001. The two gene sets marked by * are defined as genes down-regulated in MCF7 cells (breast cancer) after knockdown of both HIF1A and HIF2A and genes down-regulated in MCF7 cells (breast cancer) after knockdown of HIF1A. R and two-tailed P value in H calculated by Pearson coefficient analysis, two-tailed Student’s t test.
Fig. 3.
Fig. 3.
In vivo treatment of LAN-1 xenografts with AZA+RA induces a robust hypoxic-like and a global reduction in transcripts promoting proliferation. (A and B) Percentage of mitotic cells (PH3+) at D10 (A) and D14 (B) in the CTRL- and AZA+RA-treated LAN-1 tumors. (C and D) Number of activated Caspase 3+ D10 (C) and D14 (D) in the CTRL- and AZA+RA-treated LAN-1 tumors. (E) Numbers of significantly differentially expressed genes (DEGs) 2 d (D10) and 6 d (D14) after treatment initiation show a delayed response with more than 3,000 DEGs at D14 compared with 102 DEGs at D10. The number of DEGs at the EP of the experiment described in Fig. 2 is shown as a comparison. Proportions of DEGs also demethylated are highlighted in red. (F) Graph showing how promoter methylation changes correlate with gene expression in AZA+RA- vs. CTRL-treated LAN-1 tumors at D14. Plotted on the x axis is the log-twofold change in gene expression; plotted on the y axis is the mean difference in means across all sites (mean meth. diff.) in a given promoter. Only promoters with a mean meth. diff. adjusted P value of <0.05 are plotted. (G) GSEA of D14 transcriptome with the Hallmarks collection of curated gene sets showing the enriched, “UP” (red) and depleted, “DOWN” (green) gene sets in AZA+RA-treated tumors. Only gene sets with a FDR q < 0.01 are shown. (H) Log-twofold changes for transcripts belonging to the top enriched Hypoxia and depleted “E2F_TARGETS” in the AZA+RA-treated tumors compared with CTRL tumors. (I and J) GSEA of the Fardin_Hypoxia_11 (I) and Påhlman Hypoxia” (J) NB-derived gene sets. (K and L) GSEA of the “Manalo_Hypoxia_Down” (K) and “Whiteford_Pediatric_Cancer_Markers” (L) gene sets. ES, enrichment score; NES, normalized enrichment score. Data in A–D are represented as mean ± SD; *P < 0.05, **P < 0.01; unpaired Student’s t test. In F, R is the Spearman coefficient. Data in H are represented as log-twofold AZA+RA vs. CTRL; **adj. P < 0.01, ***adj. P < 0.001 as calculated by Deseq2.
Fig. S3.
Fig. S3.
Table showing DEG and methylation changes in AZA+RA-treated LAN-1 tumors at D10, D14, and EP and in SK-N-AS tumors at EP of previously described CIMP factors. Red color denotes increased gene expression, and green color denotes decreased gene expression. NC, no change.
Fig. S4.
Fig. S4.
(A–D) Enrichment of HALLMARK HYPOXIA in SK-N-AS tumors treated with AZA+RA vs. CTRL (A), enrichment of PÅHLMAN_HYPOXIA in AZA+RA vs. CTRL (B), AZA+RA vs. RA (C), and AZA+RA vs. AZA (D). (E–H) Enrichment of HALLMARK HYPOXIA in LAN-1 tumors treated with AZA+RA vs. CTRL (E), enrichment of PÅHLMAN_HYPOXIA in AZA+RA vs. CTRL (F), AZA+RA vs. RA (G), and AZA+RA vs. AZA (H). (I–K) Time curves show how expression levels (RPKMs) of hypoxic-responsive genes EGLN3 (I), CA9 (J), and HIF1α (K) vary from normoxic in vitro conditions (0) to different time points (D8, D10, and EP) in the CTRL (black line) and AZA+RA (red line) tumors. (L–N) Time curves show how expression levels (RPKMs) of cell cycle-associated genes PCNA (L), CCNB2 (M), and CDC20 (N) vary from normoxic in vitro conditions (0) to different time points (D8, D10, and EP) in the CTRL (black line) and AZA+RA (red line) tumors. (O–Q) Time curves show how expression levels (RPKMs) of neuronal genes SNAP25 (P), NEUROD1 (Q), and DCX (R) vary from normoxic in vitro conditions (0) to different time points (D8, D10, and EP) in the CTRL (black line) and AZA+RA (red line) tumors. Dashed lines at D8 denotes initiation of treatment in I–Q. Significant P values are indicated in I–Q. (R) Western blot showing HIF2α protein level in CTRL- and AZA+RA-treated tumors at D10; GAPDH is shown as the loading control.
Fig. 4.
Fig. 4.
AZA+RA treatment induces expression of the response associated with high EPAS1/HIF2α levels. (A and B) Time curves show how expression levels (RPKMs) of key hypoxic responsive genes EPAS1 (A) and VEGFA (B) vary from untreated normoxic in vitro conditions (0) to different time points (D8, D10, and EP) in the CTRL (black line) and AZA+RA (red line) tumors. Dashed lines at D8 denotes initiation of treatment. (C and D) Time curves show how expression levels (RPKMs) of cell cycle-associated genes E2F1 (C) and AURKB (D) vary from normoxic in vitro conditions (0) to different time points (D8, D10, and EP) in the CTRL (black line) and AZA+RA (red line) tumors. Dashed lines at D8 denotes initiation of treatment. (E and F) Time curves show how expression levels (RPKMs) of neuronal transcripts SCG5 (E) and STMN2 (F) vary from untreated normoxic in vitro conditions (0) to different time points (D8, D10, and EP) in the CTRL (black line) and AZA+RA (red line) tumors. Dashed lines at D8 denotes initiation of treatment. (G) Western blot analysis of AZA+RA and CTRL tumors at D14 with HIF2α- and HIF1α-specific antibodies; GAPDH is shown as a loading control. (H) Western blot analysis of HIF2α and EGLN3 in LAN-1 cells cultivated in 20% or 1.0% oxygen untreated (CTRL) or treated with AZA+RA. GAPDH is shown as a loading control. Adjusted P values in A–F as calculated by Deseq2 (Benjamini–Hochberg adjusted P value); error bars in A–F denote SEM.
Fig. 5.
Fig. 5.
EPAS1 but not HIF1α expression levels correlate with expression of key hypoxia-inducible genes in LAN-1 tumors and in patient-derived NB. (A–C) In LAN-1 xenografts at D14, EPAS expression correlates with expression of VEGFA (A), EGLN3 (B), and NDRG1 (C). (D–F) In NB patient-derived tumors, EPAS expression correlates with expression of VEGFA (D), EGLN3 (E), and NDRG1 (F). (G–I) In LAN-1 xenografts at D14, there is no correlation between HIF1α expression and expression of VEGFA (G), EGLN3 (H), and NDRG1 (I). (J–L) In NB patient-derived tumors, there is no correlation between HIF1α expression and expression of VEGFA (J), EGLN3 (K), and NDRG1 (L).
Fig. 6.
Fig. 6.
The HIF2α-specific small-molecule inhibitor PT2385 diminishes the effects of AZA+RA treatment. (A) Immunoprecipitation of HIF2α with lysates from LAN-1 cells grown at hypoxia (1% O2) with or without PT2385 treatment, followed by Western blotting with HIF2α- and ARNT1-specific antibodies, shows a reduction of HIF2α and ARNT1 interaction upon treatment with PT2385. (B) In mice xenografted with MYCN-amplified LAN-1 cells, treatment with PT2385 diminishes the response to AZA+RA treatment (n = 6 per group). Tumor growth is represented as mean tumor volume ± SEM; *P < 0.05, ***P < 0.001; two-way ANOVA with Bonferroni’s posttest for multiple comparisons.
Fig. 7.
Fig. 7.
High levels of EPAS1/HIF2α are associated with favorable NB prognosis. (A) The k-means analysis showed that transcripts increased 2× (UP) in AZA+RA-treated LAN-1 tumors at D14 could separate the patient tumor dataset according to Risk, INSS, and MYCN status. (B) Kaplan–Meier analysis showed that the UP genes from A predict increased overall survival. (C) The k-means analysis showed that transcripts decreased 2× (DOWN) in AZA+RA-treated LAN-1 tumors at D14 could separate the patient tumor dataset according to Risk, INSS, and MYCN status. (D) Kaplan–Meier analysis showed that the DOWN genes from C predict decreased overall survival. (E) Kaplan–Meier analysis of 498 NB tumor samples showed longer event free survival for patients with high EPAS1 levels. (F) EPAS1 expression levels (blue) plotted against MYCN expression levels (red). The lower bars show Risk, INSS, and MYCN status. Color legend for RISK, INSS, and MYCN status is shown in A, C, and F. (G) Correlation of EPAS1 expression levels with MYCN expression in the D14 LAN-14 tumors. (H) Western blot showing HIF2α protein levels in NB of different grades; GAPDH is shown for protein normalization. The ND1 tumor lacks INSS staging but is MYCNWT, and the patient had no evidence of disease after more than 60 months. ND2 denominates a tumor without INSS staging but is determined as a 1p36+ localized (L1) tumor lacking MYCNamp and as not being a high-risk tumor according to CGH classification. ND3 denominates a tumor lacking clinical information. Tumor 4* was classified as grade 4 but expresses high levels of TH. (I) Analysis of the top 500 genes positively (POS, red) correlated or negatively (NEG, green) regulated with the EPAS1 transcript showed that all of the POS genes were enriched for in the low-risk NB and all of the NEG genes were enriched for in the high-risk NB. (J) Enrichment of neuronal-associated GO terms for the genes showing a positive correlation with EPAS1 expression and enrichment of cell cycle-associated GO terms for the genes showing a negative correlation with EPAS1 expression. ND, not determined.
Fig. S5.
Fig. S5.
(A) In the 498 SEQC NB patient cohort, high EPAS1 levels were associated with low-risk tumors. (B) High EPAS1 levels were associated with low-grade tumors, whereas grade 4 tumors exhibit low-expression EPAS1 levels. (C) Low EPAS1 expression was evident in MYCNamp tumors. (D) Kaplan–Meier analysis of the KOCAK NB dataset containing 649 tumor samples showed longer event free survival for patients with high EPAS1 levels. (E) In the KOCAK NB dataset, high EPAS1 levels were associated with low-grade tumors, whereas grade 4 tumors exhibit low expression EPAS1 levels. (F) In the KOCAK NB dataset, EPAS1 expression levels (blue) were plotted against MYCN expression levels (red). The lower bars show Risk, INSS, and MYCN status. (G and H) Analysis in the KOCAK dataset of the top 500 genes positively (POS, red) correlated or negatively (NEG, green) correlated with the EPAS1 transcript showed that POS genes were enriched in the grade 1 NB (G) and NEG genes were enriched for in grade 4 NB (H). (I) In the KOCAK dataset, enrichment of neuronal-associated GO terms for the genes showed positive correlation with EPAS1 expression, and enrichment of cell cycle-associated GO terms for the genes showed negative correlation with EPAS1 expression. (J) Kaplan–Meier analysis of the 498 NB SEQC tumor samples dataset showed shorter event free survival for patients with high levels of HIF1α. (K) In the same patient cohort, high HIF1α levels were associated with low-risk tumors. (L) HIF1α expression levels (blue) plotted against MYCN expression levels (red). The lower bars show Risk, INSS, and MYCN status. (M and N) Analysis of the top 500 genes positively (POS, red) correlated or negatively (NEG, green) correlated with the HIF1α transcript showed that POS genes were enriched for in the high-risk NB (M) and NEG genes were enriched for in the low-risk NB (N). (O) Enrichment of cell cycle-associated GO terms for the genes showing positive correlation with HIF1α expression and enrichment of neuronal-associated GO terms for the genes showing a negative correlation with HIF1α expression.
Fig. S6.
Fig. S6.
(A) Kaplan–Meier analysis of 284 adult glioma tumor samples (FRENCH) showed shorter overall survival for patients with high levels of EPAS1. (B) In glioma EPAS1 expression is significantly higher in grade IV (GBM IV) tumors than in astrocytoma grade II (AII) and grade III (AIII). (C) Kaplan–Meier analysis of 53 pediatric glioma tumor samples (PAUGH) showed longer overall survival for patients with high levels of EPAS1. (D) The k-means analysis of genes positively (POS) correlated with EPAS1 in adult glioma. (E) Kaplan–Meier analysis showed that the POS genes from D predict decreased overall survival. (F) The k-means analysis of genes negatively (NEG) correlated with EPAS1 in adult glioma. (G) Kaplan–Meier analysis showed that the NEG genes from F predict decreased overall survival.
Fig. S7.
Fig. S7.
(A–C) 450K Illumina methylation array probes associated with three different genes: EPAS1 (A), M1AP displaying high levels of CGI methylation in high-grade NB tumors (B), and the imprinted gene MEG3 exhibiting overall high CGI methylation (C) derived from the LAVARINO dataset consisting of 41 NB tumors, ganglioneuroma (GN), adrenal gland (AG), and fetal brain (FB). The probes defined as CpG islands are marked as CGI.

Comment in

References

    1. Brodeur GM. Neuroblastoma: Biological insights into a clinical enigma. Nat Rev Cancer. 2003;3:203–216. - PubMed
    1. Pietras A, Johnsson AS, Påhlman S. The HIF-2α-driven pseudo-hypoxic phenotype in tumor aggressiveness, differentiation, and vascularization. Curr Top Microbiol Immunol. 2010;345:1–20. - PubMed
    1. Mohlin S, Hamidian A, Påhlman S. HIF2A and IGF2 expression correlates in human neuroblastoma cells and normal immature sympathetic neuroblasts. Neoplasia. 2013;15:328–334. - PMC - PubMed
    1. Noguera R, et al. HIF-1alpha and HIF-2alpha are differentially regulated in vivo in neuroblastoma: High HIF-1alpha correlates negatively to advanced clinical stage and tumor vascularization. Clin Cancer Res. 2009;15:7130–7136. - PubMed
    1. Pietras A, et al. HIF-2alpha maintains an undifferentiated state in neural crest-like human neuroblastoma tumor-initiating cells. Proc Natl Acad Sci USA. 2009;106:16805–16810. - PMC - PubMed

Publication types

MeSH terms