. 2017 Jul 11:4:170088.
doi: 10.1038/sdata.2017.88.

A global multiproxy database for temperature reconstructions of the Common Era

Collaborators

A global multiproxy database for temperature reconstructions of the Common Era

PAGES2k Consortium. Sci Data. .

Abstract

Reproducible climate reconstructions of the Common Era (1 CE to present) are key to placing industrial-era warming into the context of natural climatic variability. Here we present a community-sourced database of temperature-sensitive proxy records from the PAGES2k initiative. The database gathers 692 records from 648 locations, including all continental regions and major ocean basins. The records are from trees, ice, sediment, corals, speleothems, documentary evidence, and other archives. They range in length from 50 to 2000 years, with a median of 547 years, while temporal resolution ranges from biweekly to centennial. Nearly half of the proxy time series are significantly correlated with HadCRUT4.2 surface temperature over the period 1850-2014. Global temperature composites show a remarkable degree of coherence between high- and low-resolution archives, with broadly similar patterns across archive types, terrestrial versus marine locations, and screening criteria. The database is suited to investigations of global and regional temperature variability over the Common Era, and is shared in the Linked Paleo Data (LiPD) format, including serializations in Matlab, R and Python.


Conflict of interest statement

The authors declare no competing financial interests.

Figures
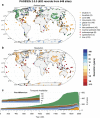
Figure 1
Figure 1. Spatiotemporal data availability in the PAGES2k database.
(a) Geographical distribution, by archive type, coded by color and shape. (b) Temporal resolution in the PAGES2k database, defined here as the median of the spacing between consecutive observations. Shapes as in (a), colors encode the resolution in years (see colorbar). (c) Temporal availability, coded by color as in (a).
Figure 2
Figure 2. Data availability in the M08 (refs 33,34) and PAGES2k-2013 (ref. 11) databases.
Graphical conventions as in Fig. 1. Note that the y-axis scale varies between plots on account of the large differences in number of records, but the first millennium inset uses the same scale between all comparable panels in Fig. 1 and this one, to highlight progress made in bolstering coverage of this time period.
Figure 3
Figure 3. Global mean temperature from the HadCRUT4.2 dataset before (gray) and after (red) imputing missing monthly values via GraphEM.
Black circles mark the yearly averages (mean annual temperature, or MAT) of GraphEM-imputed temperature values (red line).
Figure 4
Figure 4. Quality-control plot for record Ocn_114 (Ocean_QCfig_bundle.pdf, Data Citation 1).
See text for details as an example of record that can be calibrated in time.
Figure 5
Figure 5. Quality-control plot for record Ocn_015 (Ocean_QCfig_bundle.pdf, Data Citation 1).
See text for details as an example of record that cannot be calibrated in time.
Figure 6
Figure 6. Relationships with temperature and other records.
Median absolute correlations (a) of each record with mean annual temperature within a 2,000 km radius; (b) of each record with mean annual temperature at the nearest grid point; (c) of each low-resolution record with its 10 closest high-resolution proxy neighbors; (d) of temperature at each grid point and its proxy neighbors within a 2,000 km radius. Proxy-centric correlations (ac) are reported in color if significant; as small black symbols if insignificant or not applicable. Grid-centric correlations (d) are reported in color if significant; in grey if insignificant or not computable (i.e., no proxy neighbor within 2,000 km).
Figure 7
Figure 7. Global composites for various binning intervals and screening criteria, as indicated in subplot titles.
The composites are scaled to temperature for comparison, and the shading denotes 95% bootstrap confidence intervals with 500 replicates, to constrain uncertainties. The cutoff between high-resolution (HR) and low-resolution (LR) records is defined as a median resolution of 5 years. Screening options comprise: no screening (none), regional temperature screening (regional), or regional screening adjusted for the false discovery rate (regionalFDR). For low-resolution records, basicFilter denotes records that comprise at least 20 values over the Common Era (Supplementary Fig. 2), while hrNeighbors denotes records with at least one significantly correlated HR neighbor.
Figure 8
Figure 8. 50-year binned composites stratified by archive type, for all types comprising 5 or more series.
Composites with fewer than 10 available series are shown by a dotted curve, while solid lines indicate more than 10 series. Shading indicates 95% bootstrap confidence intervals with 500 replicates. Gray bars indicate the number of records per bin. The composites are expressed in standard deviation units, not scaled to temperature.

Dataset use reported in

  • doi: 10.1038/ngeo2510
  • doi: 10.1002/2014PA002717

References

Data Citations

    1. PAGES 2k Consortium 2017. figshare. https://doi.org/10.6084/m9.figshare.c.3285353 - DOI
    1. Tierney J. 2010. World Data Center for Paleoclimatology. https://www.ncdc.noaa.gov/paleo/study/10428
    1. Powers L. 2012. World Data Center for Paleoclimatology. https://www.ncdc.noaa.gov/paleo/study/13216
    1. Sundqvist H. 2013. World Data Center for Paleoclimatology. https://www.ncdc.noaa.gov/paleo/study/14349
    1. Stenni B. 2002. World Data Center for Paleoclimatology. https://www.ncdc.noaa.gov/paleo/study/2465

References

    1. Jacoby G. C. Jr & D’Arrigo R. Reconstructed Northern Hemisphere annual temperature since 1671 based on high-latitude tree-ring data from North America. Climatic Change 14, 39–59 (1989).
    1. D’Arrigo R. D. & Jacoby G. C. Secular trends in high northern latitude temperature reconstructions based on tree rings. Climatic Change 25, 163–177 (1993).
    1. D’Arrigo R., Jacoby G., Free M. & Robock A. Northern Hemisphere temperature variability for the past three centuries: tree-ring and model estimates. Climatic Change 42, 663–675 (1999).
    1. Mann M. E., Bradley R. S. & Hughes M. K. Global-scale temperature patterns and climate forcing over the past six centuries. Nature 392, 779–787 (1998).
    1. Mann M. E., Bradley R. S. & Hughes M. K. Northern Hemisphere temperatures during the past millennium: Inferences, uncertainties, and limitations. Geophysical Research Letters 26, 759–762 (1999).

Publication types

LinkOut - more resources