. 2018 Feb;67(2):534-548.
doi: 10.1002/hep.29359. Epub 2017 Dec 23.

The presence and severity of nonalcoholic steatohepatitis is associated with specific changes in circulating bile acids

Affiliations

The presence and severity of nonalcoholic steatohepatitis is associated with specific changes in circulating bile acids

Puneet Puri et al. Hepatology. 2018 Feb.

Abstract

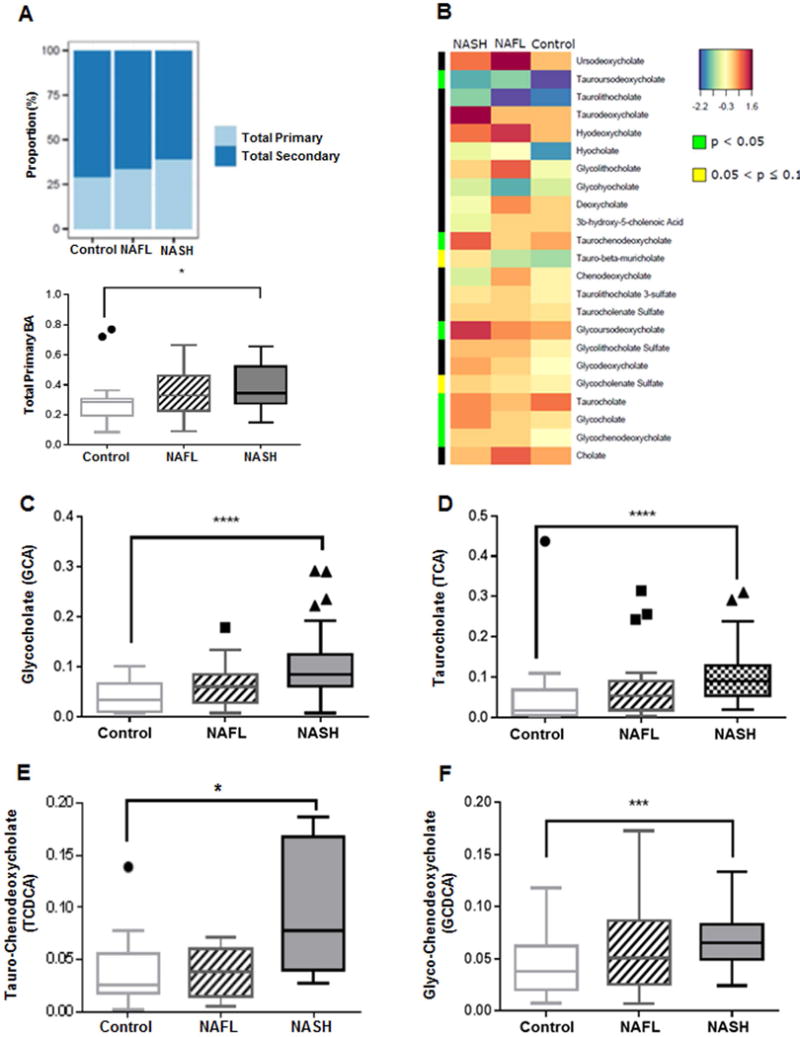
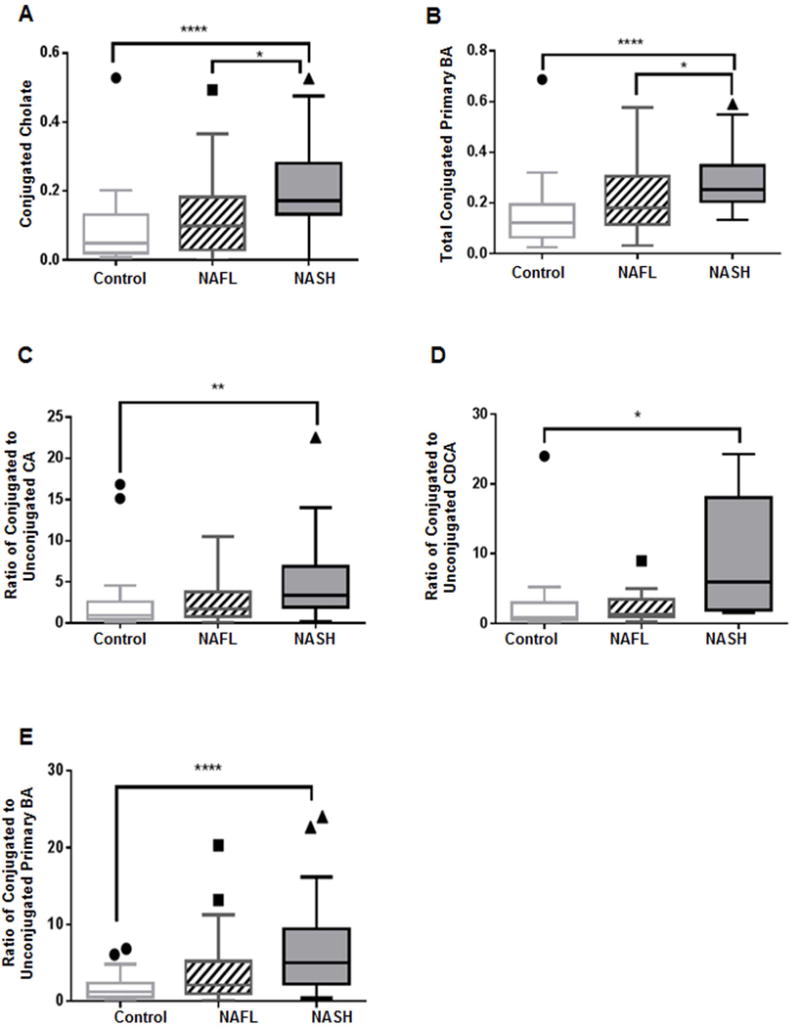
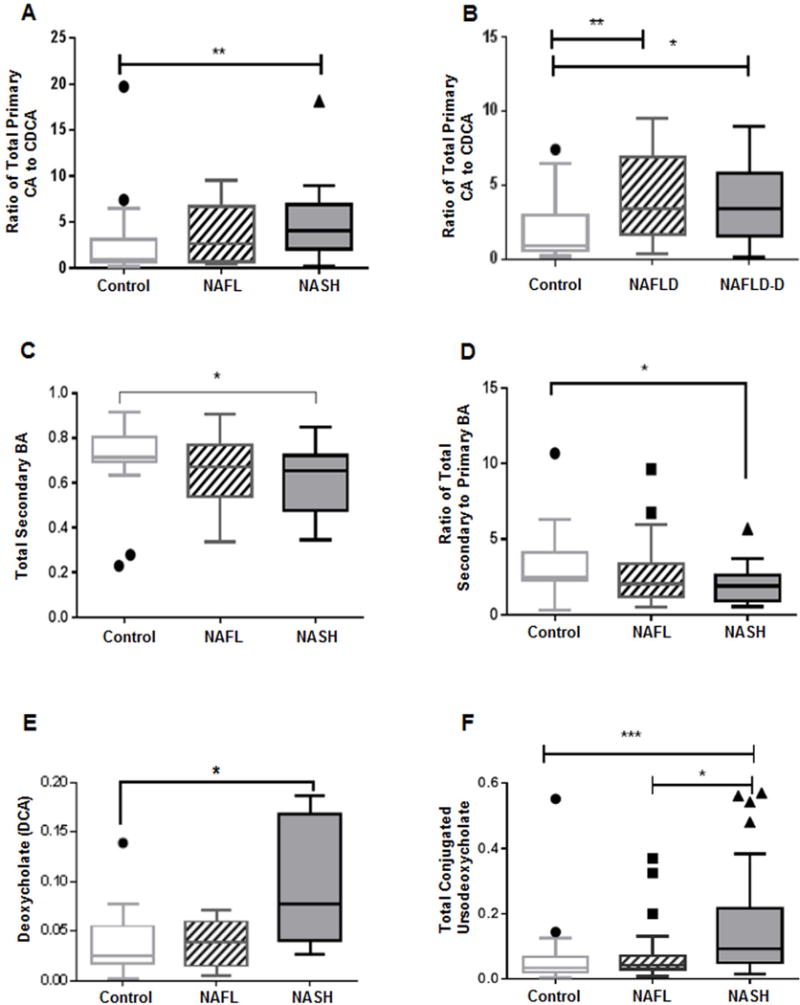
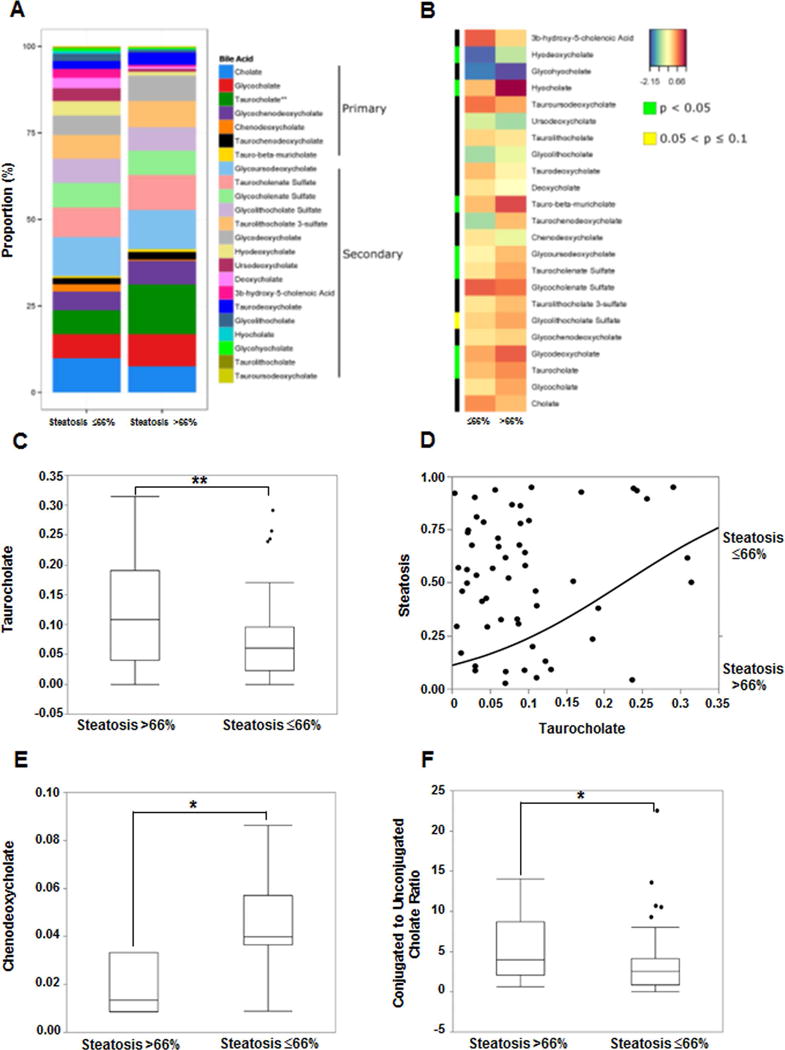
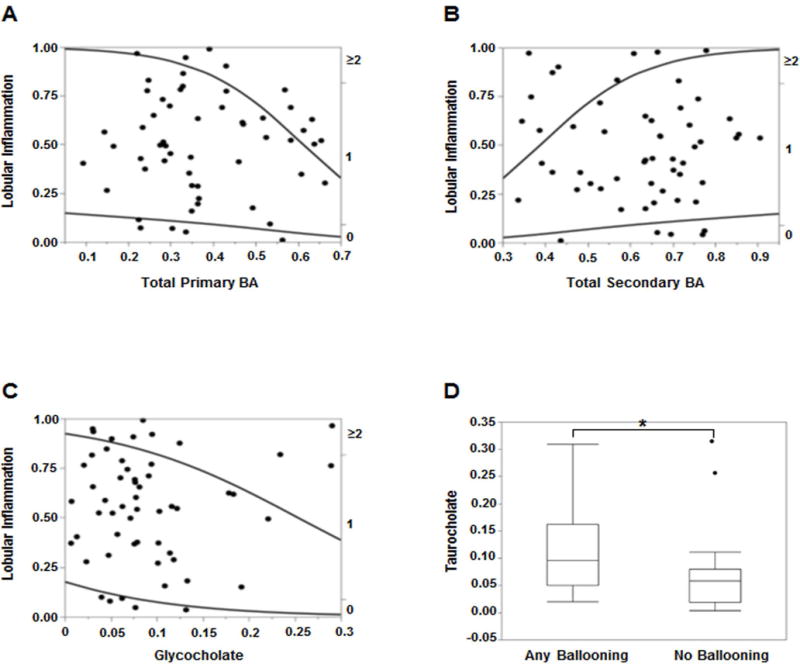
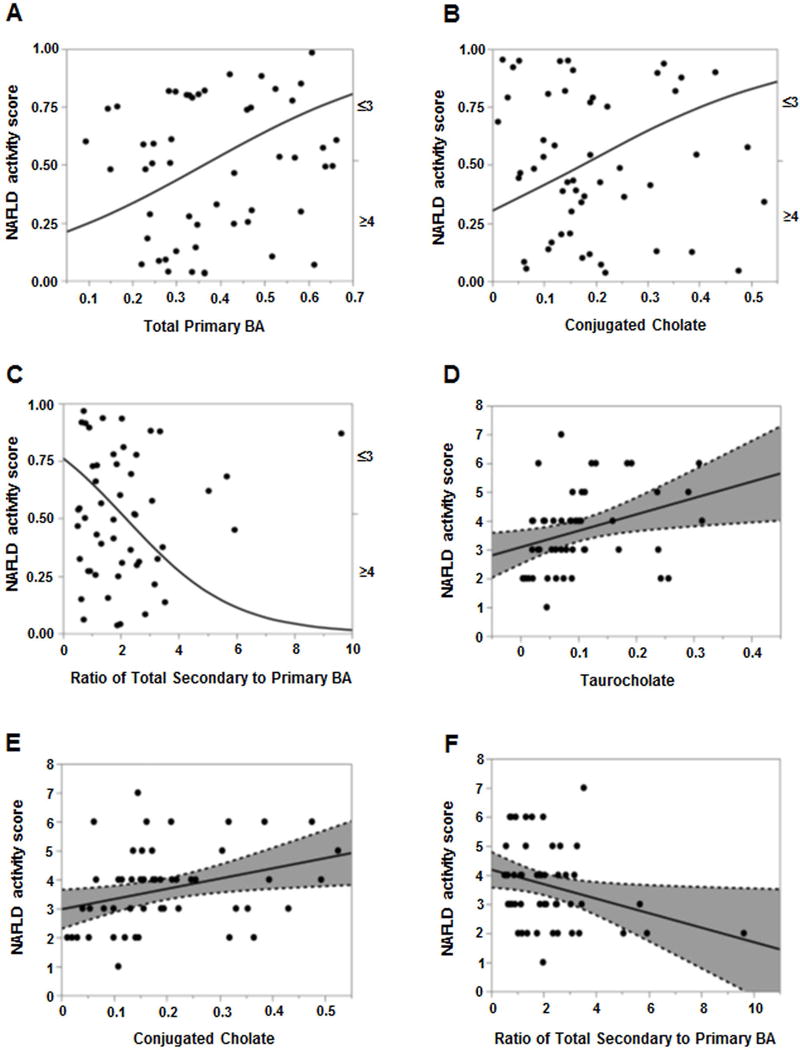
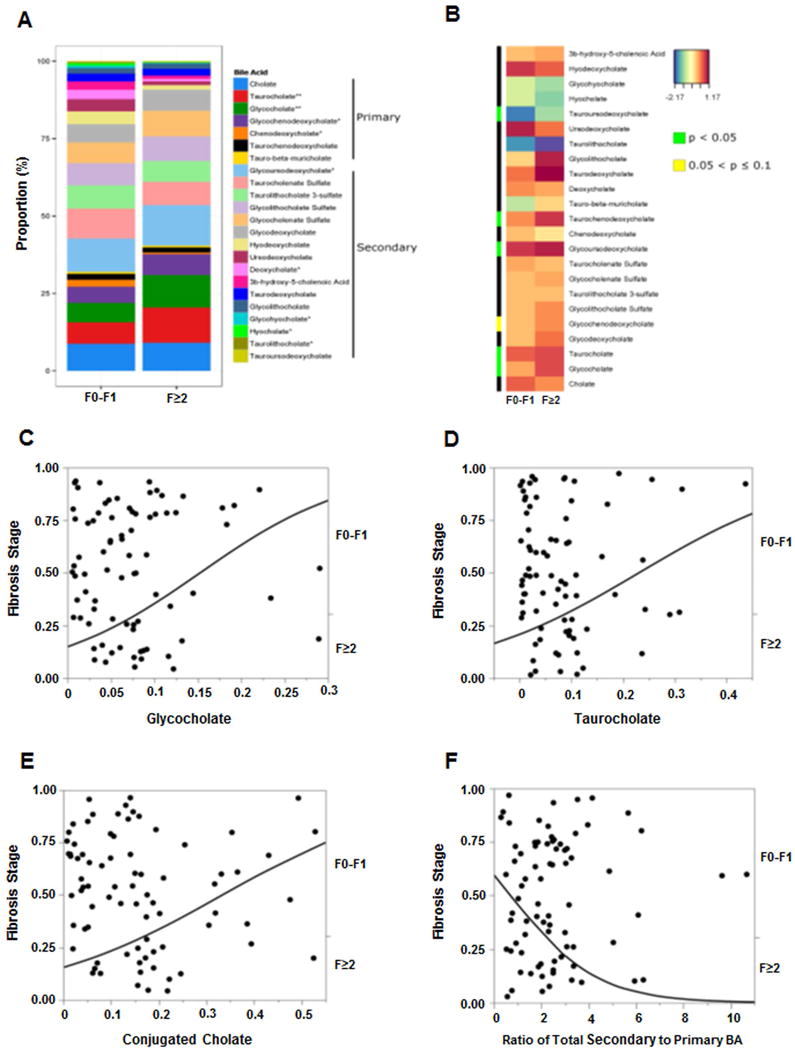
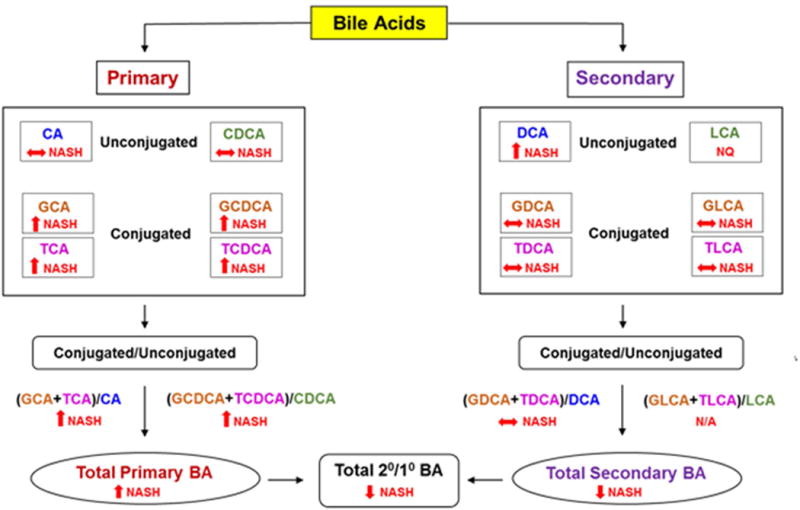
The histologic spectrum of nonalcoholic fatty liver disease (NAFLD) includes fatty liver (NAFL) and steatohepatitis (NASH), which can progress to cirrhosis in up to 20% of NASH patients. Bile acids (BA) are linked to the pathogenesis and therapy of NASH. We (1) characterized the plasma BA profile in biopsy-proven NAFL and NASH and compared to controls and (2) related the plasma BA profile to liver histologic features, disease activity, and fibrosis. Liquid chromatography/mass spectrometry quantified BAs. Descriptive statistics, paired and multiple group comparisons, and regression analyses were performed. Of 86 patients (24 controls, 25 NAFL, and 37 NASH; mean age 51.8 years and body mass index 31.9 kg/m2 ), 66% were women. Increased total primary BAs and decreased secondary BAs (both P < 0.05) characterized NASH. Total conjugated primary BAs were significantly higher in NASH versus NAFL (P = 0.047) and versus controls (P < 0.0001). NASH had higher conjugated to unconjugated chenodeoxycholate (P = 0.04), cholate (P = 0.0004), and total primary BAs (P < 0.0001). The total cholate to chenodeoxycholate ratio was significantly higher in NAFLD without (P = 0.005) and with (P = 0.02) diabetes. Increased key BAs were associated with higher grades of steatosis (taurocholate), lobular (glycocholate) and portal inflammation (taurolithocholate), and hepatocyte ballooning (taurocholate). Conjugated cholate and taurocholate directly and secondary to primary BA ratio inversely correlated to NAFLD activity score. A higher ratio of total secondary to primary BA decreased (odds ratio, 0.57; P = 0.004) and higher conjugated cholate increased the likelihood of significant fibrosis (F≥2) (P = 0.007). Conclusion: NAFLD is associated with significantly altered circulating BA composition, likely unaffected by type 2 diabetes, and correlated with histological features of NASH; these observations provide the foundation for future hypothesis-driven studies of specific effects of BAs on specific aspects of NASH. (Hepatology 2018;67:534-548).


Conflict of interest statement

Conflicts of Interest:

None: Drs. Puri, Min, Zhou, Hylemon, Santhekadur, Cazanave, Kumar & Ms. Boyett

*Dr. Andrew Joyce: No relevant conflicts. He is Chief Scientific Officer and has an ownership interest in Venebio, based in Richmond

*Faridoddin Mirshahi: No relevant conflicts. Ownership interest in Sanyal Biotechnologies

*Dr. Velimir Luketic: No relevant conflicts. Received grant support from Intercept, Genfit.

*Dr. Mohammed Siddiqui: No relevant conflicts. He has received grant support from Nusirt, Immuron and Taiwan J Pharmaceuticals.

*Dr. Rohit Kohli: No relevant conflicts. He has received grant support/speaker fees from Intercept, Galectin, Raptor, and Shire.

*Dr. Arun Sanyal: None for this project. Dr. Sanyal is President of Sanyal Biotechnology and has stock options in Genfit. He has served as a consultant to AbbVie, Astra Zeneca, Nitto Denko, Nimbus, Salix, Tobira, Takeda, Fibrogen, Lilly, Zafgen, Novartis, Pfizer, Immuron, Exhalenz and Genfit. He has been an unpaid consultant to Intercept, Echosens, Immuron, Amarin, Ardelyx, Fractyl, Syntlogic, Nordic Bioscience and Bristol Myers Squibb. His institution has received grant support from Gilead, Salix, Tobira, Intercept, Merck, Astra Zeneca and Novartis.

Figures

Figure 1
Figure 1. Plasma bile acid profile is significantly altered in NASH
Data represented as box and whiskers Tukey plot with median and staggered outliers. (A) Stack bar plot representing proportion of total primary and secondary BAs, and box and whisker plot for total primary BAs. (B) Heat map display of the spectrum of BA profile across 3 study groups with orange/reds as larger and blue/greens as smaller measurements. The green color on side bar along the left side of the heat map indicates p<0.05. (C–F) Glycine and taurine conjugates of cholate and chenodeoxycholate. BA, bile acid; *p<0.05, ***p<0.001, ****p<0.0001
Figure 2
Figure 2. Plasma BAs along Primary BA pathway
Patients with NASH demonstrate significantly increased (A) conjugated cholate and (B) total conjugated primary BAs. Patients with NASH also demonstrate significantly increased proportions of conjugated to unconjugated (C) cholate (CA), (D) chenodeoxycholate (CDCA), and (E) primary BAs. The BA levels were measured against known internal standards in global metabolomics profile and provides a relative quantitative measure of the BAs relative to the library standards across samples. *p<0.05, **p<0.01, ****p<0.0001; BA, bile acid
Figure 3
Figure 3. Distinct primary and secondary plasma bile acid changes in NAFLD and NASH
Significantly increased ratio of total primary cholate (CA) to chenodeoxycholate (CDCA) (A) in NASH compared to controls, and (B) in both NAFLD without diabetes and with diabetes vs. controls. (C) secondary BA significantly decreased in NASH. (D) Ratio of secondary to primary BA is significantly lower in NASH. (E) Significantly increased deoxycholate (DCA) in NASH. (F) Patients with NASH had significantly increased conjugated ursodeoxycholate compared to both NAFL and controls. Data represented in box and whisker Tukey plots with medians and staggered outliers. The BA levels were measured against known internal standards in global metabolomics profile and provides a relative quantitative measure of the BAs relative to the library standards across samples. NAFLD-D, NAFLD with diabetes; *p≤0.05, **p<0.01, ***p<0.001
Figure 4
Figure 4. Plasma bile acid associations with hepatic steatosis in NAFLD
Data for hepatic steatosis on liver histology dichotomized to ≤66% and >66%. (A) The stacked bar plots reflect mean measured bile acids with significant increase in taurocholate in steatosis>66%. (B) Heat map display of BA profile for steatosis ≤66% vs. >66% with orange/reds indicating larger and blue/greens as smaller measurements. The green color on side bar along the left side of the heat map indicates p<0.05. (C) Subjects with steatosis >66% had significantly higher taurocholate. (D) Increasing taurocholate increased the probability of >66% steatosis on nominal logistic regression. (E) Decreased chenodeoxycholate was associated with steatosis >66%. (F) Subjects with steatosis >66% had higher ratio of conjugated to unconjugated cholate. The BA levels were measured against known internal standards in global metabolomics profile and provides a relative quantitative measure of the BAs relative to the library standards across samples.
Figure 5
Figure 5. Plasma bile acid associations with lobular inflammation and hepatocyte ballooning in NAFLD
Higher degree of lobular inflammation (≥2) was more likely with increasing (A) total primary BAs and (C) glycocholate, and (B) less likely with secondary BAs on nominal logistic regression. (D) Presence of hepatocyte ballooning was associated with significantly higher levels of taurocholate. The BA levels were measured against known internal standards in global metabolomics profile and provides a relative quantitative measure of the BAs relative to the library standards across samples.
Figure 6
Figure 6. Plasma bile acid associations with NAFLD Activity Score (NAS)
For panels A–C. The probability of NAS ≥4 was significantly higher with increasing (A) total primary BAs and (B) conjugated cholate. (C) Increasing ratio of total secondary to primary BAs significantly decreased the likelihood of NAS ≥4. For panels D–F, least square regression analyses for NAS as a continuous variable (0–8) revealed direct association with increasing NAS score and higher (D) taurocholate and (E) conjugated cholate, and (F) inverse relation to total secondary to primary BAs ratio. The BA levels were measured against known internal standards in global metabolomics profile and provides a relative quantitative measure of the BAs relative to the library standards across samples.
Figure 7
Figure 7. Plasma bile acid associations with fibrosis in NAFLD
Data represented for fibrosis dichotomized as F0-F1 and F≥2. (A) The stacked bar plot reflects mean bile acids with several significant changes associated with F≥2 fibrosis stage, most notably increased taurocholate and glycocholate. (B) Heat map display of BA profile for fibrosis stage F0-F1 vs. F≥2 with orange/reds indicating larger and blue/greens as smaller measurements. The green color on side bar along the left side of the heat map indicates p<0.05. For panels C–E, the probability of F≥2 was significantly higher on nominal logistic regression with increasing (C) glycocholate, (D) taurocholate, and (E) conjugated cholate. (F) Increasing total secondary to primary BAs ratio had lower likelihood of F≥2 fibrosis. The BA levels were measured against known internal standards in global metabolomics profile and provides a relative quantitative measure of the BAs relative to the library standards across samples.
Figure 8
Figure 8. Summary of changes in plasma bile acid profile in NASH
BA, Bile acid; CA, cholate; CDCA; chenodeoxycholate; DCA, deoxycholate; GCA, glycocholate; GCDCA, glycochenodeoxycholate; GDCA, glycodeoxycholate; GLCA, glycolithocholate; TCA, taurocholate; TCDCA, taurochenodeoxycholate; TDCA, taurodeoxycholate; TLCA, taurolithocholate; NASH, nonalcoholic steatohepatitis; 2°/1°, secondary to primary. ↑, significantly increased; ↓, significantly decreased; ↔ no significant change.

Comment in

References

    1. Rinella ME. Nonalcoholic fatty liver disease: a systematic review. JAMA. 2015;313:2263–2273. - PubMed
    1. Matteoni CA, Younossi ZM, Gramlich T, Boparai N, Liu YC, McCullough AJ. Nonalcoholic fatty liver disease: a spectrum of clinical and pathological severity. Gastroenterology. 1999;116:1413–1419. - PubMed
    1. Wong RJ, Aguilar M, Cheung R, Perumpail RB, Harrison SA, Younossi ZM, Ahmed A. Nonalcoholic steatohepatitis is the second leading etiology of liver disease among adults awaiting liver transplantation in the United States. Gastroenterology. 2015;148:547–555. - PubMed
    1. White DL, Kanwal F, El-Serag HB. Association between nonalcoholic fatty liver disease and risk for hepatocellular cancer, based on systematic review. Clin Gastroenterol Hepatol. 2012;10:1342–1359 e1342. - PMC - PubMed
    1. Ridlon JM, Kang DJ, Hylemon PB. Bile salt biotransformations by human intestinal bacteria. J Lipid Res. 2006;47:241–259. - PubMed

Publication types

Substances