. 2017 Sep 7;7(9):2945-2956.
doi: 10.1534/g3.117.043331.

Functional Profiling of Transcription Factor Genes in Neurospora crassa

Affiliations

Functional Profiling of Transcription Factor Genes in Neurospora crassa

Alexander J Carrillo et al. G3 (Bethesda). .

Abstract

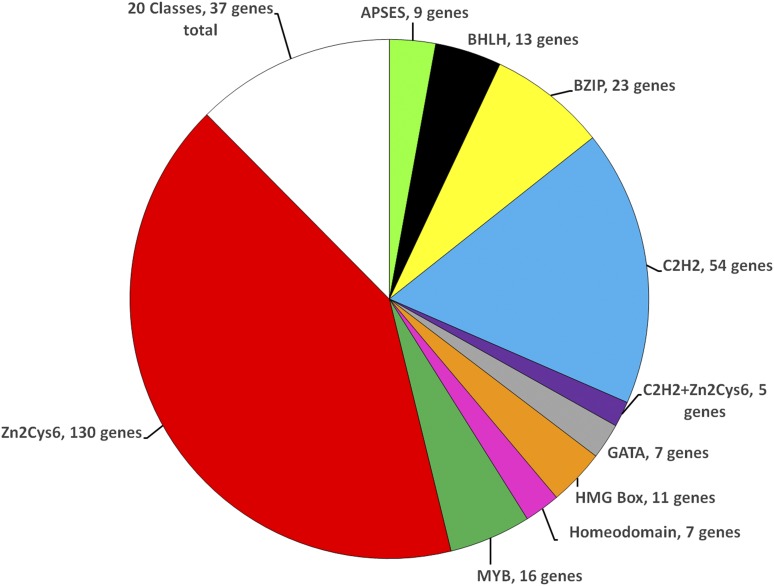
Regulation of gene expression by DNA-binding transcription factors is essential for proper control of growth and development in all organisms. In this study, we annotate and characterize growth and developmental phenotypes for transcription factor genes in the model filamentous fungus Neurospora crassa We identified 312 transcription factor genes, corresponding to 3.2% of the protein coding genes in the genome. The largest class was the fungal-specific Zn2Cys6 (C6) binuclear cluster, with 135 members, followed by the highly conserved C2H2 zinc finger group, with 61 genes. Viable knockout mutants were produced for 273 genes, and complete growth and developmental phenotypic data are available for 242 strains, with 64% possessing at least one defect. The most prominent defect observed was in growth of basal hyphae (43% of mutants analyzed), followed by asexual sporulation (38%), and the various stages of sexual development (19%). Two growth or developmental defects were observed for 21% of the mutants, while 8% were defective in all three major phenotypes tested. Analysis of available mRNA expression data for a time course of sexual development revealed mutants with sexual phenotypes that correlate with transcription factor transcript abundance in wild type. Inspection of this data also implicated cryptic roles in sexual development for several cotranscribed transcription factor genes that do not produce a phenotype when mutated.

Keywords: filamentous fungi; functional genomics; gene knockouts; transcription factors; transcriptional profiling.


Figures

Figure 1
Figure 1
Relative distribution of N. crassa transcription factor genes into major classes. Each “slice” of the pie represents the fraction of mutants with the indicated domain. The number of mutants with each domain is indicated. The MISC (Miscellaneous) group includes the 20 domain classes with four or fewer members (see Table 1).
Figure 2
Figure 2
Venn diagram summary of mutants with growth and developmental phenotypes. The total number of mutants with the indicated phenotype or combination of phenotypes is shown in each lobe of the Venn diagram.
Figure 3
Figure 3
Basal hyphae growth rate and aerial hyphae height phenotypes for mutants in different transcription factor classes. (A) Basal hyphae growth rate. Race tubes containing VM agar medium were inoculated with transcription factor mutants and incubated in the dark at 25°. The growth front was marked after overnight growth (t = 0), and then marked twice/day over the course of 2–3 d. Growth rate was determined using linear regression analysis (see Materials and Methods for details). Mutants were grouped in bins, as shown. The range of measurements for wild type is indicated on the x-axis. (B) Aerial hyphae height. Standing liquid VM tube cultures were inoculated with mutants and incubated statically for 3 d in the dark at 25°, after which the height of aerial hyphae was measured. Values were obtained using at least six replicates and are presented as described in (A). (C) Comparison between aerial hyphae height and basal hyphae growth rate for all mutants. The data from (A) and (B) were plotted. Mutants that fall within the range of wild type values are enclosed by the dashed-line rectangle.
Figure 4
Figure 4
Transcription factor mutants with defects in sexual development. (A) Summary of sexual cycle phenotypes. The total number of mutants with the indicated sexual cycle phenotype is shown in each lobe of the Venn diagram. Mutants with reduced number or abnormal phenotypes (red font) or complete block (black font) are scored according to the stage of their earliest defect. (B) Examples of mutants with different sexual cycle phenotypes. All strains were cultured on synthetic crossing medium plates in constant light at room temperature for 7 d to facilitate development of protoperithecia (top panels). Cultures were then fertilized using macroconidia from a wild-type strain of opposite mating type. Plates were then incubated under the same conditions for a further 7 d to allow production of fertilized perithecia and beak development (bottom panels). Images of protoperithecia were captured using an Olympus SZX9 stereomicroscope with a C-4040 digital camera, while perithecia were photographed using a S8APO stereomicroscope with a DFC280 digital camera. White arrows indicate unfertilized protoperithecia (top panels), while black arrows show protoperithecia (fmf-1) or perithecia (wild type and vsd-5 mutant) 7 d after fertilization (bottom panels). The beak at the tip of a perithecium can be seen as the darkened circular area above the black arrow in wild type (bottom left panel), while vsd-5 mutant perithecia lack this structure (bottom right panel). (C) Clustering of mRNA expression data for N. crassa transcription factors during a time course of sexual development. Left side of figure: RNAseq data were obtained from Wang et al. (2014). Expression data for 43 of the 47 transcription factor genes with a sexual cycle phenotype were contained in the data set. Clustering analysis and heatmap generation were performed as described in the Materials and Methods. Red shading denotes greater levels of expression, while blue indicates lower expression. The numbers along the left side of the figure indicate groupings (1–6) based on similar patterns of expression during sexual development. The table on the right side of the figure is a phenotype summary for the mutants lacking each transcription factor. The open circles denote that the indicated structure is abnormal or that a reduced number is formed, while closed circles show that the indicated structure is not formed. The absence of a circle indicates there was no defect observed. PP, Protoperithecia; P, Perithecia; A, Ascospores.

References

    1. Ahmed Y. L., Gerke J., Park H. S., Bayram O., Neumann P., et al. , 2013. The velvet family of fungal regulators contains a DNA-binding domain structurally similar to NF-kappaB. PLoS Biol. 11: e1001750. - PMC - PubMed
    1. Altschul S. F., Gish W., Miller W., Myers E. W., Lipman D. J., 1990. Basic local alignment search tool. J. Mol. Biol. 215: 403–410. - PubMed
    1. Aramayo R., Peleg Y., Addison R., Metzenberg R., 1996. Asm-1+, a Neurospora crassa gene related to transcriptional regulators of fungal development. Genetics 144: 991–1003. - PMC - PubMed
    1. Aravind L., Anantharaman V., Balaji S., Babu M. M., Iyer L. M., 2005. The many faces of the helix-turn-helix domain: transcription regulation and beyond. FEMS Microbiol. Rev. 29: 231–262. - PubMed
    1. Bailey L. A., Ebbole D. J., 1998. The fluffy gene of Neurospora crassa encodes a Gal4p-type C6 zinc cluster protein required for conidial development. Genetics 148: 1813–1820. - PMC - PubMed