. 2017 Sep;18(9):622-632.
doi: 10.1111/tra.12502.

Transport of the alpha subunit of the voltage gated L-type calcium channel through the sarcoplasmic reticulum occurs prior to localization to triads and requires the beta subunit but not Stac3 in skeletal muscles

Affiliations

Transport of the alpha subunit of the voltage gated L-type calcium channel through the sarcoplasmic reticulum occurs prior to localization to triads and requires the beta subunit but not Stac3 in skeletal muscles

Jeremy W Linsley et al. Traffic. 2017 Sep.

Abstract

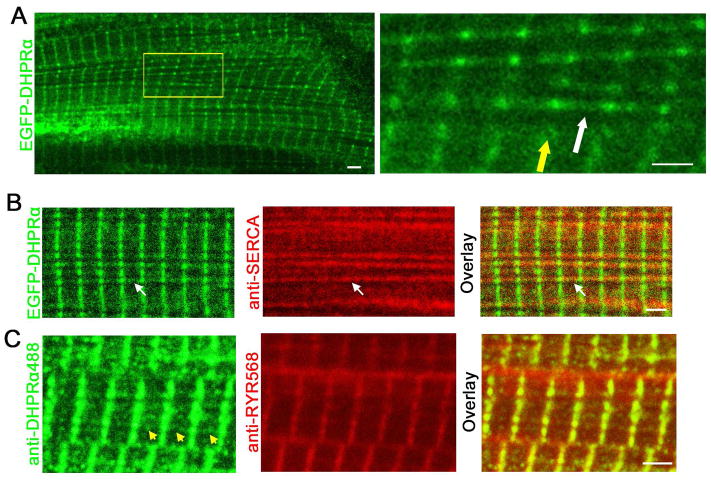
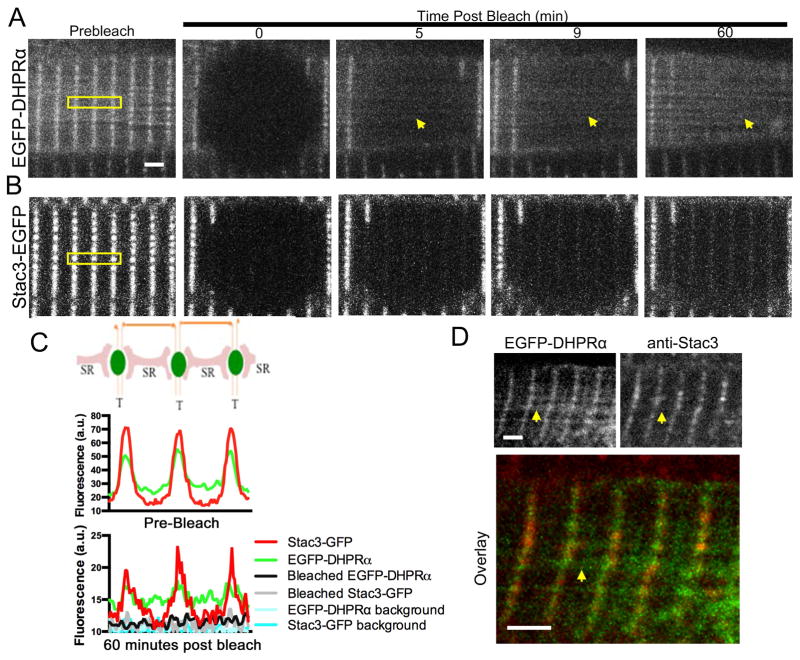
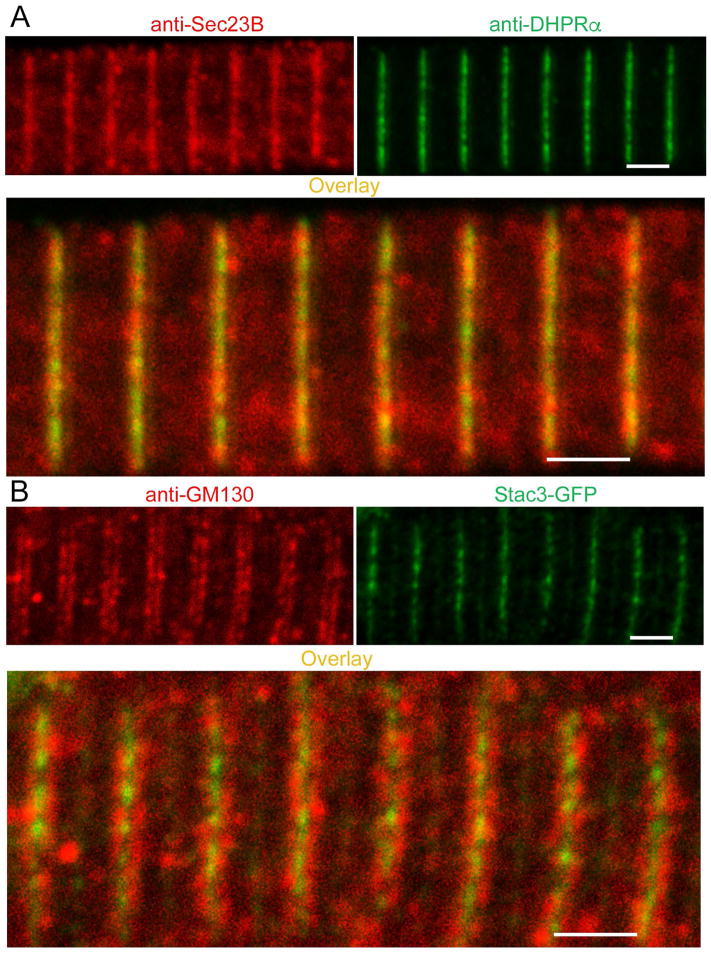
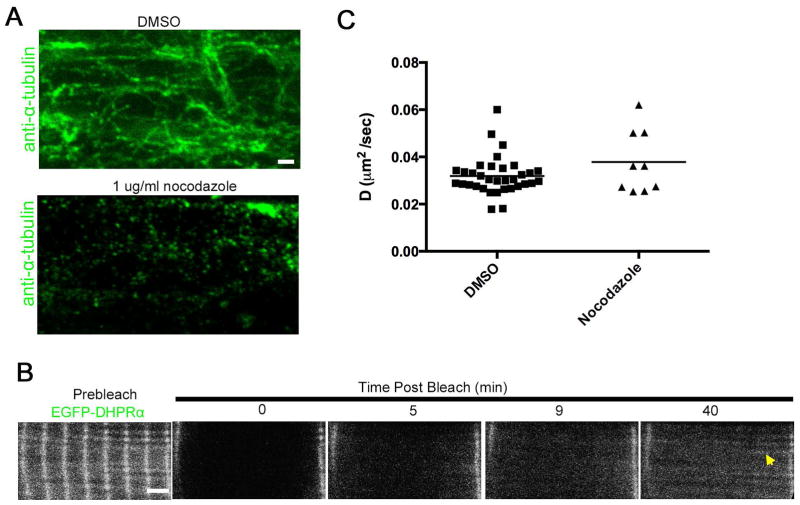
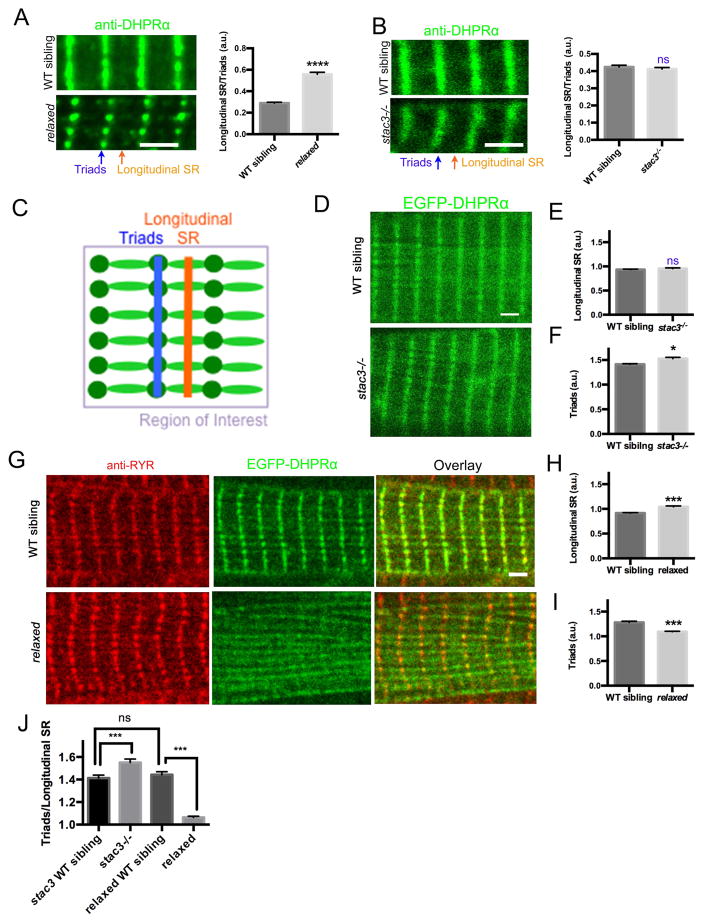
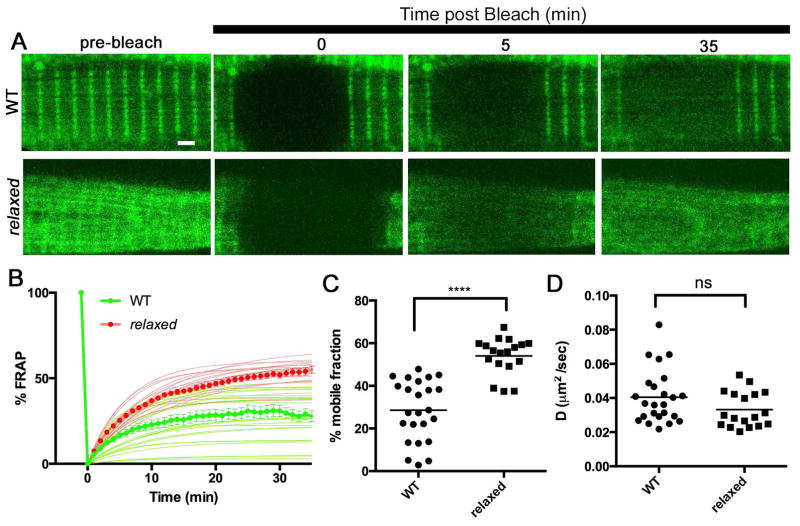
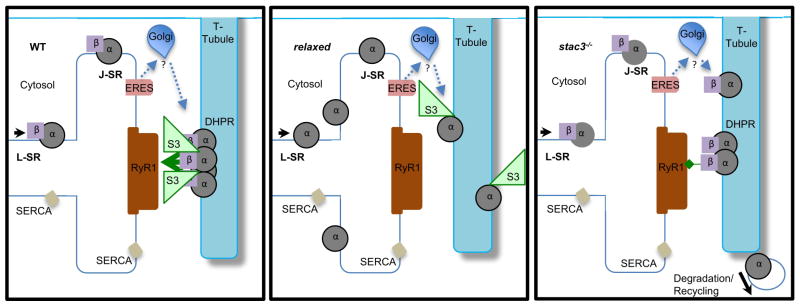
Contraction of skeletal muscle is initiated by excitation-contraction (EC) coupling during which membrane voltage is transduced to intracellular Ca2+ release. EC coupling requires L-type voltage gated Ca2+ channels (the dihydropyridine receptor or DHPR) located at triads, which are junctions between the transverse (T) tubule and sarcoplasmic reticulum (SR) membranes, that sense membrane depolarization in the T tubule membrane. Reduced EC coupling is associated with ageing, and disruptions of EC coupling result in congenital myopathies for which there are few therapies. The precise localization of DHPRs to triads is critical for EC coupling, yet trafficking of the DHPR to triads is not well understood. Using dynamic imaging of zebrafish muscle fibers, we find that DHPR is transported along the longitudinal SR in a microtubule-independent mechanism. Furthermore, transport of DHPR in the SR membrane is differentially affected in null mutants of Stac3 or DHPRβ, two essential components of EC coupling. These findings reveal previously unappreciated features of DHPR motility within the SR prior to assembly at triads.

Keywords: DHPR; EC coupling; Stac3; calcium channel; skeletal muscle; trafficking; zebrafish.


Conflict of interest statement

Competing interests

The authors have no competing interests associated with the research reported in this study.

Figures

Figure 1
Figure 1. A fraction of DHPR localizes in longitudinal SR
(A) (Left) WT muscle fiber from wholemounted 48hpf embryos expressing EGFP-DHPRα shows both vertical (t-tubule) and horizontal striations. (Right) Blow up of inset shows triadic punctae that form vertical triadic striations (yellow arrow) and are connected by faint horizontal longitudinal striations of EGFP-DHPRα (white arrow). (B) WT muscle fiber expressing EGFP-DHPRα showing co-localization with anti-SERCA, which labels the longitudinal SR between triadic striations (white arrow). (C) WT muscle fiber from wholemounted 48hpf embryos showing anti-DHPRα-alexa488 labeling at longitudinal SR (yellow arrows) between triads, and anti-panRYR-alexa568 labeling at triads. Each image is representative of at least six images taken. (Scale bars, 2μm)
Figure 2
Figure 2. DHPR traffics via longitudinal SR independently of Stac3
(A) Time-lapse Time course for fluorescence recovery after photobleaching (FRAP) analysis of a WT 72hpf muscle fiber expressing EGFP-DHPRα or Stac3-EGFP (B) before bleaching and 0, 5, 9, and 60 min post-bleaching. Arrows indicate EGFP-DHPRα in the longitudinal SR during recovery, in contrast to absence in Stac3-EGFP in the longitudinal SR during recovery. (C) Quantification of EGFP-DHPRα and Stac3-EGFP fluorescence in the longitudinal SR and triads within the boxes in (A) and (B) showing that EGFP-DHPR fluorescence is associated with both the longitudinal SR and at higher levels at triads. Stac3-EGFP fluorescence is primarily associated with triads before and after bleaching. 60 min after bleaching EGFP-DHPRα fluorescence localizes to the longitudinal SR and triads but Stac3-EGFP fluorescence is restricted to triads. (Top) A cartoon depicting the arrangement of SR and t-tubule that correspond to the quantified fluorescence. (D) WT muscle fiber expressing EGFP-DHPRα from a wholemount embryo (48hpf) showing lack of co-localization (arrows) with anti-Stac3 at longitudinal lines between triads (arrows). (E) WT muscle fiber co-immunolabeled with anti-sec23b, a marker for ER exit sites and anti-DHPRα (mAb1). Each image is representative of at least six images taken. (Scale bars, 2μm)
Figure 3
Figure 3. ER exit sites and Golgi outposts localize to triads
(A) WT muscle fiber co-labeled with anti-DHPRα (left) and anti-sec23B (middle) which labels ERES, showing co-localization at T tubules. (B) Whole-mount immunolabeling of transgenic muscle actin:stac3-EGFP muscle fiber showing anti-GM130 labeling flanks T tubules. (Scale bars, 2μm)
Figure 4
Figure 4. DHPR trafficking along longitudinal SR is not microtubule dependent
(A) Whole-mount immunolabeling of skeletal muscle in 72hpf embryos with anti-α-tubulin after 24 hours incubation with either DMSO (left) or 1ug/ul nocodazole (right) showing that microtubules are depolymerized by nocodazole. (Scale bar, 1μm) (B) Time-lapse FRAP analysis of myofiber from a 72hpf zebrafish expressing EGFP-DHPRα after incubation in 1 μg/ml nocodazole for 24 hours. Yellow arrow indicates EGFP-DHPRα recovery in a longitudinal striation. (Scale bar, 2μm) (C) Diffusion rate of EGFP-DHPRα in embryos treated with nocodazole (n=9) is not different than those treated with DMSO alone for 24 hours (n = 34) (T test p = 0.1).
Figure 5
Figure 5. EC coupling component mutations differentially affect longitudinal SR trafficking
(A) WT sibling and relaxed mutant muscle fibers labeled with anti-DHPRα (left) and quantification of the ratio of the signal at the longitudinal SR (orange arrow) to the triad (blue arrow) (right) showing increased DHPRα at the longitudinal SR in relaxed mutants (n = 68) compared to WT siblings (n = 86; T test p<0.0001). (B) WT sibling and stac3−/− mutant muscle fibers labeled with anti-DHPRα (left) and quantification of the ratio of the signal at the longitudinal SR (orange arrow) to the triad (blue arrow) (right) showing DHPRα levels in longitudinal SR are the same in stac3−/− mutants (n = 127) as in WT siblings (n = 126; t test ns p = 0.39). (C) Cartoon depicting quantification of mean fluorescence at triads and longitudinal SR as well as the calculation of the triad/longitudinal SR ratio. (D) WT sibling (top) and stac3−/− muscle fibers expressing EGFP-DHPRα. (E) EGFP-DHPRα expression in the triads is elevated in stac3−/− (n = 111) compared to WT siblings (n = 104; Mann-Whitney p<0.05). (F) EGFP-DHPRα expression in inter-striations is the same in stac3−/− (n = 111) as WT siblings (n = 104; Mann-Whitney p = 0.36). (G) relaxed mutant muscle fiber expressing EGFP-DHPRα shows less co-localization at the triadic junction with RyR and more in longitudinal SR trafficking. (H) relaxed mutant muscle fiber expressing EGFP-DHPRα (n = 114) have reduced EGFP-DHPRα in striations compared to WT siblings (n = 112; Mann Whitney p<0.0001). (I) relaxed mutant muscle fiber expressing EGFP-DHPRα (n= 114) have increased EGFP-DHPRα in inter-striations compared to WT siblings (n = 112; Mann Whitney p<0.0001). (H) Striation to inter-striation ratio of WT siblings of relaxed mutants (n = 96) is not different from WT siblings of stac3−/− mutants (n = 134; ANOVA Tukey’s ns). stac3−/− mutants (n = 103) have significantly increased striation to inter-striation ratio compared to stac3−/− WT siblings (ANOVA Tukey’s p<0.0001). relaxed mutants (n = 163) have a significantly lower striation to inter-striation ratio compared to relaxed WT siblings (ANOVA Tukey’s p<0.0001). (Scale bars, 2μm)
Figure 6
Figure 6. DHPRα in relaxed mutants has an increased mobile fraction
(A) Time course for FRAP of EGFP-DHPRα expressed in WT (top) and relaxed (bottom) myofibers. Shown are EGFP-DHPRα before (prebleach), after photobleaching (T=0, 5, 35 min). (B) Mean quantification of time course of FRAP in WT (thick green line and circles) and relaxed (thick red line and circles). Thin lines represent non-linear regressions from individual traces of FRAPs from WT (green) and relaxed (red). Vertical thick green line depicts bleaching. (C) Histogram showing % mobile fraction of EGFP-DHPRα is significantly higher in relaxed (n = 18) versus WT (n= 24; T test p<0.0001). (D) Histogram showing that the diffusion rate of EGFP-DHPRα is not different in relaxed (n = 18) versus WT (n = 24, ns, p = 0.1). Mean is depicted by horizontal bars in all histograms. (Scale bar, 2μm)
Figure 7
Figure 7. Differential effects on DHPRα trafficking of stac3−/− and relaxed mutations
(Left) In a wild type myofiber, DHPRβ traffics with DHPRα via longitudinal SR (black arrowhead) to junctional SR where it is translocated to the T-tubule membrane by an unknown mechanism (blue arrows) that may involve triad-localized ER exit sites (ERES) and/or Golgi outposts, resulting in DHPR-RYR coupling. Stac3 acts on DHPR only at the triadic junction. (Middle) In relaxed mutant embryos, DHPRα traffics via longitudinal SR (black arrowhead), but translocation to the T-tubule membrane is limited (blue arrows), resulting in accumulation of DHPRα in the longitudinal SR and reduced DHPR in the triadic junction. (Right) In stac3−/− mutant embryos, DHPRα traffics via SR (black arrowhead) and translocates to the T-tubule membrane (blue arrows) but is unstable and removed from the triad, entering the degradation pathway (black arrow). Overexpression of EGFP-DHPRα in stac3−/− creates a bottleneck in the degradation/recycling machinery, resulting in increased EGFP-DHPRα in the triad. α = DHPRα, β= DHPRβ, S3 = Stac3, RyR1 = Ryanodine Receptor 1, L-SR = longitudinal sarcoplasmic reticulum, J-SR= junctional sarcoplasmic reticulum.

Similar articles

Cited by

References

    1. Block BA, Imagawa T, Campbell KP, Franzini-Armstrong C. Structural evidence for direct interaction between the molecular components of the transverse tubule/sarcoplasmic reticulum junction in skeletal muscle. The Journal of cell biology. 1988;107(6 Pt 2):2587–2600. - PMC - PubMed
    1. Paolini C, Fessenden JD, Pessah IN, Franzini-Armstrong C. Evidence for conformational coupling between two calcium channels. Proceedings of the National Academy of Sciences of the United States of America. 2004;101(34):12748–12752. - PMC - PubMed
    1. Schneider MF, Chandler WK. Voltage dependent charge movement of skeletal muscle: a possible step in excitation-contraction coupling. Nature. 1973;242(5395):244–246. - PubMed
    1. Rios E, Brum G. Involvement of dihydropyridine receptors in excitation-contraction coupling in skeletal muscle. Nature. 1987;325(6106):717–720. - PubMed
    1. Bannister RA. Bridging the myoplasmic gap II: more recent advances in skeletal muscle excitation-contraction coupling. The Journal of experimental biology. 2016;219(Pt 2):175–182. - PubMed

Publication types

MeSH terms