. 2017 Jul 10;42(1):37-51.e8.
doi: 10.1016/j.devcel.2017.06.011.

A Tubulin Binding Switch Underlies Kip3/Kinesin-8 Depolymerase Activity

Affiliations

A Tubulin Binding Switch Underlies Kip3/Kinesin-8 Depolymerase Activity

Hugo Arellano-Santoyo et al. Dev Cell. .

Abstract

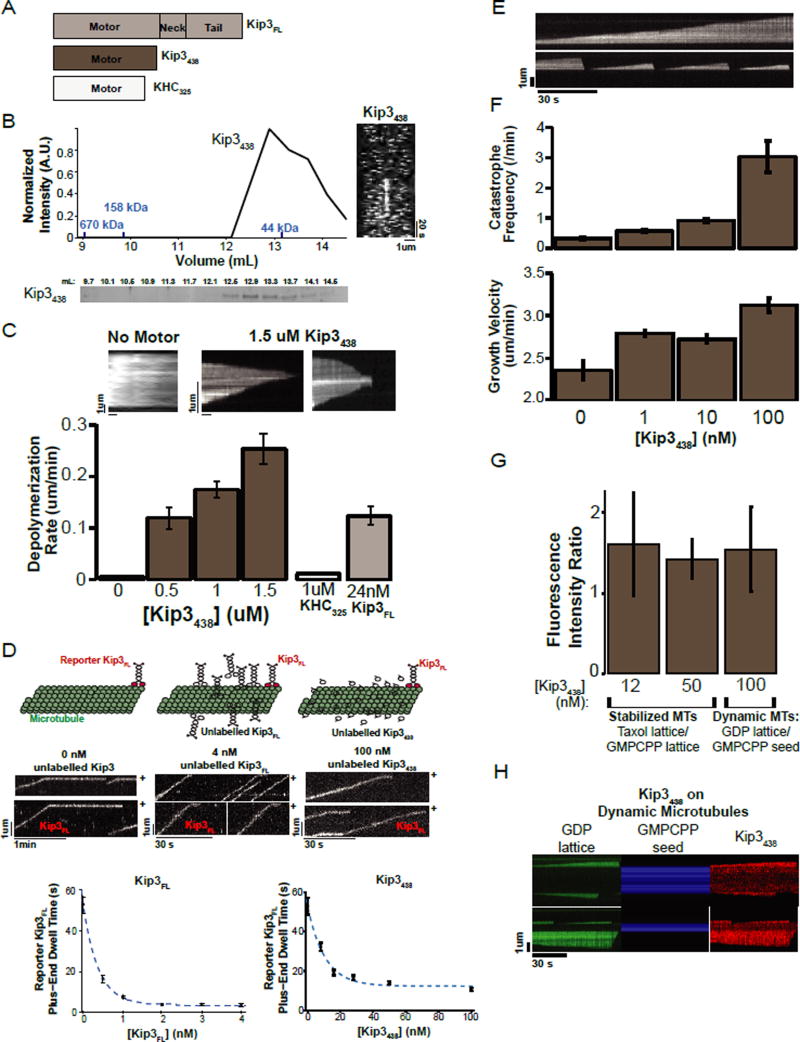
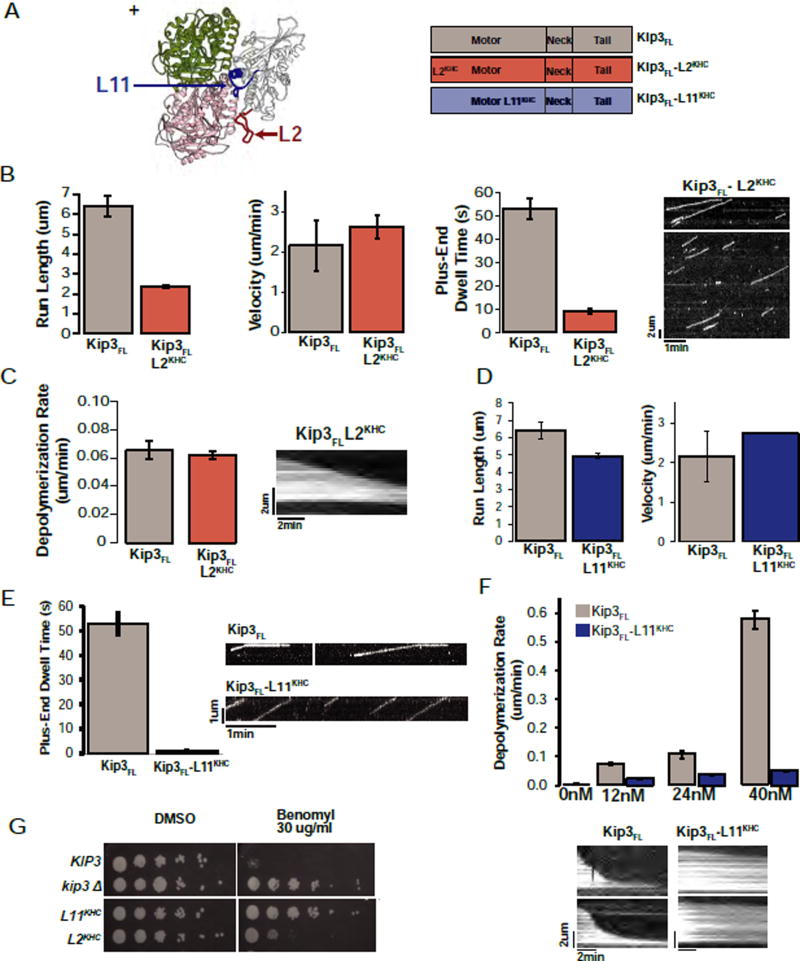
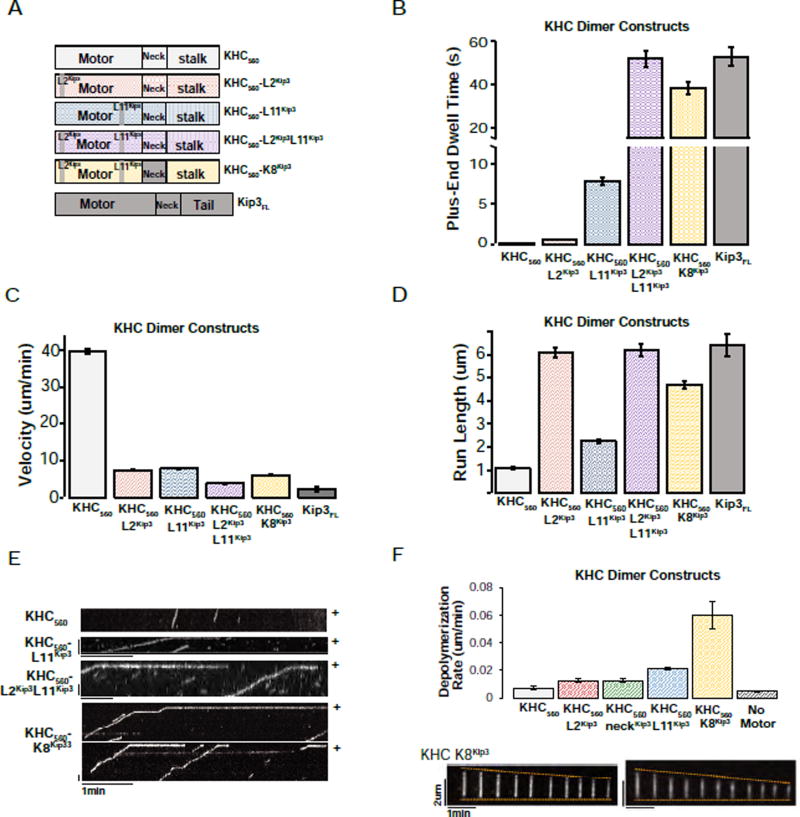
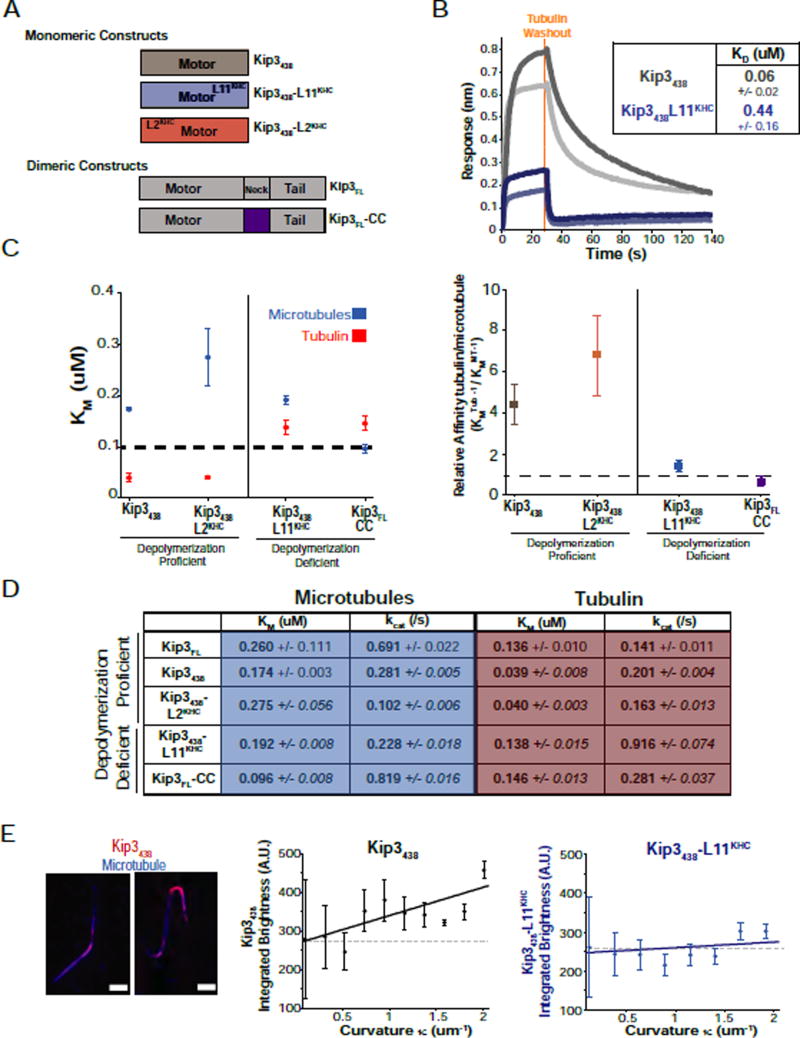
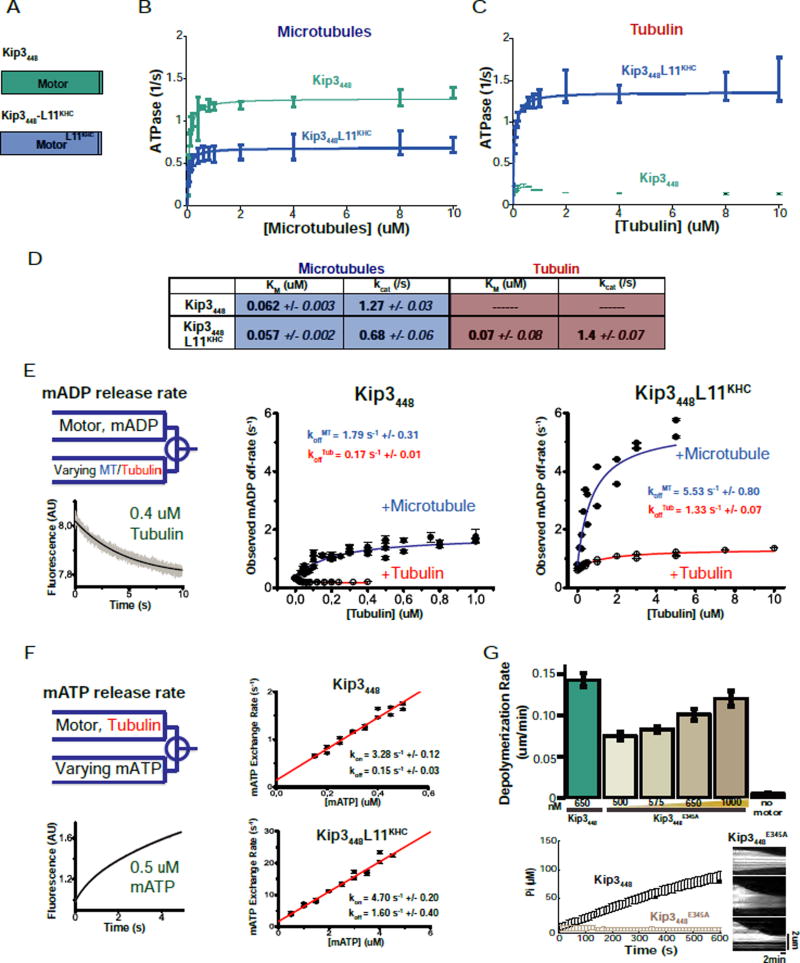
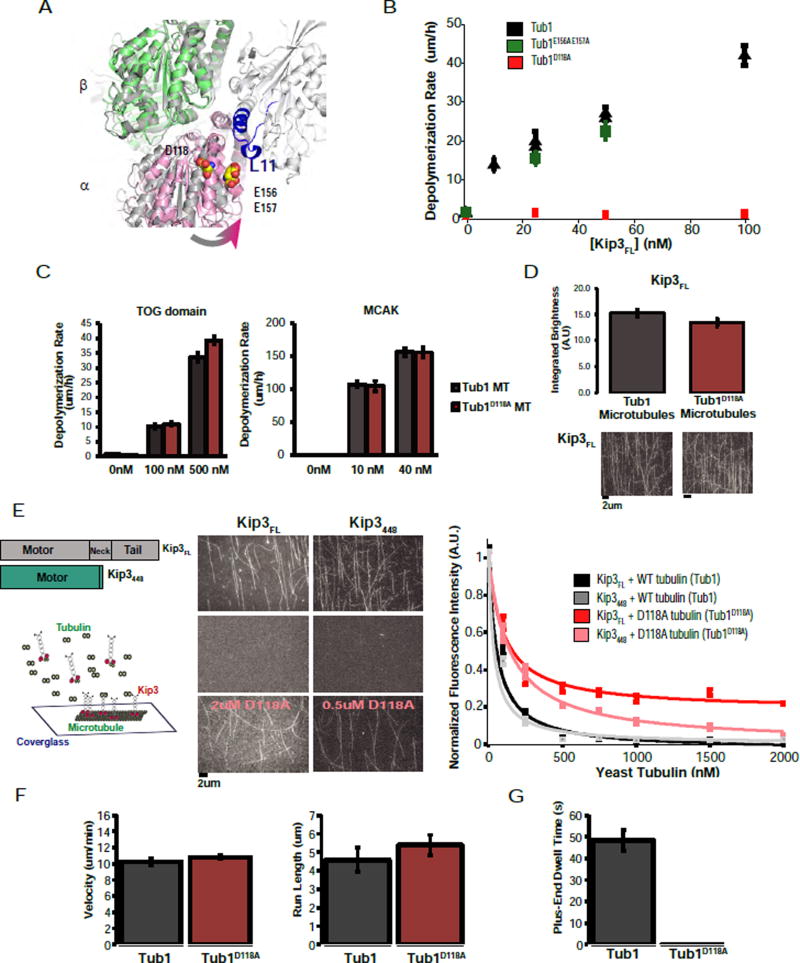
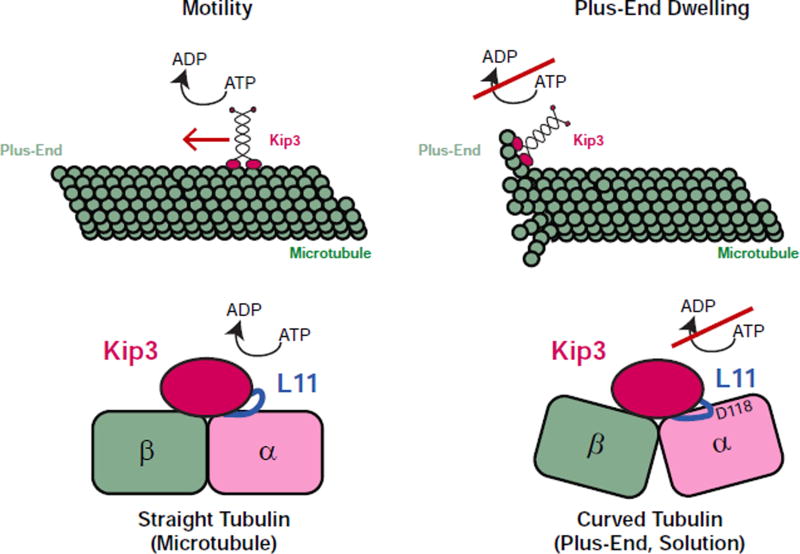
Kinesin-8 motors regulate the size of microtubule structures, using length-dependent accumulation at the plus end to preferentially disassemble long microtubules. Despite extensive study, the kinesin-8 depolymerase mechanism remains under debate. Here, we provide evidence for an alternative, tubulin curvature-sensing model of microtubule depolymerization by the budding yeast kinesin-8, Kip3. Kinesin-8/Kip3 uses ATP hydrolysis, like other kinesins, for stepping on the microtubule lattice, but at the plus end Kip3 undergoes a switch: its ATPase activity is suppressed when it binds tightly to the curved conformation of tubulin. This prolongs plus-end binding, stabilizes protofilament curvature, and ultimately promotes microtubule disassembly. The tubulin curvature-sensing model is supported by our identification of Kip3 structural elements necessary and sufficient for plus-end binding and depolymerase activity, as well as by the identification of an α-tubulin residue specifically required for the Kip3-curved tubulin interaction. Together, these findings elucidate a major regulatory mechanism controlling the size of cellular microtubule structures.

Keywords: depolymerization; kinesins; microtubule associated proteins; microtubule dynamics; spindle scaling.


Figures

Figure 1
Figure 1. Motility is not required for Kip3 depolymerase activity
A. Diagrams of the Kip3FL, Kip3438 and KHC325 constructs. Subscripts denote last residue of the protein construct. FL=Full length. B. Kip3438 is monomeric and non-motile. Representative S200 gel filtration elution profile for Kip3438. The graph shows the intensity of the coomassie-stained elution fractions (normalized to the maximum, n= 3 runs). In blue are molecular weights of protein standards. The molecular weight of Kip3438, calculated from its sequence, is 74.6 KDa. Right: Representative kymograph of fluorescently labelled Kip3438 on taxol-stabilized microtubules showing that Kip3438 lacks motility (n=17 experiments). Scale bar: 1um (horizontal), 20s (vertical). C. Concentration-dependent depolymerization of GMPCPP-stabilized microtubules by monomeric Kip3438. Top: kymographs showing GMPCPP-stabilized microtubules over time in the absence (control) or in the presence of 1.5 uM Kip3438. Scale bar: 1um (vertical), 1 min (horizontal). Bottom: Quantification of GMPCPP-stabilized microtubule depolymerization rates (mean +/− SEM (standard error of the mean); nMT=151–278) of Kip3438. The depolymerization rate of 1uM monomeric kinesin-1 (KHC325) and 24 nM dimeric Kip3FL are shown as controls (mean +/−SEM; nMT=87, 241). D. Non-motile monomeric Kip3 can reduce the end-residence time of plus-end-bound dimeric Kip3FL. Top panel: Cartoons illustrating the experimental design. Middle: (left) Control kymograph of fluorescently labelled reporter Kip3FL (<0.05 nM Kip3FL-TMR) on taxol-stabilized microtubules. Unlabeled Kip3FL (middle) or Kip3438 (right) both decrease the plus-end dwell time of the labeled Kip3FL reporter. The microtubule plus-end is marked as (+). Scale bar: 1um (vertical), 1 min (horizontal) left kymograph (0 nM unlabeled Kip3); 30 s (horizontal) for both unlabeled Kip3FL and Kip3438 kymographs. Bottom: Left: The plus-end dwell time (mean +/− SEM; n=50–175 events) of fluorescently labelled Kip3FL is shown in the presence of spiked-in unlabeled Kip3FL (<0.05 nM Kip3FL -TMR, 0 nM to 4 nM unlabeled Kip3FL dimer). Right: The plus-end dwell time (mean +/− SEM; n=149–242 events) of fluorescently labelled Kip3FL is shown in the presence of varying concentrations of Kip3438 (<0.05 nM Kip3FL-TMR, 0 to 100 nM unlabeled Kip3438). The data points were weighted by the SEM and were fit to a single exponential (dotted blue line). E. Kymographs of dynamic microtubules illustrating Kip3438-induced catastrophes. Microtubules grown in 14 uM tubulin rarely catastrophe (top) whereas 100 nM Kip3438 increases the frequency of catastrophes (bottom. Scale bar: 2 um (vertical), 30s (horizontal). F. Microtubule catastrophe induced by varying concentrations of Kip3438. Top: The catastrophe frequency of dynamic microtubules grown (14uM tubulin) at the indicated concentrations of Kip3438 (mean +/− SE (standard error); nMT=35–273). Middle: Kip3438 subtly increases, rather than decreases, microtubule growth rates. Microtubule growth velocity as a function of Kip3438 concentration (mean +/− SE; nMT=35–273). G. No preferential binding of Kip3 to GMPCPP (GTP-like) microtubules; Kip3 instead exhibits a slight preference for the GDP lattice. Ratio of the fluorescence intensity of Kip3438 bound to taxol-stabilized microtubules (GDP-like) relative to GMPCPP-stabilized microtubules (GTP-like) at [Kip3438]: 12 nM Kip3 (N=12 flow-cells) or 50 nM Kip3 (N=6 flow-cells). For dynamic microtubules (GDP lattice), the fluorescence intensity of 100 nM Kip3438 was measured. The ratio of the intensity of Kip3438 on the microtubule lattice (GDP-like), to the GMPCPP-seed (GTP-like) is quantified in the right column (N=12 flow-cells). (Mean+/−SE). In all assays, the ends of microtubules (600 nm from end) were excluded from quantification. H. Kymographs illustrating the preferential binding of Kip3 to the GDP microtubule lattice. Dynamic microtubules were grown at 14 uM tubulin (green, left) from GMPCPP seeds (blue, middle). The fluorescence intensity of Kip3438 on the GDP-lattice and the GMPCPP seed (red, right) was imaged under TIRF microscopy and quantified as show in G.
Figure 2
Figure 2. Structural elements required for Kip3 microtubule depolymerase activity
A. Homology model of Kip3 bound to tubulin based on the human Kif18A structure (3LRE). β-tubulin is shown in dark green (marked +) and α-tubulin in pink (4LNU). Loop2 is in red, Loop11 in blue. Right: diagrams of the Kip3FL, Kip3FL-L2KHC and Kip3FL-L11KHC constructs. Superscripts denote the origin of the swapped region. B. L2 is required for Kip3 processivity. Quantification of the motility (run-length, velocity and plus-end dwell time) of Kip3FL and Kip3FL-L2KHC on taxol-stabilized microtubules imaged by TIRF microscopy (mean +/− SEM; n=75–870 events). The kymograph illustrates the reduced plus-end dwell time and run length of the Kip3FL-L2KHC construct. Scale bar: 1 min (horizontal), 2um (vertical). C. Kip3 Loop2 is dispensable for microtubule depolymerization. Kip3FL or Kip3FL-L2KHC have comparable depolymerization rates of GMPCPP-stabilized microtubules (mean +/−SEM; nMT=96–407). Depolymerization rates are shown at concentrations of the input motors has been corrected to achieve comparable flux to the plus-end (~170 motors/min; see methods, Fig S4B, input: 12nM and 40nM respectively). Kymograph showing depolymerization of a GMPCPP-stabilized microtubule over time by Kip3FL-L2KHC as quantified above. Scale bar: 2 min (horizontal), 2um (vertical). D. The motility of Kip3FL-L11KHC is comparable to Kip3FL. Quantification of the run length (left) and velocity (right) of Kip3FL (grey) and Kip3FL -L11KHC (blue) on taxol-stabilized microtubules (mean +/− SEM; n=155–1022 events). E. Specific requirement of Kip3 Loop11 for prolonged plus-end binding. Plus-end residence time of fluorescently labelled Kip3FL and Kip3FL-L11KHC (mean +/− SEM; n=149–493 events) on taxol-stabilized microtubules. Right: Representative kymographs from single molecule assays quantified in D, E showing the motility and plus-end residence of Kip3FL and Kip3FL-L11KHC. Scale bar: 1 um (vertical), 1 min (horizontal). F. Kip3 Loop11 is required for depolymerase activity. Depolymerization rate of GMPCPP-stabilized microtubules by the indicated concentrations of Kip3FL (grey) or Kip3FL-L11KHC (dark blue, mean +/− SEM; nMT=69–439 and nMT=121–265 respectively). Bottom: Kymographs illustrating the depolymerization of GMPCPP-stabilized microtubules by Kip3FL or Kip3FL-L11KHC at 40 nM input. Scale bar: 2 um (vertical), 2 min (horizontal). G. The Loop11 sequence is required for KIP3 function. KIP3 strains are sensitive to benomyl whereas the kip3-L11KHC strain exhibits resistance comparable to the null allele (kip3Δ). kip3-L2KHC strains display intermediate benomyl resistance. L2KHC and L11KHC experiments were performed in a kip3Δ strain background. The indicated strains were spotted at 10-fold dilutions. Partial complementation by L2KHC is likely explained, at least in part, by its low steady state expression (see Fig S4A).
Figure 3
Figure 3. Kip3’s L11 is sufficient to convey plus-end binding to KHC and Kip3’s L2 is sufficient to increase the processivity of KHC
A. Domain swaps of Kip3 segments into dimeric KHC. Diagrams of the chimeric constructs used. Superscripts denote the origin of the inserted segment. B. Domain swap showing that Kip3 Loop11 is a transportable segment sufficient for prolonged plus-end binding. Kip3 and a KHC chimera containing Kip3’s L2, L11 and the family-specific neck segment (KHC560-K8Kip3) have comparable plus-end residence times. Shown is the end-residence time (mean +/− SEM; n=149–394 events) of the indicated KHC variant constructs compared to unmodified KHC560 and Kip3FL. The superscript denotes the origin of the indicated loop that was grafted into KHC560. C. Either Kip3 L2 or L11 reduce the velocity of KHC560. The velocity (mean +/− SEM; n=155–795 events) of KHC560, KHC chimeras and Kip3 on taxol-stabilized microtubules. D. Kip3 and a KHC chimera containing Kip3’s L2, L11 and family-specific neck segment (KHC560-K8Kip3) have comparable run lengths (mean +/− SEM; n=155–795 events.) E. Representative kymographs from single molecule assays illustrating the motility and plus-end residence of KHC560 and KHC560 variant motor constructs. Scale bar: 1 min (horizontal), 1 um (vertical). F. KHC-K8Kip3 is a synthetic microtubule depolymerase. Depolymerization rate of GMPCPP-stabilized microtubules by the indicated kinesin-1 chimeras (120nM, mean +/− SEM; nMT=72–278). The KHC560-NeckKip3 construct has a velocity of 7.4 +/− 0.1 um/min and a run length of 1.2 +/− 0.1 (n=547), similar to KHC. Bottom: GMPCPP-stabilized microtubules shown at 29s intervals after the addition of 120 nM KHC560-K8Kip3 (nMT=84). Scale bars: 2 um (vertical), 1 min (horizontal).
Figure 4
Figure 4. Strong tubulin dimer binding by depolymerase proficient Kip3 variants
A. Diagram of monomeric and dimeric Kip3 variant constructs. Superscripts denote the origin of the grafted segment. The neck in Kip3FL has been replaced with a leucine zipper (LZ, purple) in Kip3FL-CC. B. Loop11 is required for strong tubulin binding. Affinity measurements of the binding of tubulin to immobilized Kip3438. Biolayer interferometry example traces of tubulin binding to Kip3438 at 0.5 uM tubulin (light grey), 1uM tubulin (dark grey) versus Kip3438-L11KHC at 1 uM tubulin (light blue) or at 2 uM tubulin (dark blue). Dotted orange line indicates the time point of tubulin washout, allowing measurement of koff values. KD values are listed in the inset (mean +/− SE, nKip3 438=30, nKip3 438-L11KHC=28 concentrations). C. Depolymerization proficient constructs have a higher relative affinity for tubulin relative to microtubules. Left: Michaelis-Menten constants for microtubules (blue) or tubulin (red) for Kip3438, Kip3438-L2KHC, Kip3438-L11KHC and Kip3-CC (KM, uM, mean +/− SEM, n=3–4 curves). KM values are from steady-state ATPase assays shown in D. ATPase curves are shown in Fig. S5. A line at 100 nM is drawn for visualization of the results. Right: Relative affinity of the constructs for tubulin over the microtubule shown as (KMTubulin)−1 / (KMMicrotubule)−1. D. Values from steady state ATPase assays of the indicated Kip3 constructs with microtubules or free tubulin as substrate (0–10 uM). Shown are mean +/− SEM; n=3−4 curves. Raw data and fits are presented in Fig. S5. E. Preferential binding of Kip3438 to regions of higher curvature on bent microtubules. Left: Representative images of fluorescently labelled Kip3438 bound to taxol-stabilized microtubules bent under flow. Scale bar: 2 um. Integrated brightness for Kip3438 (middle, black, nMT=138) or Kip3438-L11KHC (right, blue, nMT=528) plotted against the local curvature (κ) of the microtubule (mean +/− SE). Solid lines are linear fits to the data with slope mKip3438=68.4 AU/um−1 and mKip3438_L11KHC= 27.9 AU/um−1. Dashed lines represent a line with a slope of 0.
Figure 5
Figure 5. Kip3 Loop11 mediates tubulin-specific suppression of ATP turnover
A. Diagrams of monomeric constructs: Kip3448 and Kip3448-L11KHC. B. & C. The Kip3 Loop11 segment specifically suppresses tubulin-stimulated ATPase activity but not its microtubule stimulated ATPase activity. Steady state ATPase assays comparing Kip3448 and Kip3448-L11KHC stimulated by: taxol-stabilized microtubules (B) or tubulin (C) (mean +/− SEM; n=3–4 curves). The data was fitted to a Michaelis-Menten curve, except for the tubulin-activated ATPase curve of Kip3448 which showed concentration dependent inhibition of activity. D. Values from steady state ATPase assays with Kip3448 or Kip3448-L11KHC shown in B–C, using microtubules or free tubulin as substrate (0–10 uM). Shown are mean +/− SEM; n=3–4 curves. E. Slow tubulin-stimulated ADP release by Kip3448. mantADP-incubated Kip3448 (middle) or Kip3448-L11KHC (right) was rapidly mixed with varying concentrations of microtubules or tubulin in a stopped-flow apparatus. Left, top: scheme of the experiment. Left, bottom: Representative trace of fluorescent signal decay as mantADP unbinds the motor. Observed microtubule- and tubulin-dependent mantADP release rates are plotted for Kip3448 (middle) and Kip3448-L11KHC (right). mantADP release rates (koff) for Kip3448 and Kip3448-L11KHC in saturating microtubule (MT) or tubulin (Tub) are shown in the figure in blue and red, respectively. N=5–6 per point. The x-axis scale ([Tubulin] (uM)) for each construct was chosen as the concentration where the motor reaches a constant maximal mantADP release rate. Each construct shows different kinetics and therefore plateaus at different substrate concentrations. The reported mantADP release rate constants are derived from a fit to the curves shown here as described in the methods section. F. Tubulin binding to Kip3448 does not inhibit ATP binding. Left, top: scheme of the experiment. Left, bottom: representative trace of the fluorescent signal detected upon mixing of motor-tubulin complex with mantATP. A bi-exponential signal arises with two distinct phases. The initial fast phase corresponds to mantATP exchange to tubulin-bound (APO-state) motor. The slow phase (shown in Fig. S4G) combines ADP dissociation from tubulin-motors with mantATP exchange in the following cycle. The data were fitted to the equation: kobs=kon[mATP]+koff (see methods). The mantATP on-rate (kon) and off-rate (koff) of each construct are shown in the figure. Right, top: Kip3448, in the presence of 2.5 uM tubulin. The slow nucleotide off-rate is consistent with the slow hydrolysis turnover in ATPase assay in (C) and the slow mantADP off-rates in (E). Right, bottom: Kip3448-L11KHC, in the presence of 2.5 uM tubulin. N=5–6 per point. G. ATP hydrolysis is not required for Kip3 depolymerase activity. Shown are the depolymerization rates (mean +/− SEM; nMT=102–229) for Kip3448 or ATPase deficient Kip3448E345A. Bottom left: Control validating that Kip3448E345A lacks microtubule (1 uM)-stimulated ATPase activity (phosphate produced over time) Kip3448E345A (mean+/− SD; n=3 events per condition comparing Kip3448E345A with Kip3448); input 100 nM motor. Bottom right: Kymographs of GMPCPP-stabilized microtubules showing depolymerization by Kip3448E345A. Scale bar: 2 um (vertical), 2 min (horizontal).
Figure 6
Figure 6. An α-tubulin residue specifically required for Kip3 curved tubulin-binding and depolymerase activity
A. Structure of KHC bound to tubulin (4LNU, light grey) with Loop11 highlighted in blue. Structures of straight αβ-tubulin (3J6G, dark grey) and curved αβ-tubulin (4FFB, α in pink, β in green) are aligned using the β subunit. Selected residues on α-tubulin, D118 and E156/E157 are shown in space filling mode. These residues were chosen from a larger set of α-tubulin residues that are likely to be more proximal to Loop11 in curved tubulin relative to straight tubulin. B. D118A yeast microtubules are insensitive to depolymerization by Kip3FL. Quantification of the depolymerization rate of the Kip3FL dimer on GTPγS-stabilized yeast microtubules (black), Tub1E156A E157A microtubules (green) and Tub1D118A microtubules (red) (mean +/− SEM; n=10–30). C. Tub1D118A microtubules are depolymerized by MCAK or TOG domains at the same rate as control microtubules. Depolymerization rate of Tub1 (black) or Tub1D118A (red) GTPyS-stabilized yeast microtubules at various concentrations of Stu2 TOG domains (Left) or MCAK (right). Mean +/− SEM (nMT=20). D. Tub1D118A does not affect Kip3FL microtubule binding. Integrated fluorescence intensity of Kip3FL binding to either wild-type or Tub1D118A GTPyS-stabilized yeast microtubules; imaged under TIRF microscopy. Shown are mean +/− SEM; N=5 flow cells per condition. Bottom: representative images of Kip3FL bound to Tub1 or Tub1D118A microtubules. E. Soluble tubulin can compete for Kip3FL binding to the microtubule lattice. Left: Tubulin competition assay schematic. Middle: Representative images of 10nM Kip3 bound to microtubules at 0 nM tubulin, 2 uM tubulin and 0.5 uM, 2 uM D118A tubulin. Scale bar= 2 um. Right: Integrated fluorescence intensity of Kip3FL and Kip3448 on the microtubule lattice with or without competition from soluble tubulin. Data was normalized to fluorescence intensity at 0 nM tubulin and fit to a competition model. Shown are the mean +/−SEM, N=5 flow cells per condition. F. Kip3FL has comparable motility on control and Tub1D118A microtubules. Shown are velocity and run length measurements (mean +/− SEM; n=100 events). G. The Tub1D118A mutation abolishes Kip3FL‘s ability to dwell at the microtubule plus-end. Plus-end residence time (mean +/−SEM; n=100 events per condition) of Kip3FL on Tub1 (grey) and Tub1D118A microtubules (red). Scale bar: 5 um (vertical), 1 min (horizontal).
Figure 7
Figure 7. Two-state binding switch model for Kip3 length dependent microtubule regulation
Schematic of the two modes for Kip3 binding to tubulin: a motile kinesin and a depolymerase, binding straight (left) and curved (right) tubulin respectively. On the microtubule lattice, Kip3 uses ATP-dependent processive stepping to walk to the plus-end. Similar to other kinesins, straight tubulin in the microtubule lattice stimulates ATP hydrolysis. Binding of Kip3 to curved tubulin found at the microtubule plus-end and in solution suppresses ATPase activity, induces high affinity binding, and promotes microtubule catastrophe or the disassembly of stabilized microtubules. In the cartoon, the proximity of Kip3 L11 to the D118 residue on α-tubulin, both of which are required for the curved tubulin-selective interaction, is highlighted.

References

    1. Alonso MC, Drummond DR, Kain S, Hoeng J, Amos L, Cross RA. An ATP Gate Controls Tubulin Binding by the Tethered Head of Kinesin-1. Science. 2007;316:120–123. - PMC - PubMed
    1. Ayaz P, Ye X, Huddleston P, Brautigam CA, Rice LM. A TOG:αβ-tubulin Complex Structure Reveals Conformation-Based Mechanisms For a Microtubule Polymerase. Science. 2012;337:857–860. - PMC - PubMed
    1. Ayaz P, Munyoki S, Geyer EA, Piedra F-A, Vu ES, Bromberg R, Otwinowski Z, Grishin NV, Brautigam CA, Rice LM. A tethered delivery mechanism explains the catalytic action of a microtubule polymerase. eLife. 2014;3:e03069. - PMC - PubMed
    1. Bechstedt S, Lu K, Brouhard Gary J. Doublecortin Recognizes the Longitudinal Curvature of the Microtubule End and Lattice. Current Biology. 2014;24:2366–2375. - PubMed
    1. Brouhard GJ, Rice LM. The contribution of αβ-tubulin curvature to microtubule dynamics. The Journal of Cell Biology. 2014;207:323–334. - PMC - PubMed

LinkOut - more resources