. 2017 Jul 10;42(1):9-21.e5.
doi: 10.1016/j.devcel.2017.06.003.

DGAT1-Dependent Lipid Droplet Biogenesis Protects Mitochondrial Function during Starvation-Induced Autophagy

Affiliations

DGAT1-Dependent Lipid Droplet Biogenesis Protects Mitochondrial Function during Starvation-Induced Autophagy

Truc B Nguyen et al. Dev Cell. .

Abstract

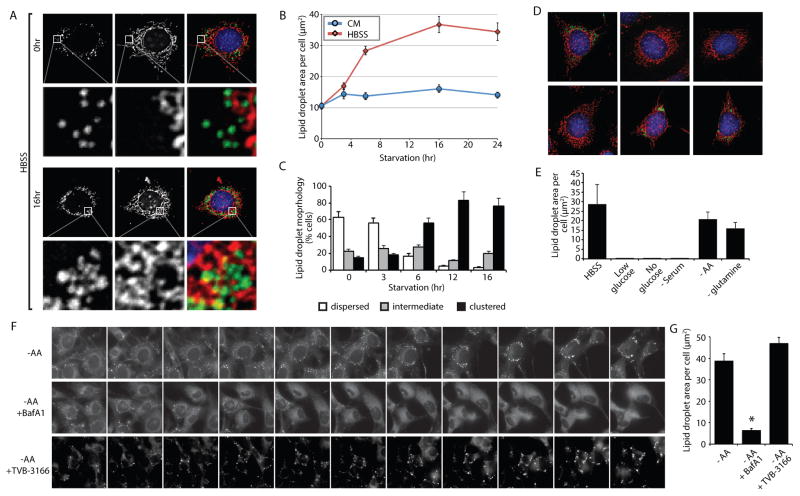
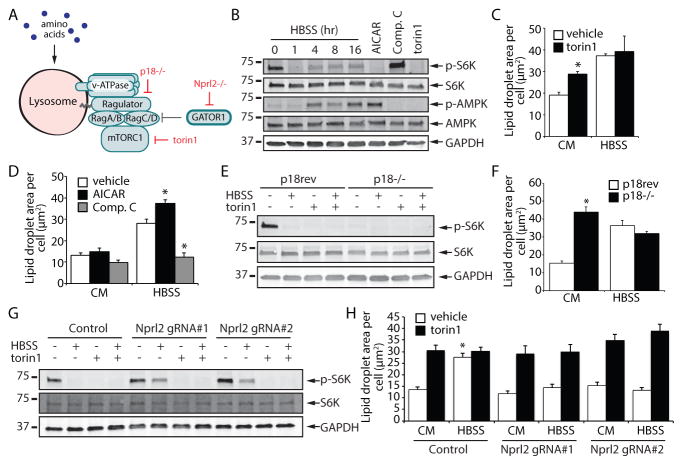
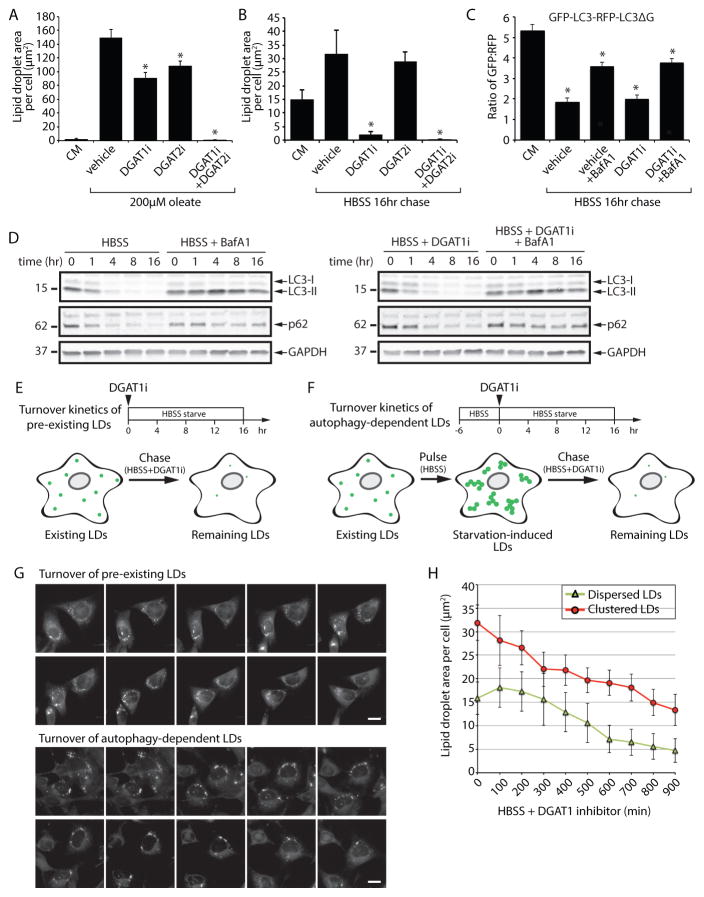
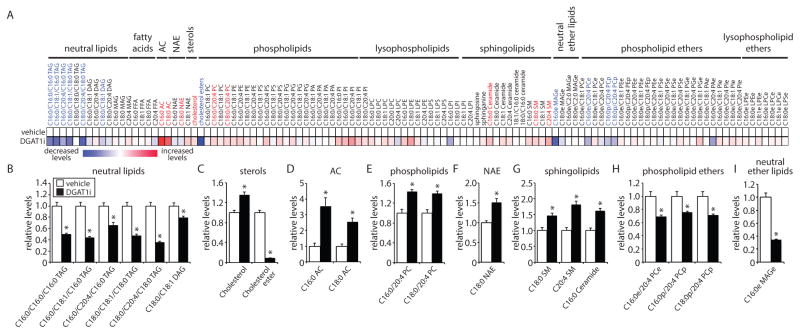
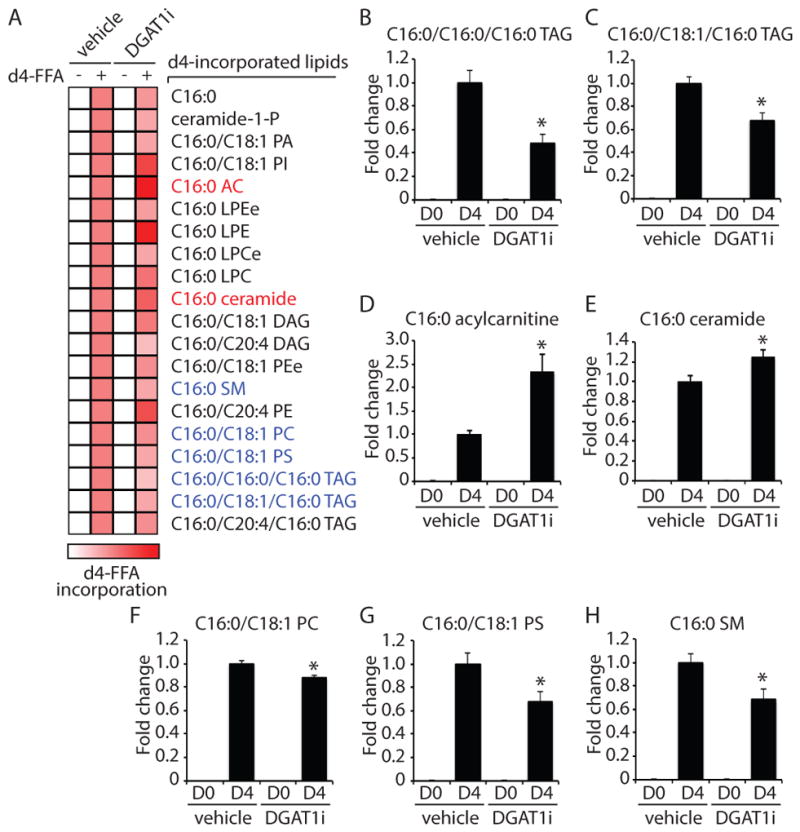
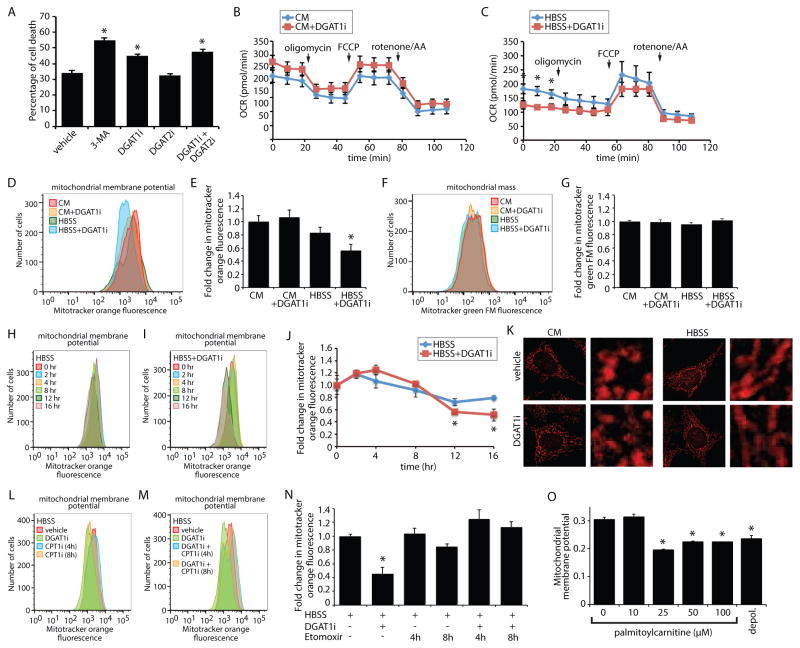
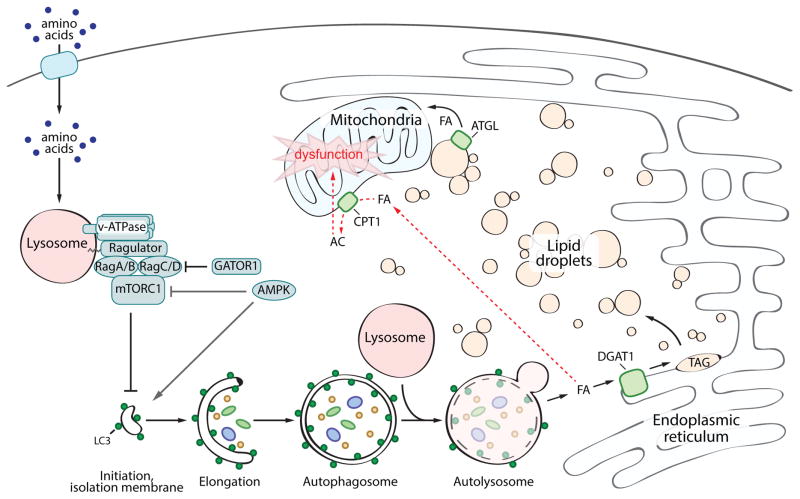
Lipid droplets (LDs) provide an "on-demand" source of fatty acids (FAs) that can be mobilized in response to fluctuations in nutrient abundance. Surprisingly, the amount of LDs increases during prolonged periods of nutrient deprivation. Why cells store FAs in LDs during an energy crisis is unknown. Our data demonstrate that mTORC1-regulated autophagy is necessary and sufficient for starvation-induced LD biogenesis. The ER-resident diacylglycerol acyltransferase 1 (DGAT1) selectively channels autophagy-liberated FAs into new, clustered LDs that are in close proximity to mitochondria and are lipolytically degraded. However, LDs are not required for FA delivery to mitochondria but instead function to prevent acylcarnitine accumulation and lipotoxic dysregulation of mitochondria. Our data support a model in which LDs provide a lipid buffering system that sequesters FAs released during the autophagic degradation of membranous organelles, reducing lipotoxicity. These findings reveal an unrecognized aspect of the cellular adaptive response to starvation, mediated by LDs.

Keywords: ATGL; DGAT1; DGAT2; autophagy; lipid droplet; lipotoxicity; mTORC1; mitochondria; starvation; triacylglycerol.


Figures

Figure 1
Figure 1. Lack of amino acids is sufficient to induce autophagy-dependent lipid droplet biogenesis
(A–C) MEFs were grown in CM or HBSS for the indicated times, fixed, and analyzed by fluorescence microscopy. (A) LDs were stained with BODIPY 493/503 (green), mitochondria with MitoTracker Orange CMTMRos (red), and nuclei with DAPI (blue). (B) The abundance of LDs was quantified during incubations in CM or HBSS. (C) The percentage of cells with dispersed, intermediate, or clustered LDs were quantified after incubating in HBSS for the indicated times. (D and E) Cells deprived of the indicated groups of nutrients for 16 hr were fixed, the distribution of LDs (green) and mitochondria (red) analyzed by fluorescence microscopy (D), and the LD area per cell quantified (E). (F) A time-lapse montage of BODIPY 493/503-stained LDs in live cells during amino acid deprivation in the presence and absence of bafilomycin A1 (BafA1) or FA synthesis inhibitor TVB-3166. (G) Quantification of LD area following a 16 hr amino acid starvation with the indicated treatments (as in panel F). All graphical data are quantified as mean ± SEM. An asterisk indicates a significant difference (p < 0.05, t test) based on n = 50 cells from three independent biological replicates. In the micrographs, white boxes indicate the magnified regions. Scale bars = 10 μm. See also Figure S1, Figure S2, Figure S3, and Movies S1–S2.
Figure 2
Figure 2. mTORC1-regulated autophagy impacts lipid droplet biogenesis during nutrient deprivation
(A) A model illustrating methods to control mTORC1 activity by using the small molecule torin1 or by deletion of the Ragulator subunit p18 or the Gator1 subunit Nprl2. (B) Immunoblot analysis of S6K and AMPK phosphorylation in MEF cells incubated in HBSS for the indicated times or treated with the designated compounds for 16 hr. (C and D) MEFs were treated as indicated for 16 hr, fixed, and LDs stained with BODIPY 493/503. Stained MEFs were imaged and the area of LDs was quantified. (E and F) p18−/− rev and p18−/− MEFs were treated as indicated for 16 hr and analyzed either by immunoblotting (E) or by quantifying LD area after fixation and staining with BODIPY 493/503 (F). (G and H) Control and Nprl2 KO MEFs were treated as indicated for 16 hr and analyzed by immunoblotting (G) or by quantifying LD area after fixation and staining with BODIPY 493/503 (H). All graphical data are quantified as mean ± SEM. An asterisk indicates a significant difference (p < 0.05, t test) based on n = 50 cells from three independent biological replicates. See also Figure S2, Figure S3, and Figure S4.
Figure 3
Figure 3. DGAT1 channels autophagy released lipids into new lipid droplets that are degraded during nutrient deprivation
(A and B) LD biogenesis was induced in MEFs by incubation with 200 μM oleate in CM (A) or by starvation in HBSS for 16 hr (B). MEFs were treated with DGAT1 and/or DGAT2 inhibitors (DGAT1i and DGAT2i) as indicated. Cells were fixed, BODIPY 493/503-stained LDs imaged by fluorescence microscopy, and the abundance of LDs quantified. (C) MEFs stably expressing a GFP-LC3-RFP-LC3ΔG autophagy flux reporter were incubated in CM or HBSS and treated with DGAT1 and/or DGAT2 inhibitors as indicated. Following a 16 hr incubation, the GFP:RFP ratio was measured by flow cytometry and the fold change in the GFP:RFP ratio quantified (n=3; mean ± SEM). (D) Immunoblot analysis of MEFs starved in HBSS and treated with vehicle, DGAT1i, and/or BafA1. (E) Illustration of the chase paradigm to visualize the stability of pre-existing, dispersed LDs. DGAT1i is added together with HBSS and the amount of BODIPY493/503-stained LDs present in live cells imaged and quantified over 16 hr. (F) Illustration of the pulse-chase paradigm to visualize the stability of starvation-induced, clustered LDs. Following a 6 hr HBSS (pulse) to induce autophagy-dependent LD biogenesis, DGAT1i is added and the amount of BODIPY493/503-stained LDs present in live cells imaged and quantified over 16 hr. (G) Time-lapse montage of dispersed and clustered LD degradation in live cells treated according to the paradigms in panels E and F. (H) Quantification of the turnover kinetics of dispersed and clustered LDs treated and imaged as in panel G. All graphical data are quantified as mean ± SEM. For the quantified microscopy images, an asterisk indicates a significant difference (p < 0.05, t test) based on n = 50 cells from three independent biological replicates. See also Figure S5.
Figure 4
Figure 4. DGAT1 impacts fatty acid channeling and sequestration in TAG during nutrient deprivation
(A–I) MEFs were starved in HBSS in the presence of vehicle or DGAT1i for 16 hr. (A) Heatmap of metabolomic alterations organized by lipid class. Significantly altered lipids are indicated in blue text (significantly decreased) and red text (significantly increased). (B–I) Quantification showing the relative levels of significantly altered lipids (p < 0.01, t test) (n = 4–5). See also Figure S6.
Figure 5
Figure 5. Analysis of fatty acid channeling during nutrient deprivation using isotopic palmitate tracing
(A–H) MEFs were starved for 16 hr in HBSS in the presence of either d0-C16:0 or d4-C16:0 FFA complexed with 0.5% BSA. Cells were also treated with vehicle or DGAT1i as indicated. (A) Heatmap showing the relative levels of lipids with significant incorporation of d4-C16:0 FFA. A red color indicates increased d4-C16:0 incorporation (scale bar). Lipids that exhibited significantly altered d4-C16:0 incorporation in response to treatment with DGAT1i are indicated in blue text (significantly decreased) and red text (significantly increased). (BH) Quantification showing the relative levels of lipids significantly altered by treatment with DGAT1i (p < 0.01, t test) (n =5).
Figure 6
Figure 6. DGAT1-dependent LD biogenesis protects mitochondrial function during starvation
(A) MEFs were treated as indicated during a 16 hr HBSS starve. Cells were stained with propidium iodide and annexin-V, and the percentage of cell death measured by flow cytometry. (B and C) Oxygen consumption rates (OCR) were measured for MEFs incubated in CM (B) or HBSS (C) together with vehicle or DGAT1i for 16 hr. Oligomycin, FCCP, and rotenone/antimycin were added at the indicated time points. (D and E) Flow cytometry histograms (D) and the corresponding quantification of mean fluorescent intensity (n=3) (E) of MEFs stained with MitoTracker Orange CMTMRos following incubation in CM or HBSS together with vehicle or DGAT1i for 16 hr. (F and G) Flow cytometry histograms (F) and the corresponding quantification of mean fluorescent intensity (n=3) (G) of MEFs stained with MitoTracker Green FM following incubation in CM or HBSS together with vehicle or DGAT1i for 16 hr. (H–J) Flow cytometry histograms (H and I) and the corresponding quantification of mean fluorescent intensity (n=3) (J) of MEFs stained with MitoTracker Orange CMTMRos following treatment with vehicle or DGAT1i during an HBSS starvation for the indicated times. (K) MEFs were incubated in CM or HBSS for 16 hr in the presence or absence of DGAT1i. Mitochondria stained with MitoTracker Orange CMTMRos (red) were visualized by fluorescence microscopy. In the micrographs, white boxes indicate the magnified regions. Scale bars = 10 μm. (L–N) Flow cytometry histograms (L and M) and the corresponding quantification of mean fluorescent intensity (n=3) (N) of MEFs stained with MitoTracker Orange CMTMRos following treatment with vehicle, DGAT1i, and etomoxir as indicated during an HBSS starvation for 16 hr. Etomoxir was added for the final 4 hr or 8 hr of the experiment where indicated. (O) Mitochondria isolated from MEFs were stained with JC-9 and then incubated with increase concentrations of palmitoylcarnitine for 30 min. JC-9 fluorescence and mitochondrial diameter were measured by flow cytometry and the normalized mitochondrial membrane potential determined. The background value of depolarized mitochondria (depol.) was determined by incubation with valinomycin. All graphical data are quantified as mean ± SEM (n=3). An asterisk indicates a significant difference (p < 0.05, t test). See also Figure S6 and Figure S7.
Figure 7
Figure 7. DGAT1-dependent lipid droplet biogenesis prevents lipotoxicity during starvation-induced autophagy
In the presence of sufficient amino acids, mTORC1 is recruited to the lysosome and activated through the actions of the Rag GTPases, the Ragulator complex, and the V-ATPase. Active mTORC1 inhibits the initiation of autophagy. In the absence of amino acids, mTORC1 is inactive and autophagy is upregulated. This pathway can be modulated by the Gator1 complex and AMPK signaling. Autophagic degradation of membranous organelles releases FAs that are selectively channeled into DGAT1-dependent LDs, which form clusters of LDs in close proximity to mitochondria. These new LDs are degraded by ATGL-mediated lipolysis, presumably supplying FAs to mitochondria for energy. These LDs also sequester FA in TAG, preventing acylcarnitine accumulation, which leads to mitochondrial dysfunction.

Comment in

References

    1. Alers S, Loffler AS, Wesselborg S, Stork B. Role of AMPK-mTOR-Ulk1/2 in the regulation of autophagy: cross talk, shortcuts, and feedbacks. Mol Cell Biol. 2012;32:2–11. - PMC - PubMed
    1. Bailey AP, Koster G, Guillermier C, Hirst EMA, MacRae JI, Lechene CP, Postle AD, Gould AP. Antioxidant Role for Lipid Droplets in a Stem Cell Niche of Drosophila. Cell. 2015;163:340–353. - PMC - PubMed
    1. Bar-Peled L, Chantranupong L, Cherniack AD, Chen WW, Ottina KA, Grabiner BC, Spear ED, Carter SL, Meyerson M, Sabatini DM. A Tumor suppressor complex with GAP activity for the Rag GTPases that signal amino acid sufficiency to mTORC1. Science. 2013;340:1100–1106. - PMC - PubMed
    1. Beavis AD, Brannan RD, Garlid KD. Swelling and contraction of the mitochondrial matrix. I. A structural interpretation of the relationship between light scattering and matrix volume. J Biol Chem. 1985;260:13424–13433. - PubMed
    1. Benjamin DI, Li DS, Lowe W, Heuer T, Kemble G, Nomura DK. Diacylglycerol Metabolism and Signaling Is a Driving Force Underlying FASN Inhibitor Sensitivity in Cancer Cells. ACS Chem Biol. 2015;10:1616–1623. - PMC - PubMed

MeSH terms